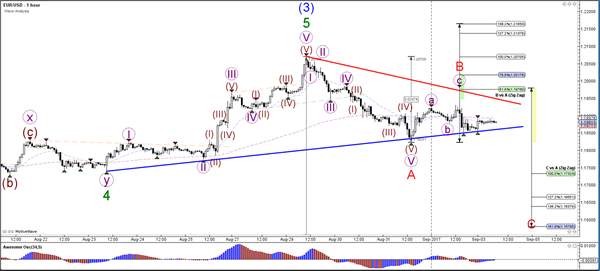
Currency pair EUR/USD
The EUR/USD could be building an ABC (red) correction within a larger wave 4 (blue) pattern. A break below the support trend line (blue) would increase the likelihood of such an ABC. The ABC correction (red) is invalidated if price breaks above the 138.2% Fib at 1.2165. A break above the resistance trend line (red) could indicate that there is bullish pressure to test the Fib levels of wave B vs A.
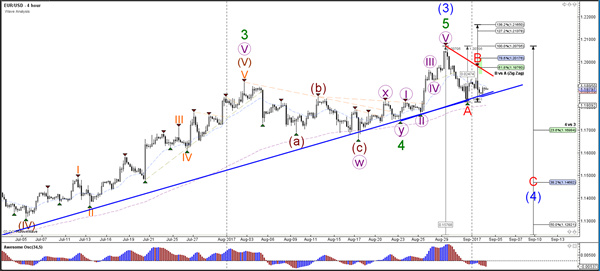
The EUR/USD is building a triangle chart pattern which is indicated by the trend lines (red/blue).
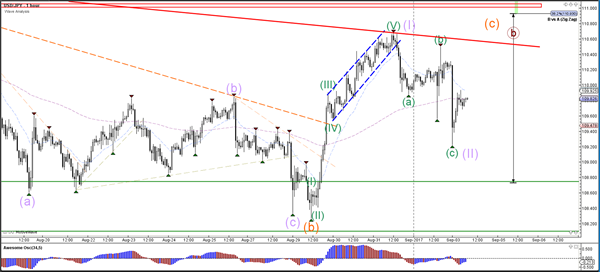
Currency pair USD/JPY
The USD/JPY continues with its sideways correction between the support zone and the resistance levels (red line and red box). For the moment a larger bullish wave C (orange) still seems more likely.
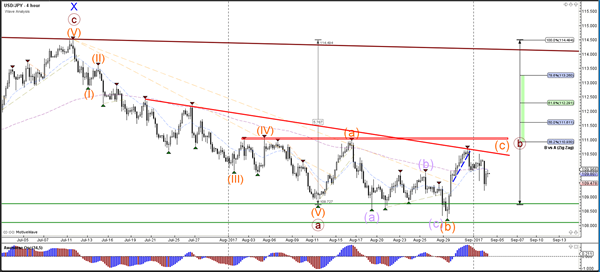
The USD/JPY has completed a bearish ABC (green) correction which could indicate a potential bullish bounce. But the overall market structure remains choopy.
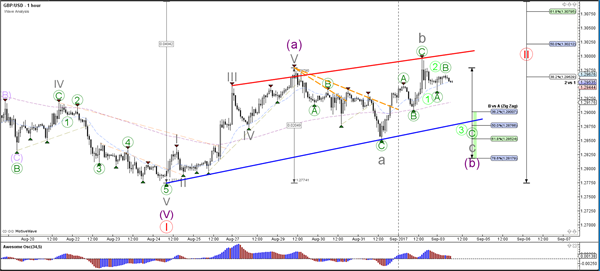
Currency pair GBP/USD
The GBP/USD is building a corrective bullish channel (red/blue). The bullish price action is probably part of a wave 2 (red).
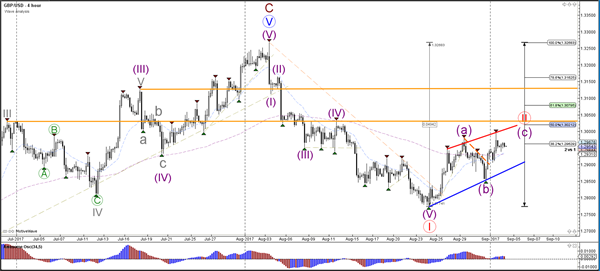
The GBP/USD seems to have completed an ABC (green) correction within wave B (grey), which could indicate that a new bearish correction could take place within an expanded wave B (purple).