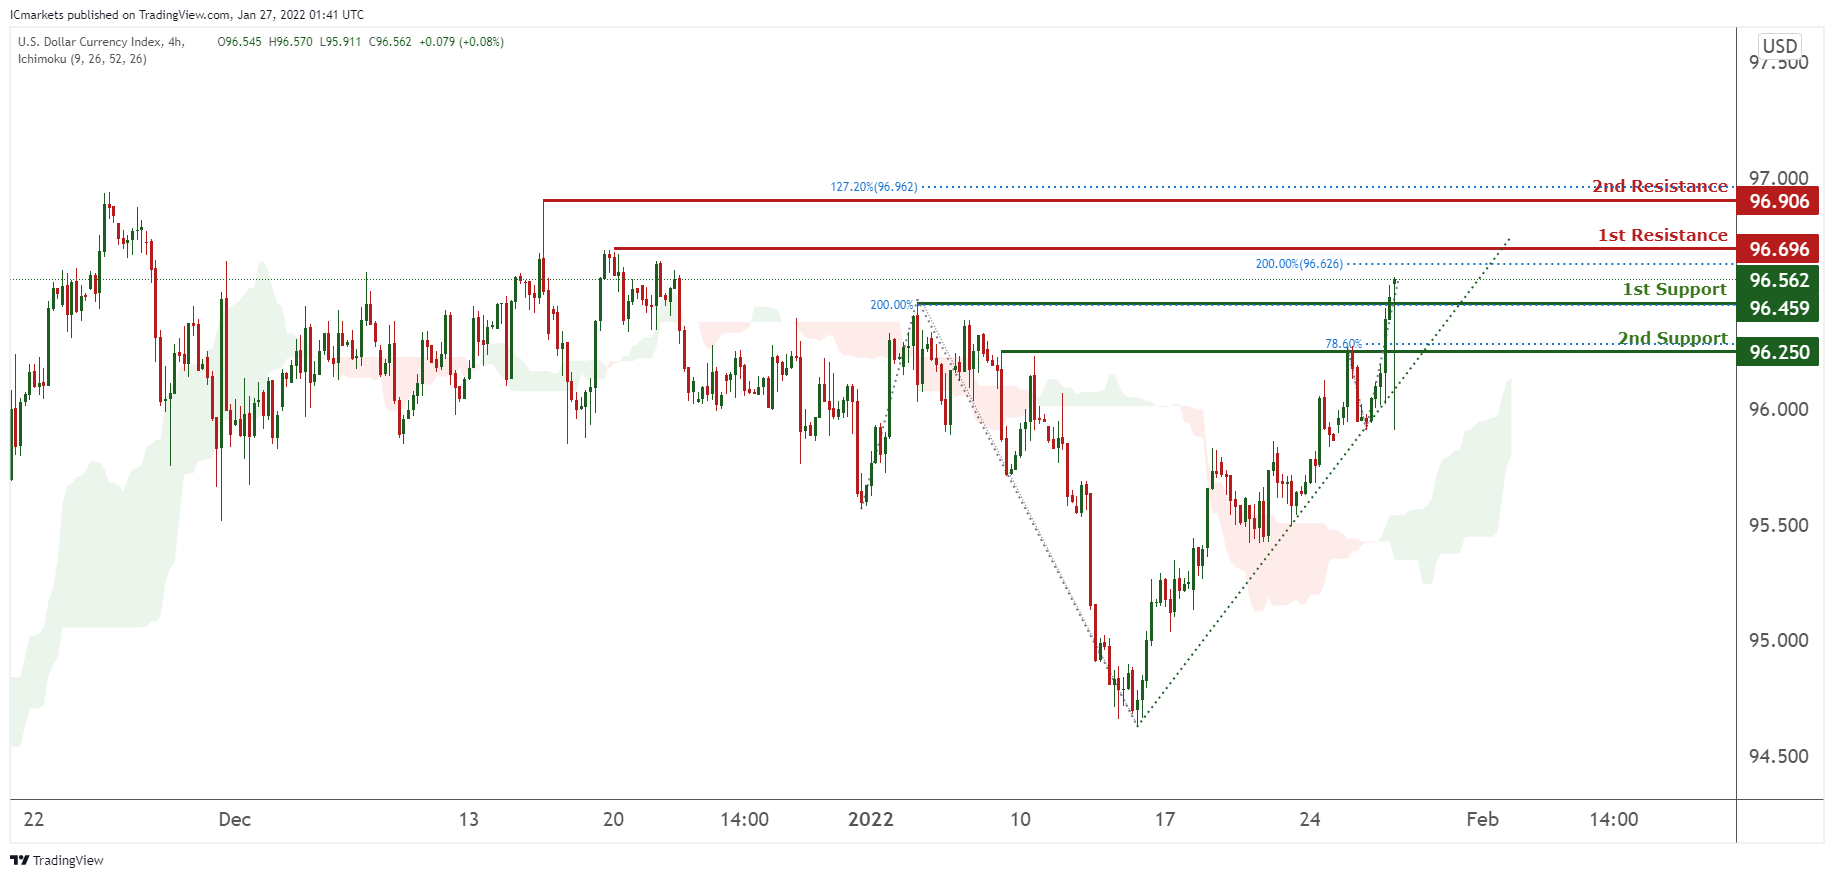
DXY:
On the H4 timeframe, prices are on bullish momentum and abiding to our ascending trendline. We would expect potentially a bounce from our 1st support at 96.459 in line with 200% Fibonacci projection and 127.2% towards our 1st resistance at 96.696 in line with 200% Fibonacci projection. Prices are trading above our ichimoku support and also ascending trendline, further supporting our bullish bias.
Areas of consideration:
- H4 time frame, 1st resistance at 96.696
- H4 time frame, 1st support at 96.459
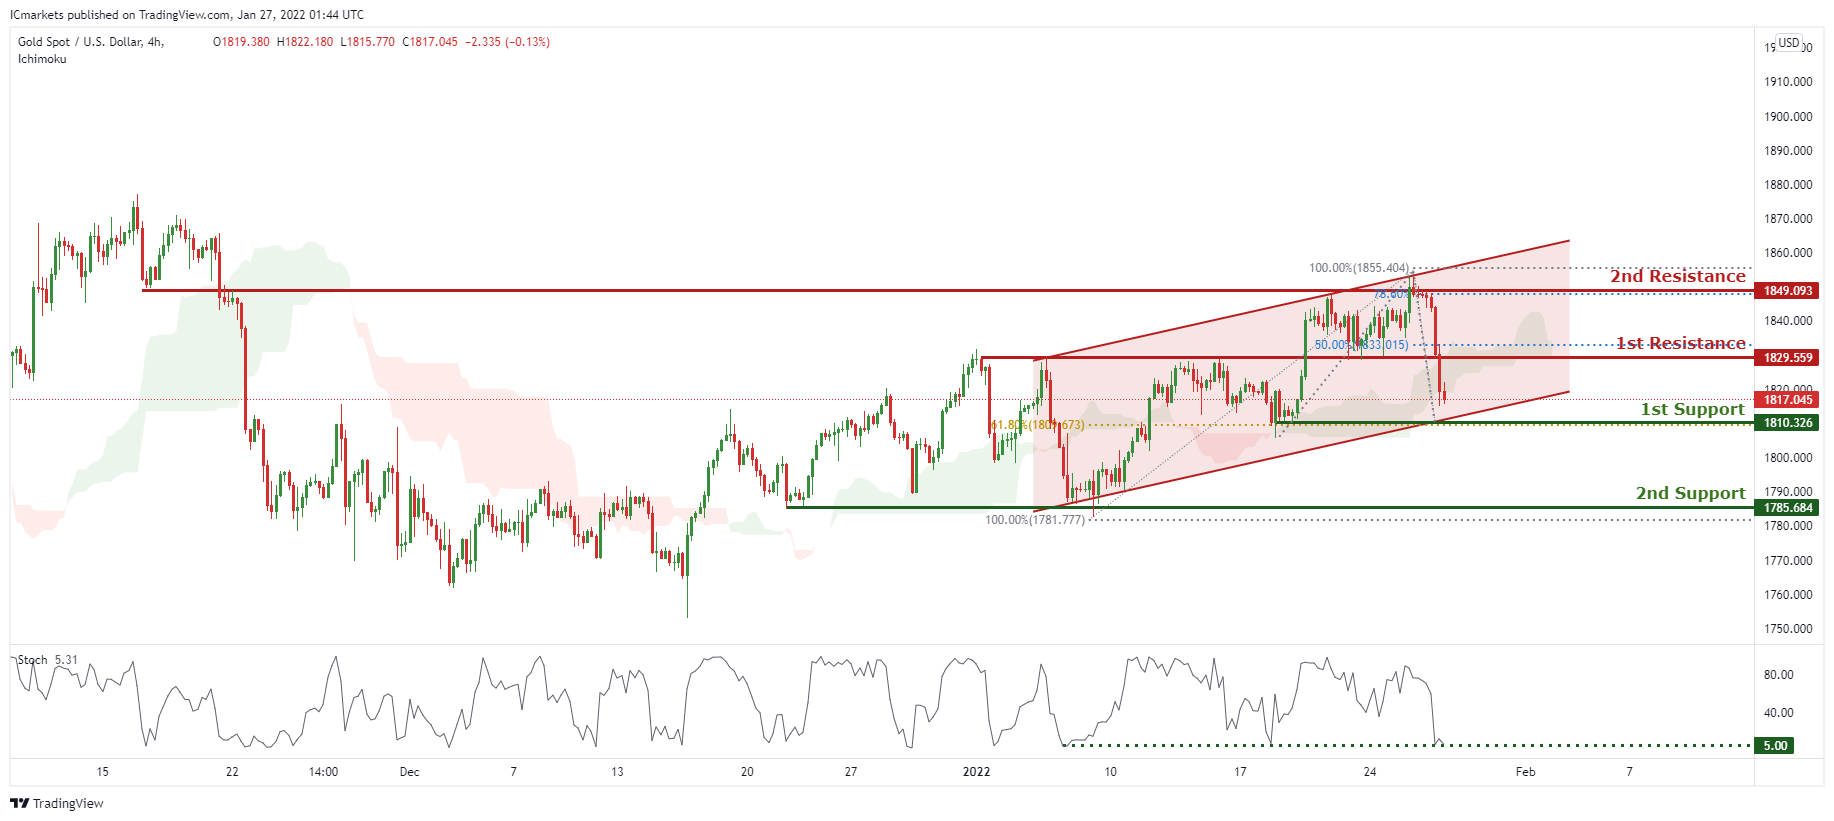
XAU/USD (GOLD):
On the H4 chart, prices are on bullish momentum and consolidating in a parallel channel. We see a potential for a dip from our 1st support in line with 61.8% Fibonacci retracement at 1810.326 in line with 61.8% Fibonacci retracement towards our 1st resistance at 1829.559 in line with 50% Fibonacci retracement. RSI are close to a level where bounces previously occurred.
Areas of consideration:
- 4h 1st support at 1810.326
- 4h 1st resistance at 1829.559
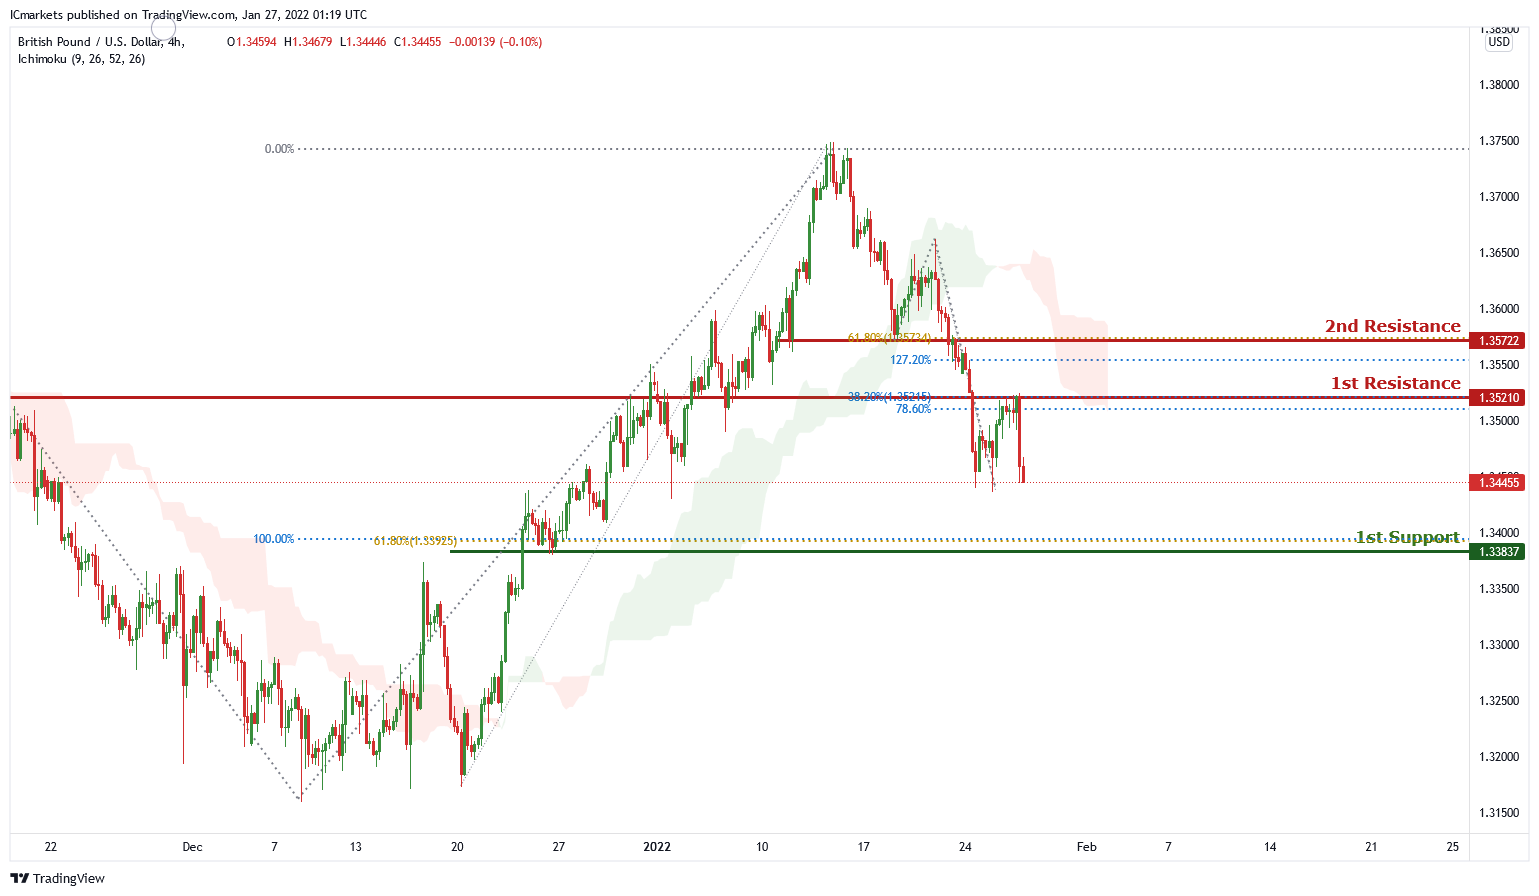
GBP/USD:
On the H4 chart price is between the 1st resistance level of 1.35210 which is also 38.2% Fibonacci retracement, 78.6% Fibonacci projection and 1st support level of 1.33837 which is also 100% Fibonacci projection and 61.8% Fibonacci retracement. Price can potentially continue to dip to the 1st support level. Our bearish bias is supported by the ichimoku cloud indicator as price is trading below it.
Areas of consideration
- H4 1st support at 1.33837
- H4 1st resistance at 1.35210
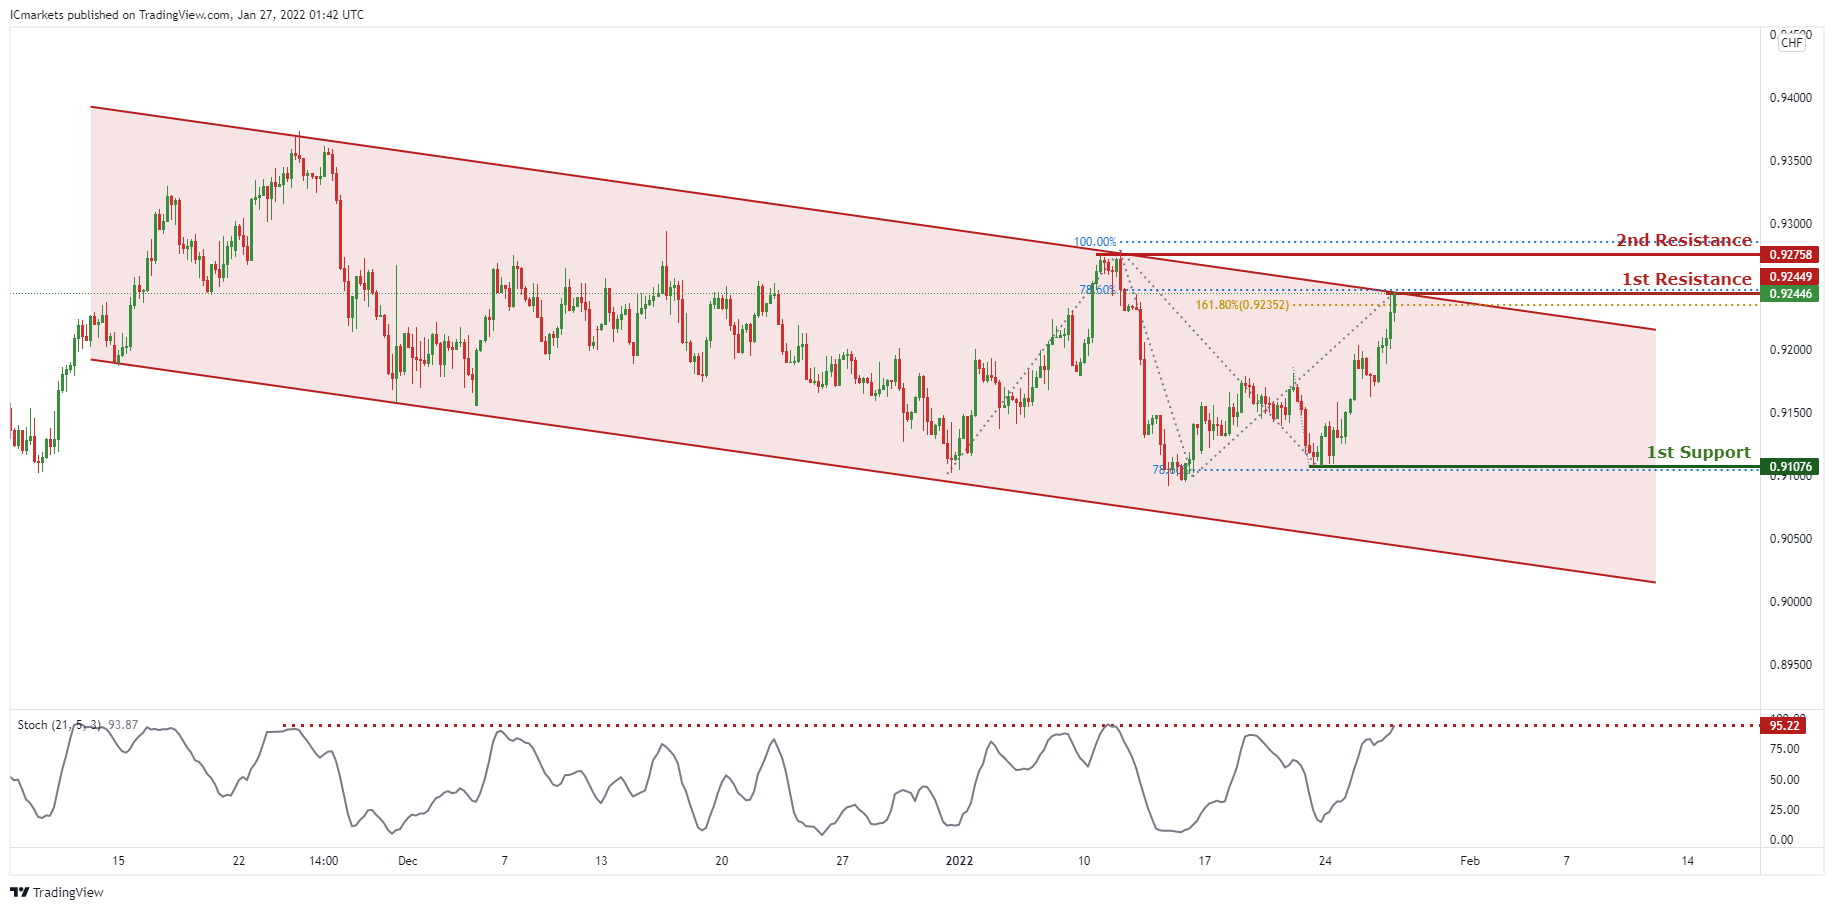
USD/CHF:
On the H4 timeframe, price is abiding to a descending channel, signifying a bearish momentum. Price is reacting at 1st Resistance, we can expect price to drop from 1st Resistance in line with 161.8% Fibonacci extension and 78.6% Fibonacci projection towards 1st Support in line with 78.6% Fibonacci projection. Our bearish bias is further supported by the stochastic indicator where the %K line is approaching the resistance level.
Areas of consideration:
- Watch 1st Support at 0.90961
- Watch 1st Resistance at 0.91967
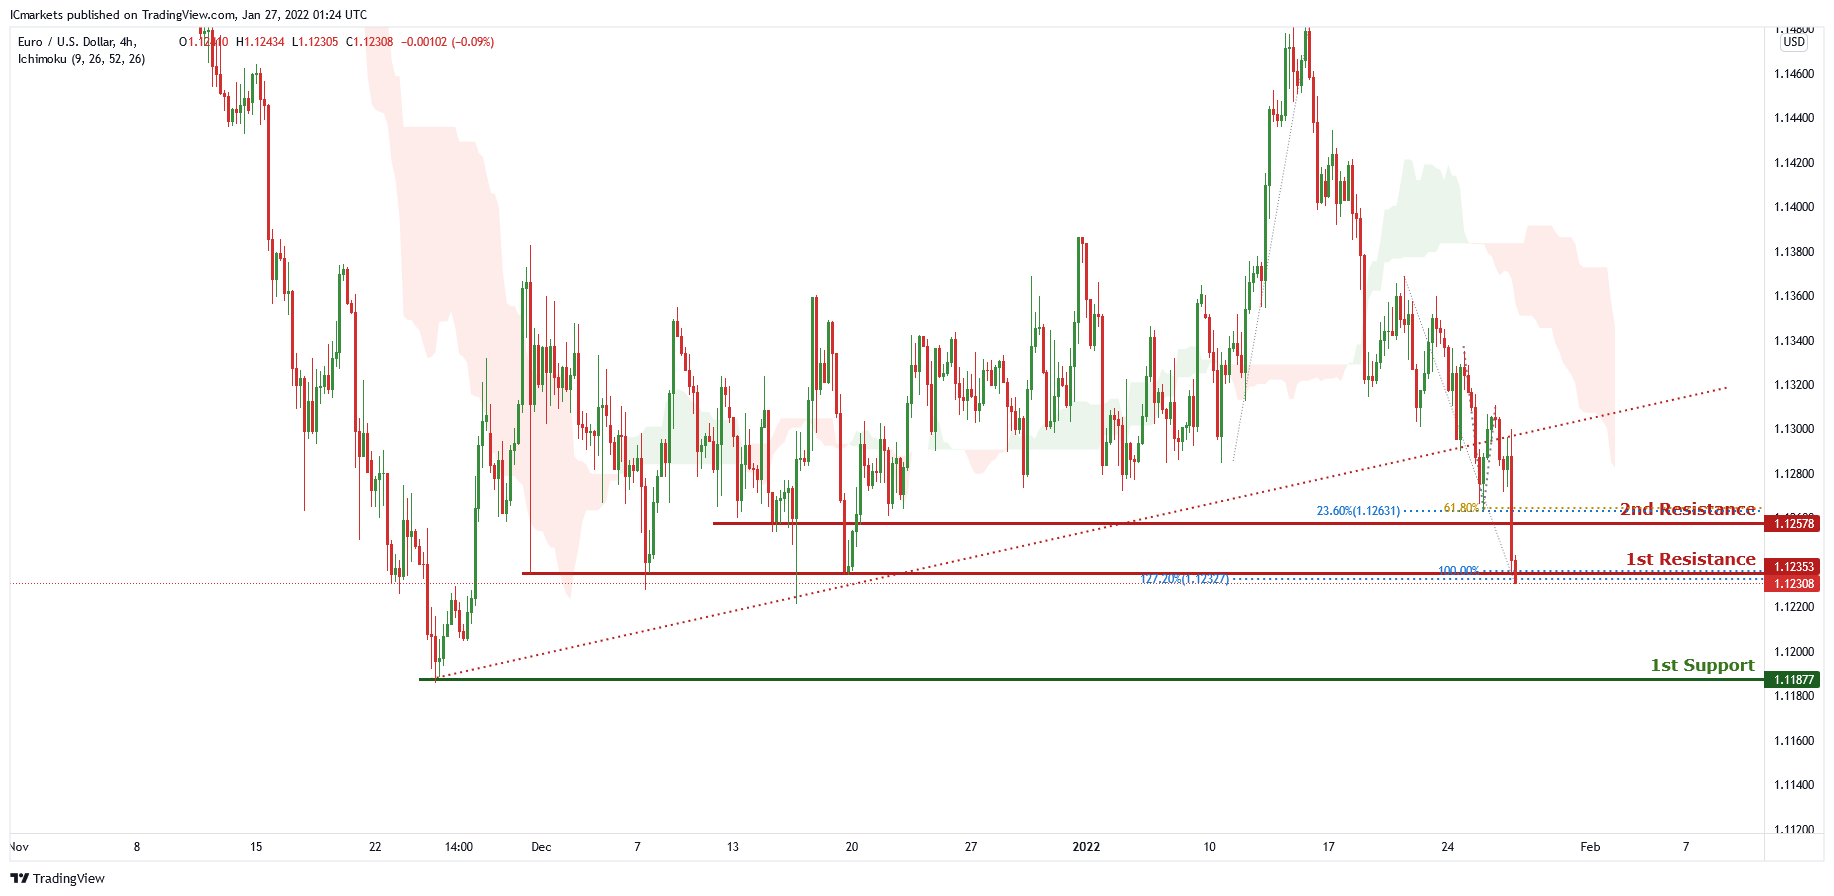
EUR/USD :
On the H4 chart , price has recently broken out of the ascending trendline and is near 1st resistance level of 1.12353 which is also 100% Fibonacci projection and 127.2% Fibonacci retracement. Price can potentially dip to the 1st support level of 1.11877 which is also the graphical swing low support. Our bearish bias is supported by the ichimoku cloud indicator as price is trading below it.
Areas of consideration
- H4 1st support at 1.11877
- H4 1st resistance at 1.12353
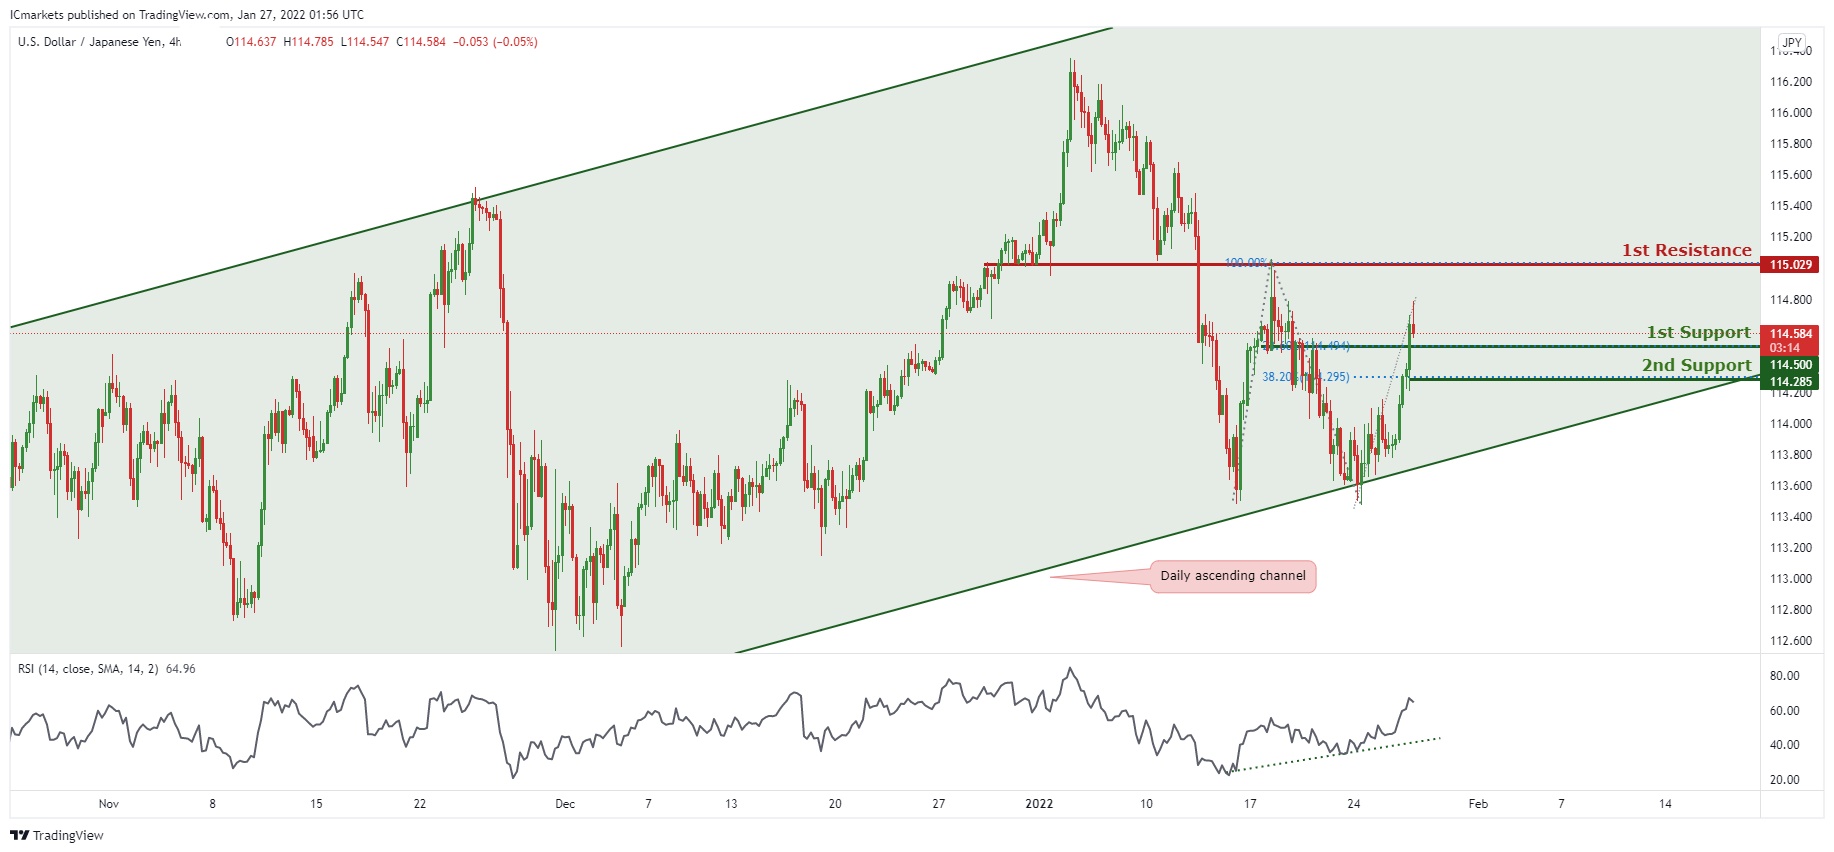
USD/JPY:
In reference to yesterday’s analysis, we can see that price indeed bounced to 1st Resistance @ 114.813. On the H4 timeframe, is abiding to the ascending channel on the daily, signifying an overall bullish momentum. We can now expect the price to bounce from 1st Support in line with 23.6% Fibonacci retracement towards 1st Resistance in line with 100% Fibonacci projection. Our bullish bias is further supported by the RSI indicator abiding to the ascending trendline support.
Areas of consideration:
- H4 1st resistance level 115.029
- H4 1st support level 114.500
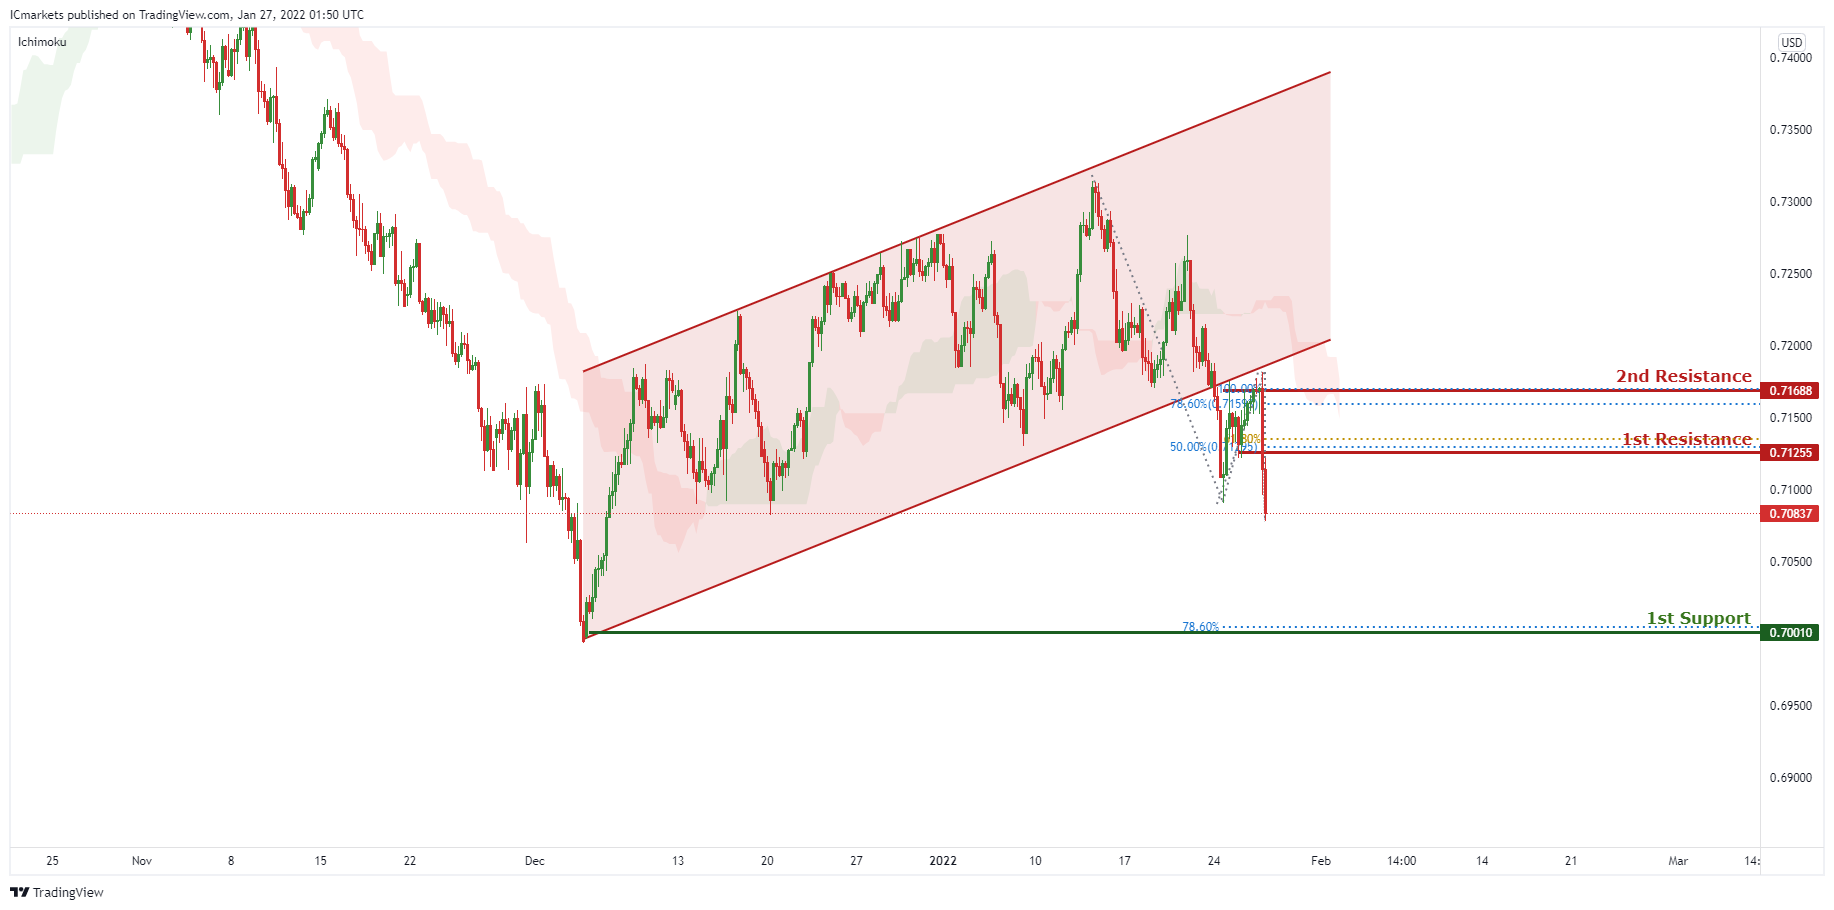
AUD/USD:
In reference to yesterday’s analysis, price indeed dropped to 1st Support @ 0.70883. On the H4, price broke out of the ascending channel, signifying an overall bearish momentum. We can expect price to drop from 1st Resistance in line with 61.8% Fibonacci projection and 50% Fibonacci retracement towards 1st Support in line with graphical support level and 78.6% Fibonacci projection. Our bearish bias is further supported by the Ichimoku cloud indicator where the price is holding below it.
Areas of consideration:
- H4 1st Support level 0.70010
- H4 1st resistance level 0.71255
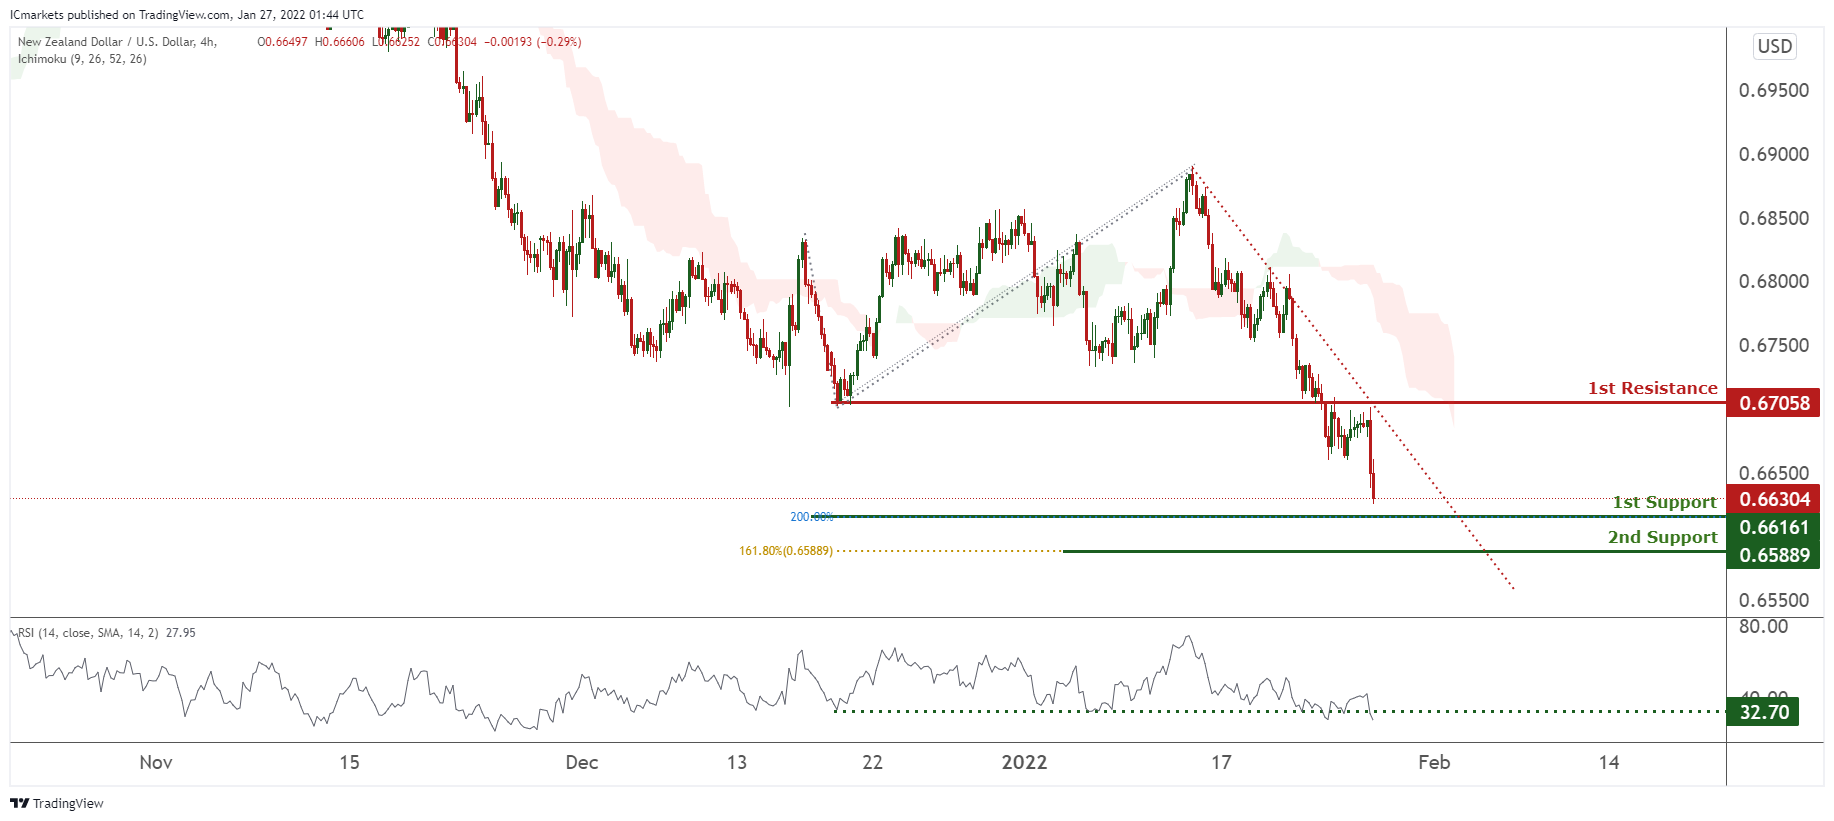
NZD/USD:
On the H4, prices are on bearish momentum and abiding to our bearish trendline. We see the potential for a short bounce from our 1st support at 200% FIbonacci projection towards our descending trendline at 1st resistance at 0.67058 which is a graphical overlap. RSI is at a level where bounces occurred previously. Alternatively, our stop loss will be placed at our 2nd support at 0.65889 in line with 161.8% Fibonacci Projection.
Areas of consideration:
- H4 time frame, 1st resistance at 0.67058
- H4 time frame, 1st support at 0.66161
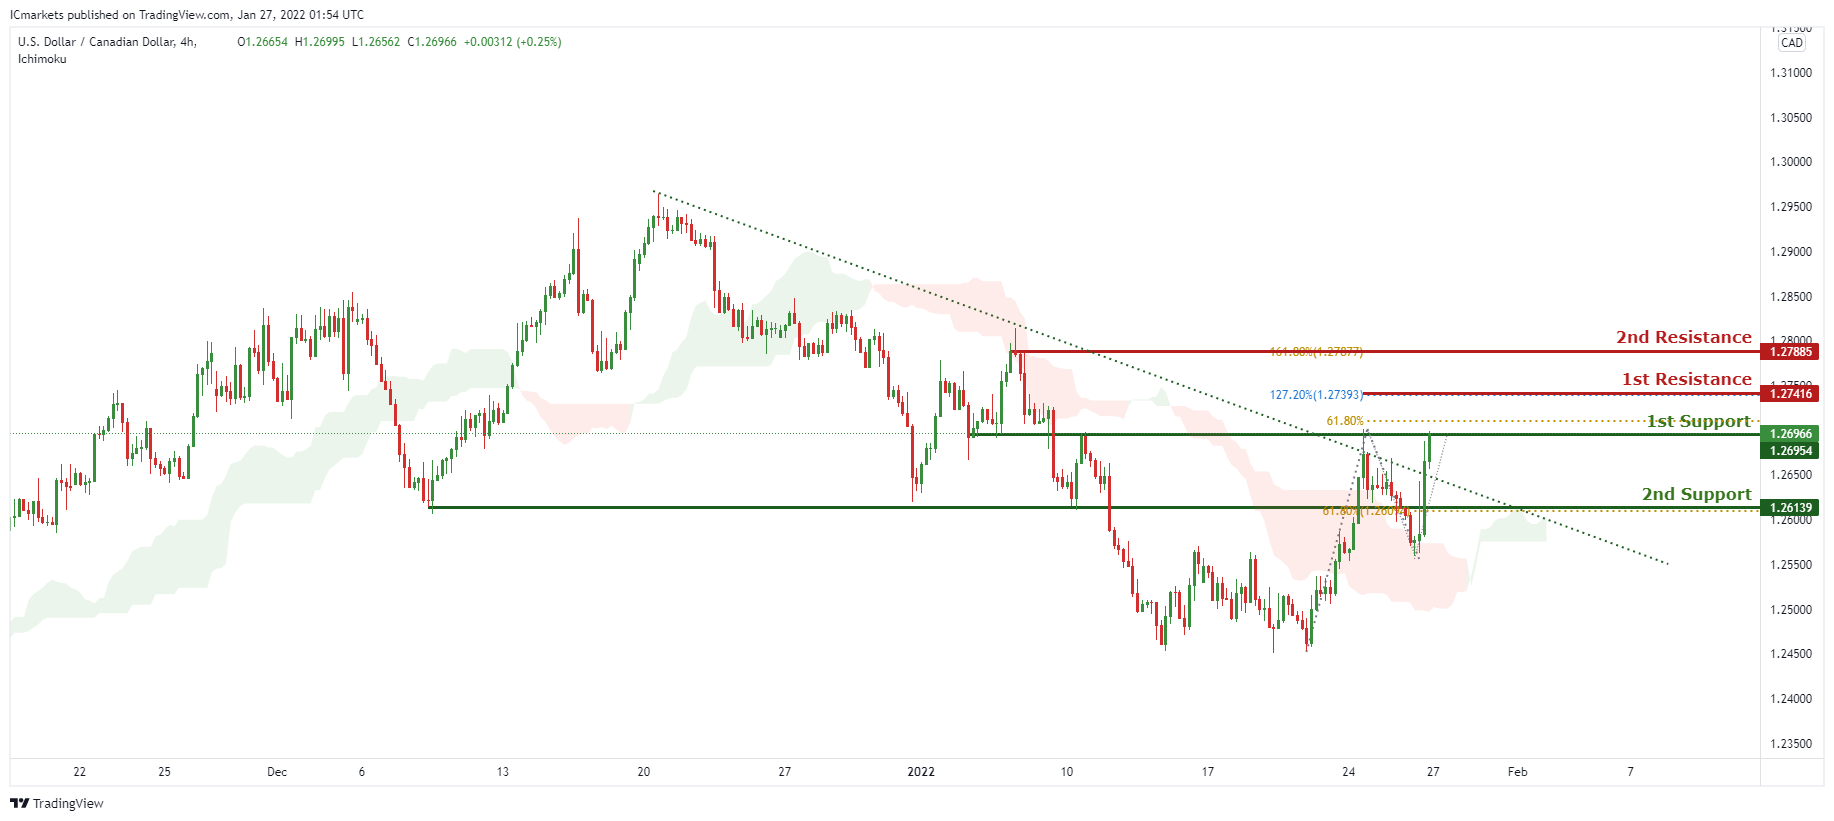
USD/CAD:
On the H4, prices have broken out of our descending trendline and are on bullish momentum. We see the potential for a bounce from our 1st support at 1.26954 in line with 61.8% Fibonacci extension towards our 1st resistance at 1.27416 in line with 127.2% Fibonacci extension. Alternatively, price may break 1st support structure and head for 2nd support at 1.26139, in line with 61.8% Fibonacci projection and horizontal swing low support. Prices are trading above our ichimoku cloud support, further supporting our bullish bias.
Areas of consideration:
- H4 time frame, 1st support at 1.26966
- H4 time frame, 1st resistance at 1.27416
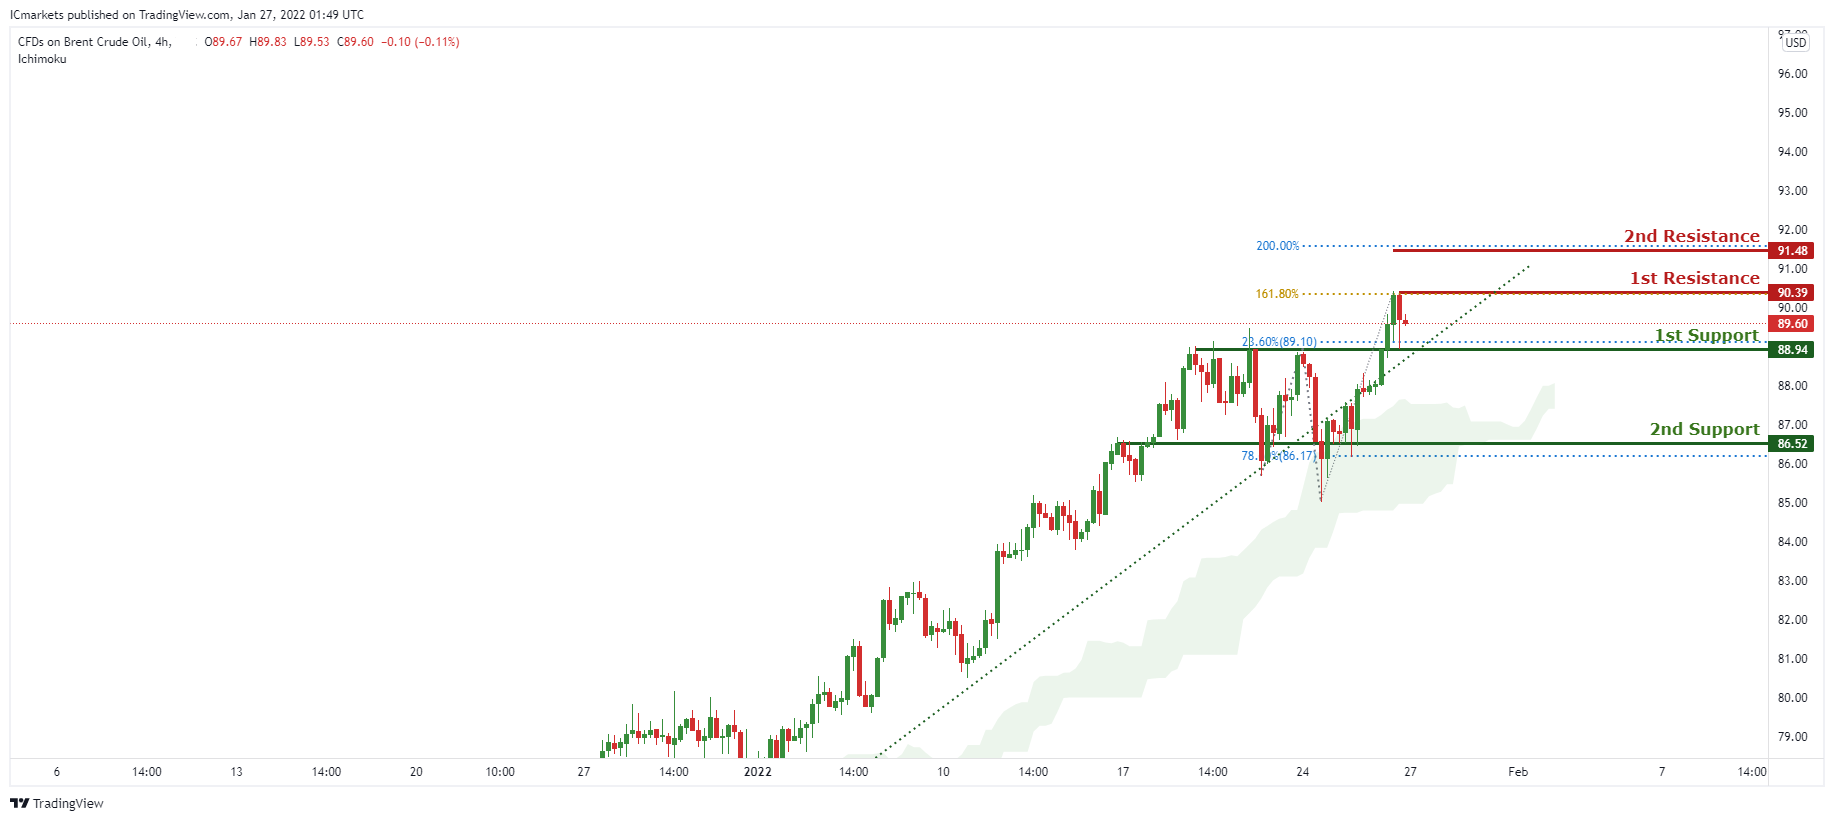
OIL:
On the H4, are on bullish momentum and abiding to our ascending trendline support. We expect a potential bounce from our 1st support at 88.94 in line with 23.6% Fibonacci retracement towards our 1st resistance at 90.39 in line with 161.8% Fibonacci projection. Prices are trading above our ichimoku clouds, further supporting our bullish bias.
Areas of consideration:
- H4 time frame, 1st resistance of 90.39
- H4 time frame, 1st support of 88.52
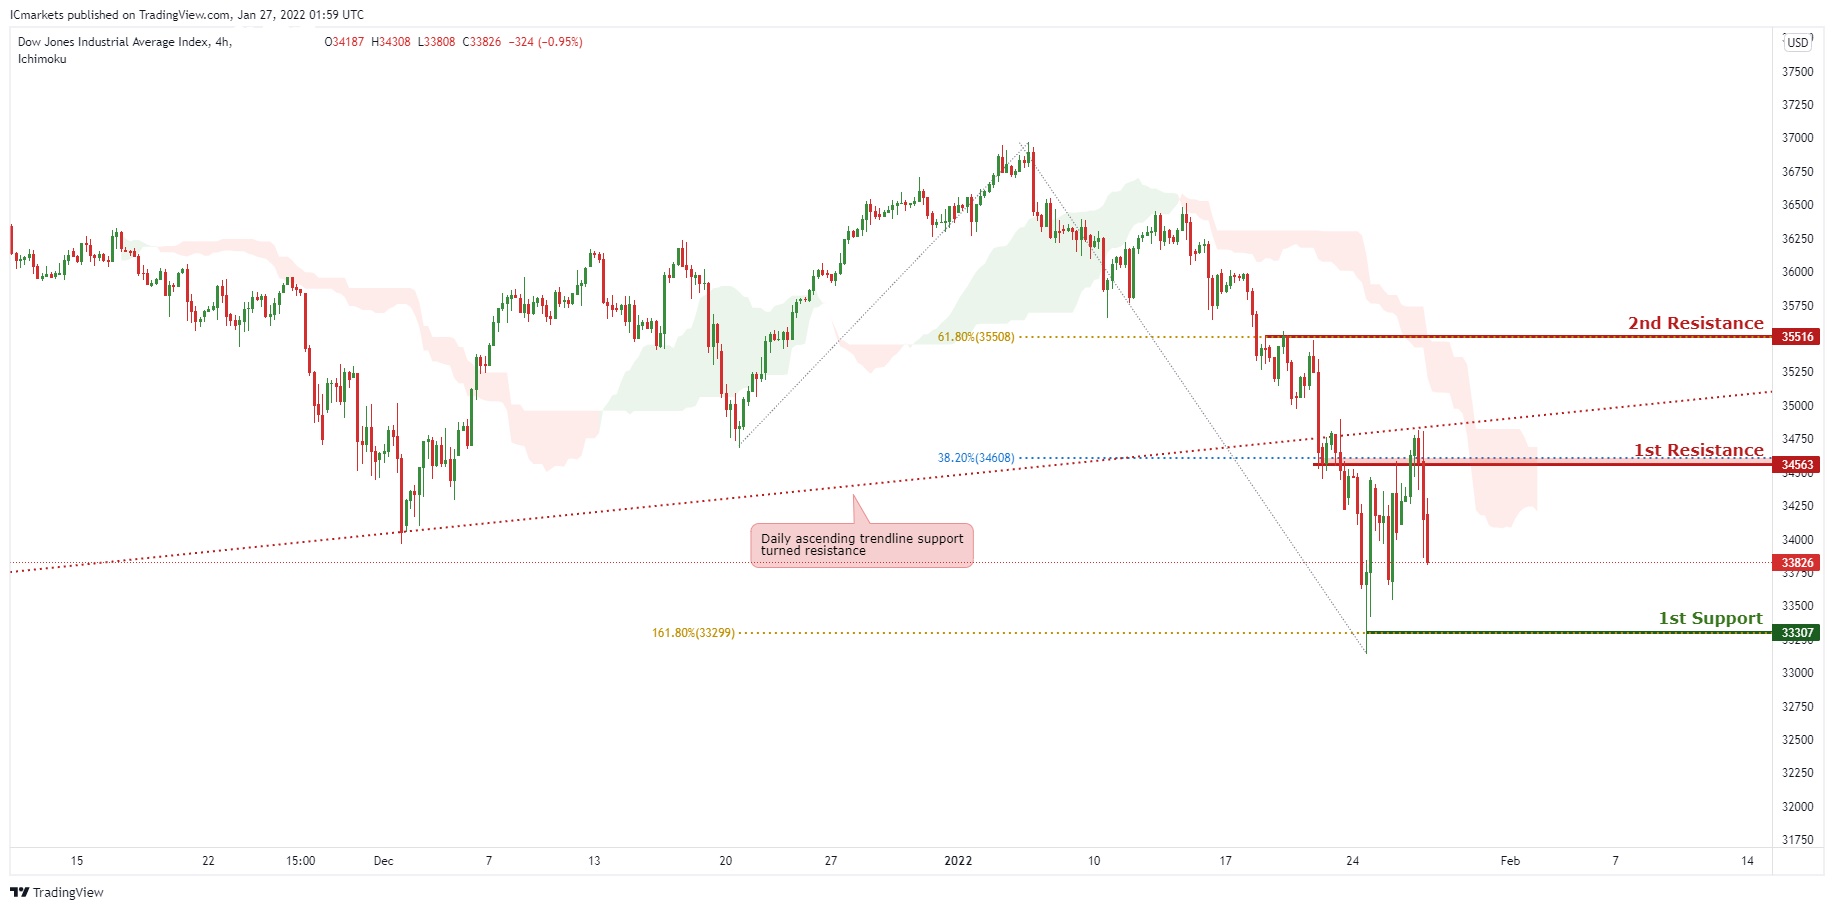
Dow Jones Industrial Average:
On the H4, with price moving below the ichimoku cloud, signifying an overall bearish momentum. We can expect price to drop from our 1st resistance at 34563 in line horizontal graphical overlap and 38.2% Fibonacci retracement towards 1st support in line with horizontal overlap support ,161.8% Fibonacci extension level at 33307. Alternatively, price may break 1st resistance structure and head for 2nd resistance, which coincides with 61.8% Fibonacci retracement at 35516. Traders should wait for price to swing higher or lower before entering.
Areas of consideration:
- H4 time frame, 1st resistance of 34563
- H4 time frame, 1st support of 33307