
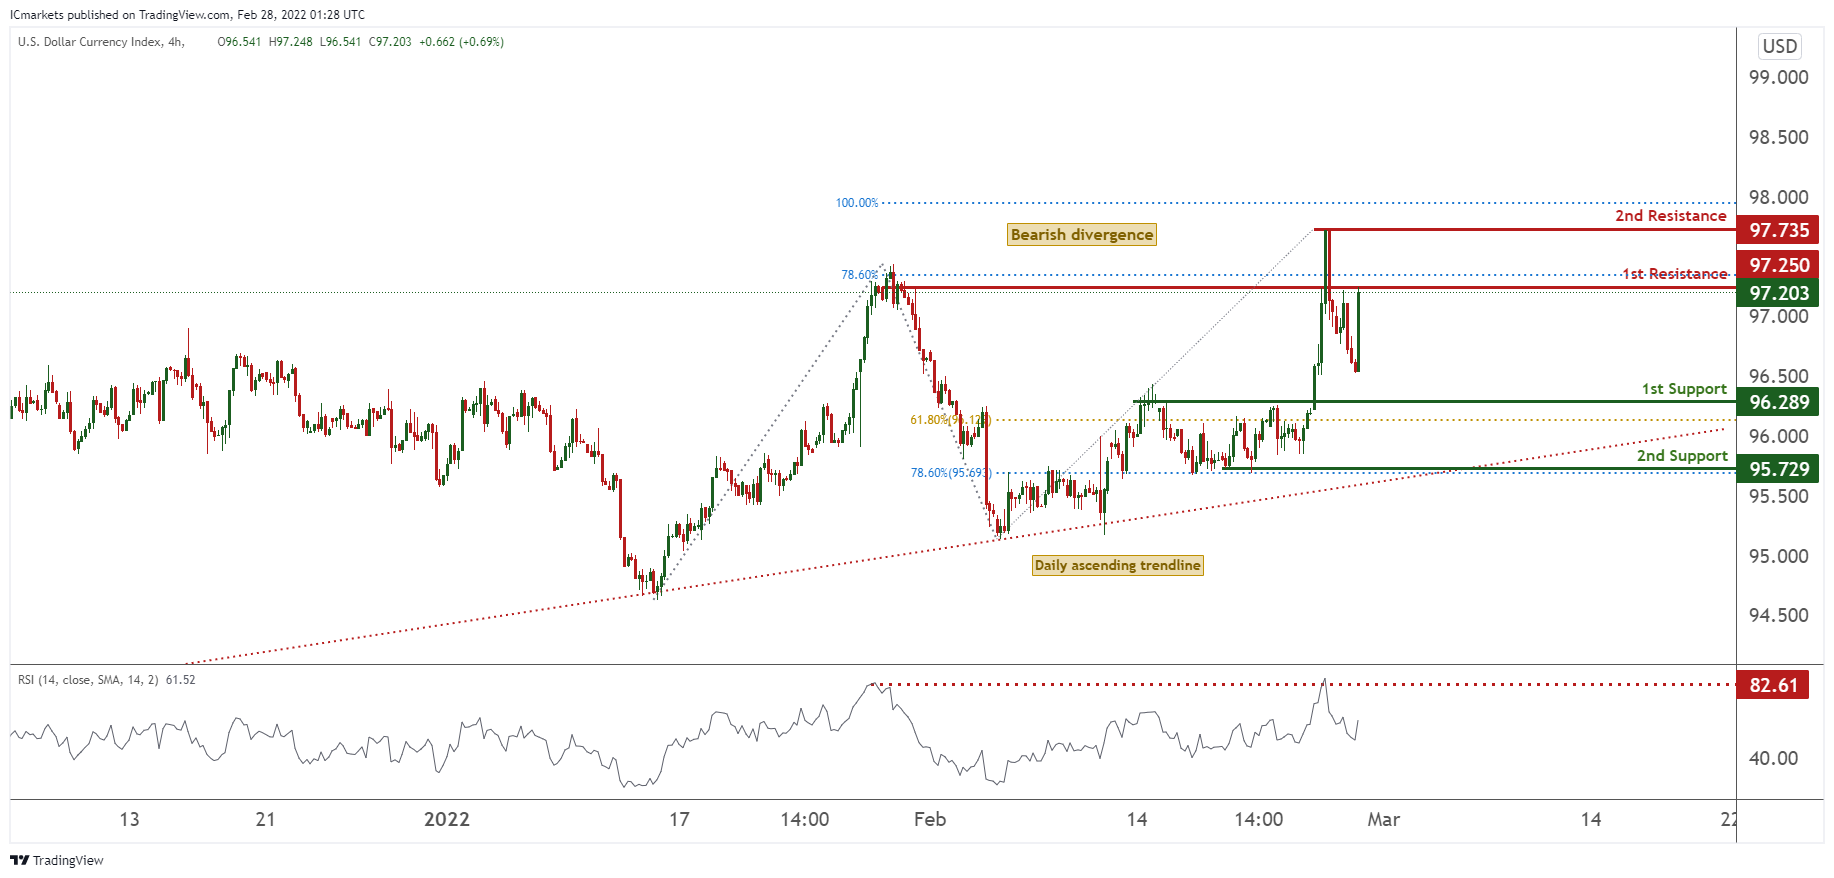
DXY:
On the H4 timeframe, prices are on bullish momentum and abiding to an daily ascending trendline. We see the potential for bearish dip from our 1st resistance at 97.250 in line with 78.6% Fibonacci extension towards our 1st support at 96.289 in line with 61.8% Fibonacci retracement. RSI is at a level where dips occurred previously further supporting our bearish bias.
Areas of consideration:
- H4 time frame, 1st resistance at 97.250
- H4 time frame, 1st support at 96.289
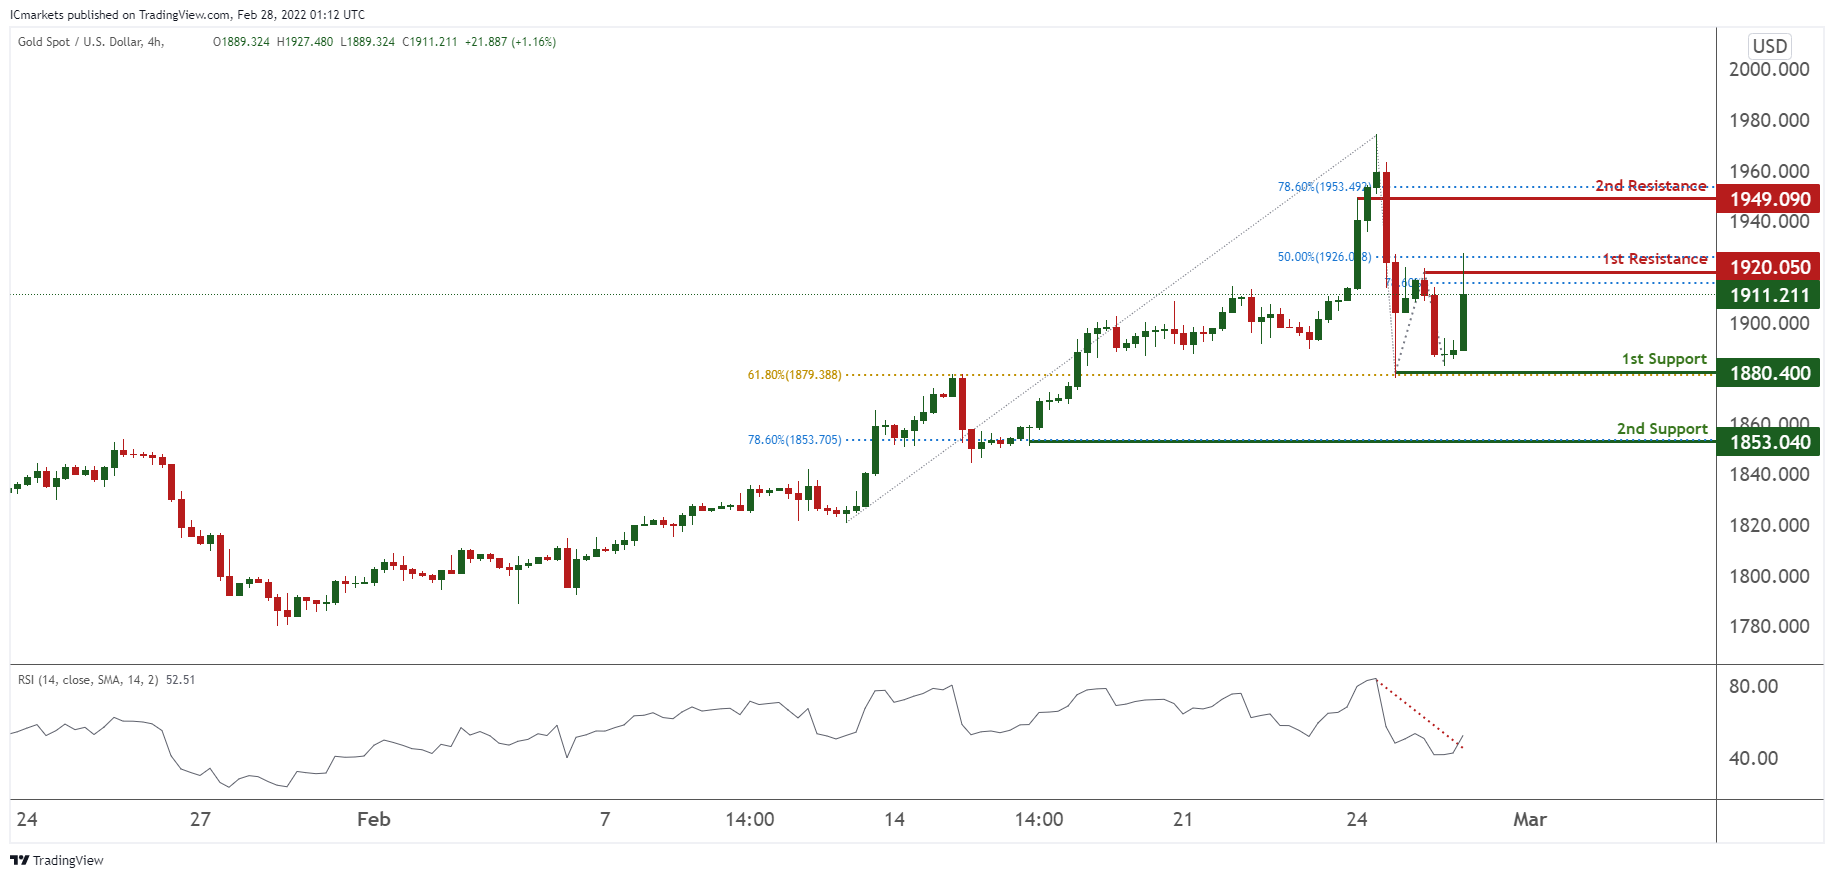
XAU/USD (GOLD):
On the H4 chart, prices are at a pivot and at a graphical resistance. We see potential for a dip from our 1st resistance at 1920.050 in line with 78.6% Fibonacci extension and 50% FIbonacci retracement towards our 1st support at 1880.400 in line with 61.8% Fibonacci retracement. Our beairsh bias is further supported by RSI depicting bearish momentum.
Areas of consideration:
- 4h 1st support at 1880.400
- 4h 1st resistance at 1920.050
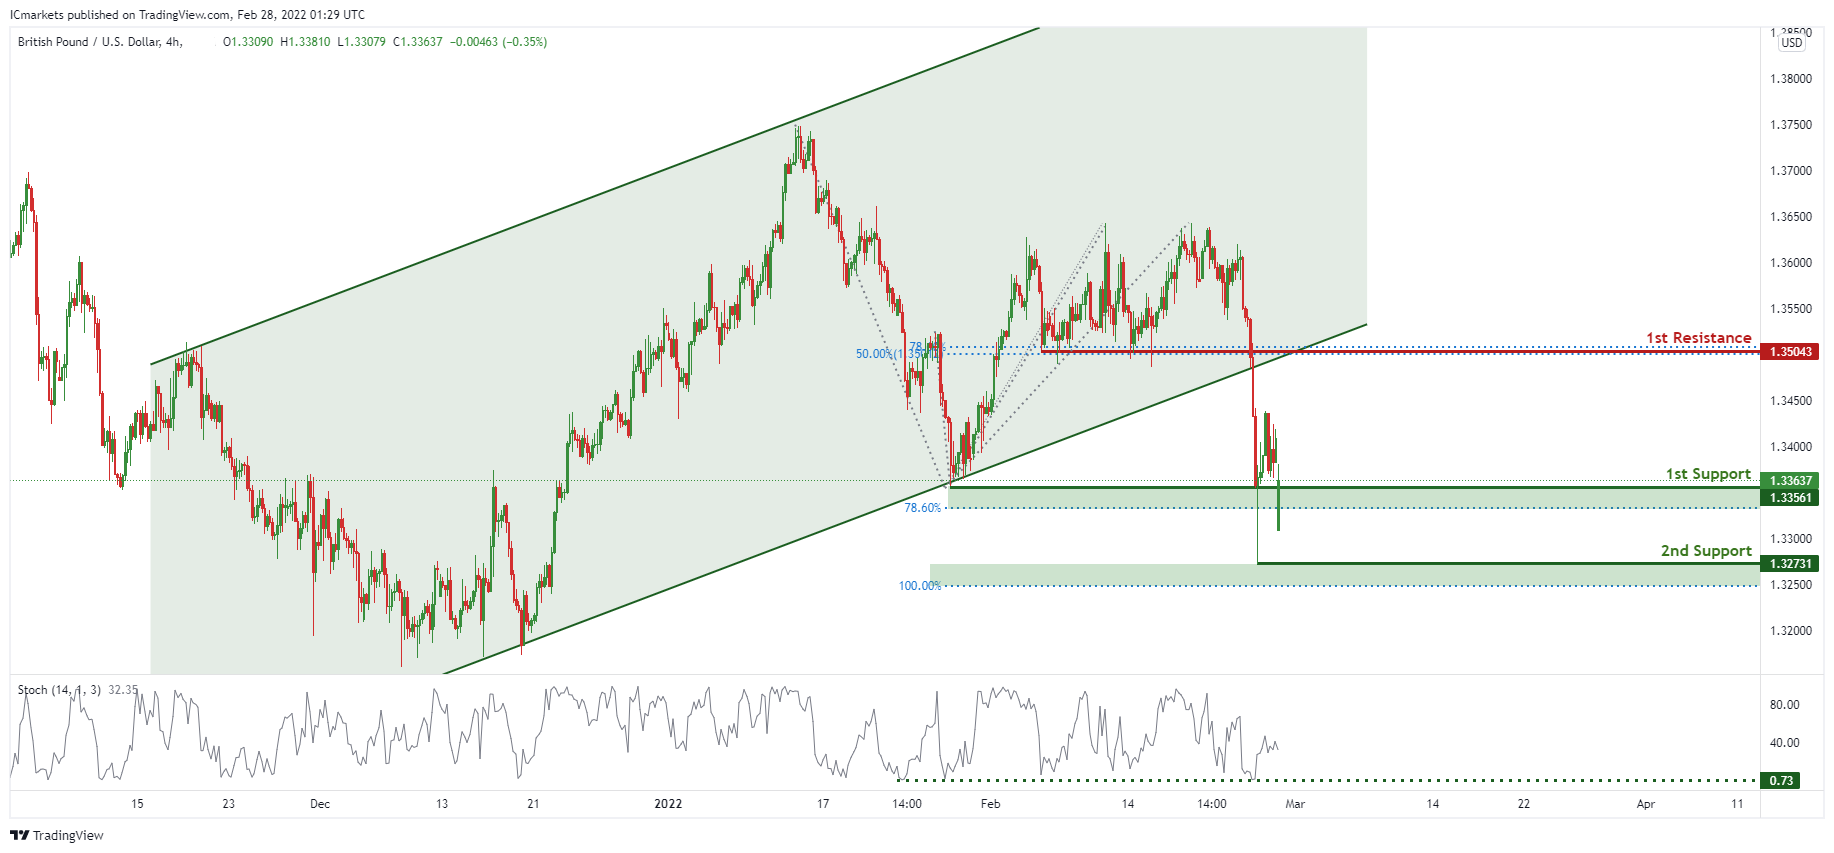
GBP/USD:
On the H4 chart , price has recently broken out of the ascending channel and is near 1st support level of 1.33561 in line with 78.6% Fibonacci projection. Price can potentially bounce from this level to 1st resistance level of 1.35043 in line with 50% Fibonacci retracement and 78.6% Fibonacci projection. Our bullish bias is supported by the stochastic indicator as it is at support level
Areas of consideration
- H4 1st resistance at 1.35043
- H4 1st support at 1.33561
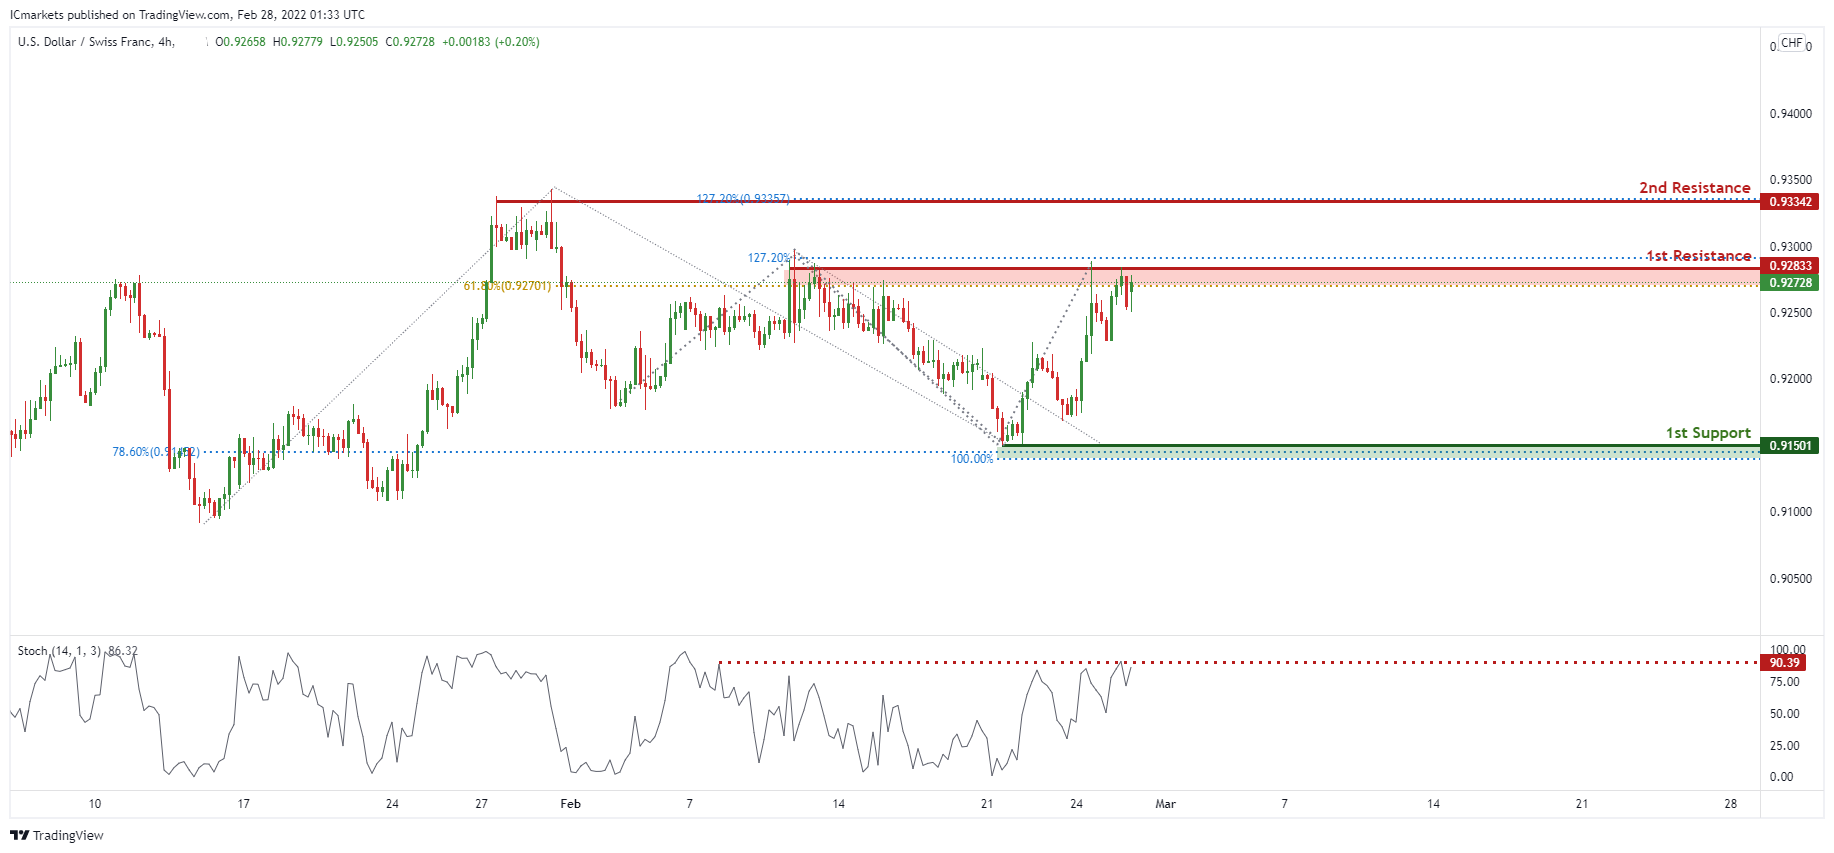
USD/CHF:
On the H4 chart , price is near the first resistance level of 0.92833 in line with 61.8% Fibonacci retracement and 127.2% Fibonacci projection. Price can potentially dip to the 1st support level of 0.91501 in line with 100% Fibonacci projection and 78.6% Fibonacci retracement. Our bearish bias is supported by the stochastic indicator as it is at resistance level.
Areas of consideration :
- H4 1st resistance at 0.92833
- H4 1st support at 0.91501
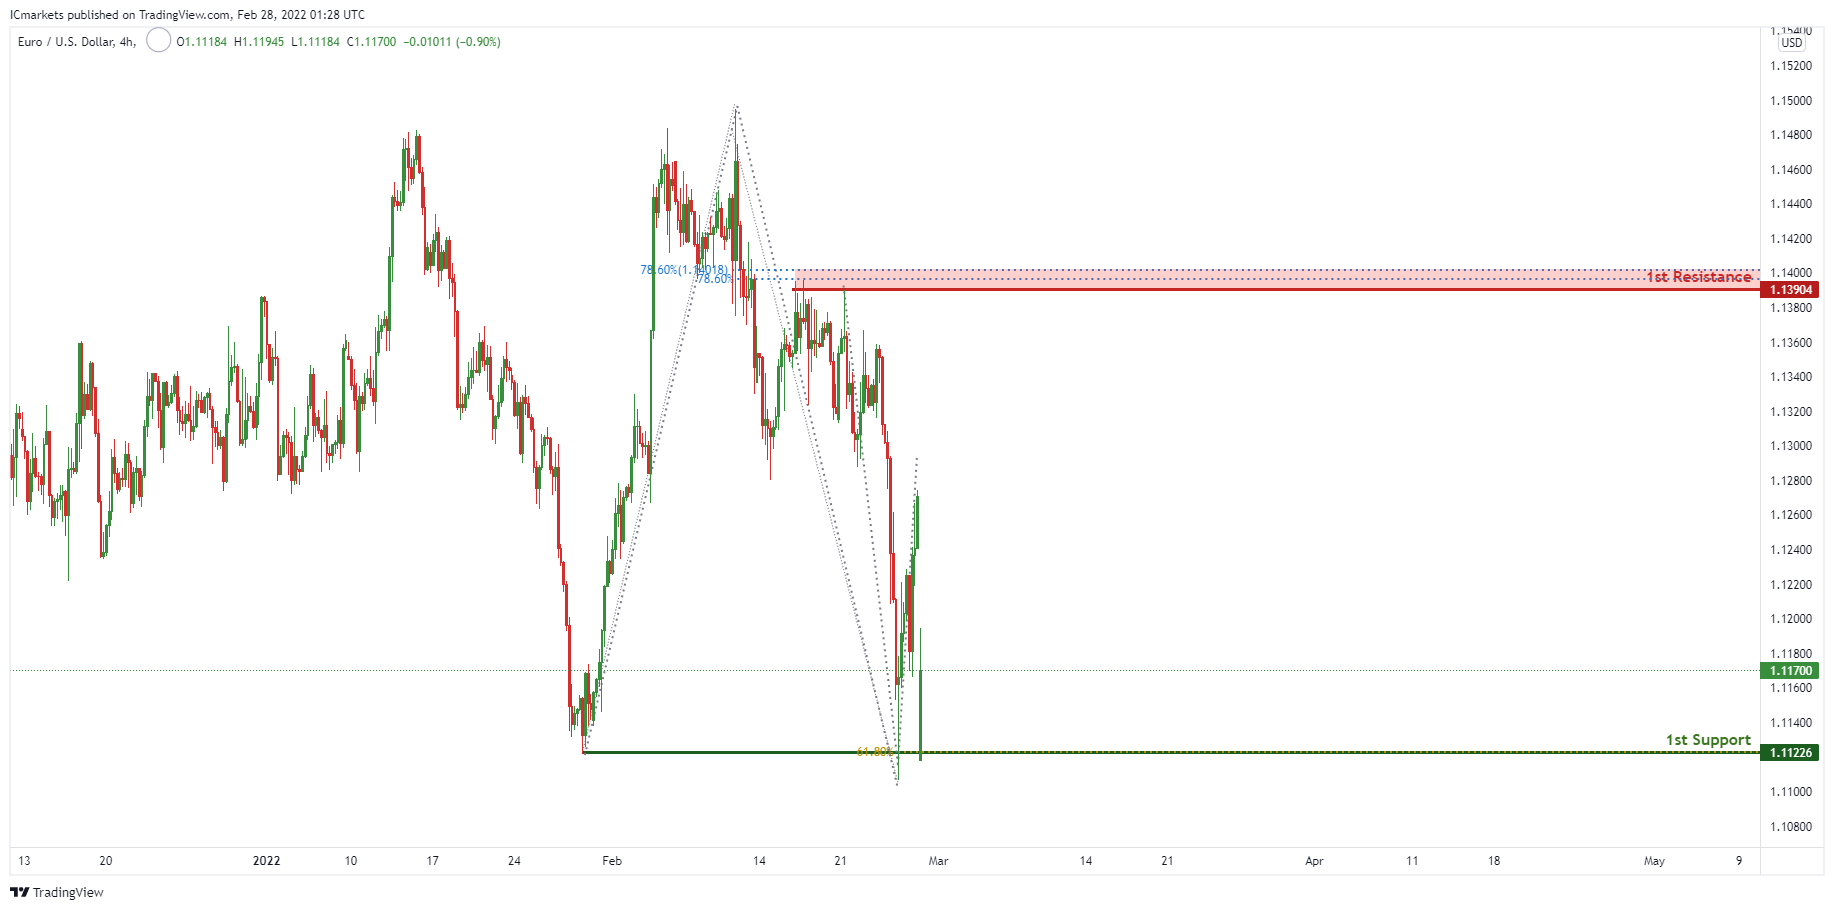
EUR/USD :
On the H4 chart price is near 1st support level of 1.11226 in line with 61.8% Fibonacci projection. Price can potentially go to the 1st resistance level of 1.13904 in line with 78.6% Fibonacci retracement and 78.6% Fibonacci projection. Our bullish bias is supported by the stochastic indicator as it is near support level.
Areas of consideration :
- H4 1st support at 1.11226
- H4 1st resistance at 1.13904
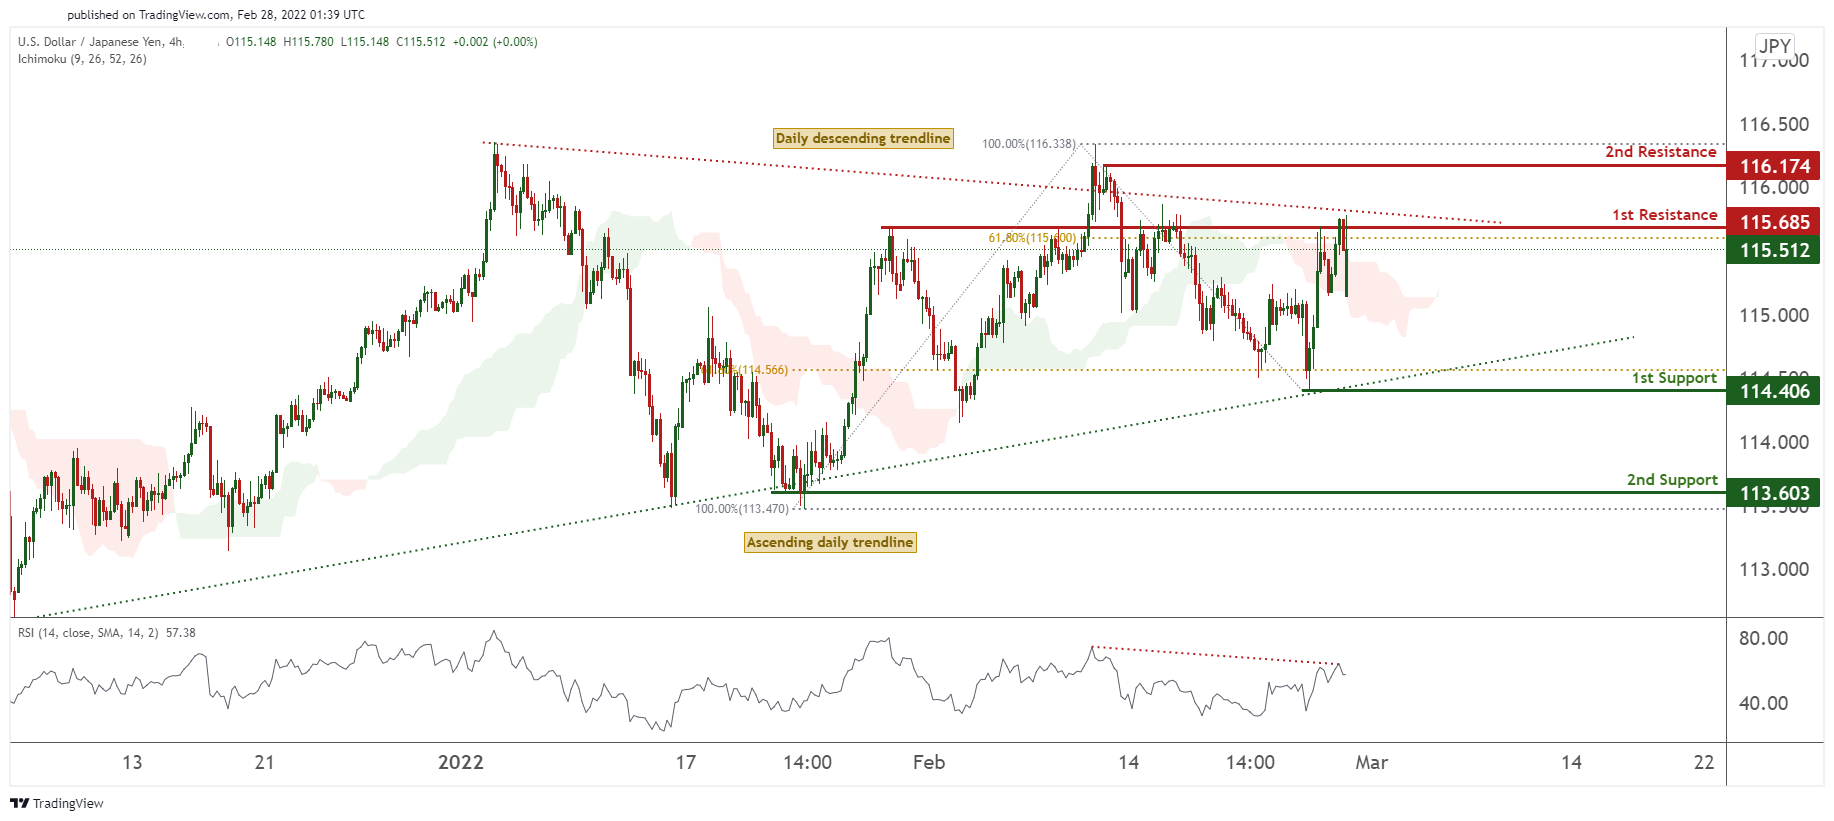
USD/JPY:
On the H4 timeframe, prices are consolidating in a daily triangle. We see the potential for further bearish continuation from our 1st resistance at 115.685 in line with 61.8% Fibonacci retracement towards our 1st support at 114.406 in line with 61.8% Fibonacci retracement. Our bearish bias is further supported by ichimoku forecasting red clouds and RSI showing bearish momentum.
Areas of consideration:
- H4 time frame, 1st resistance at 115.685
- H4 time frame, 1st support at 114.406
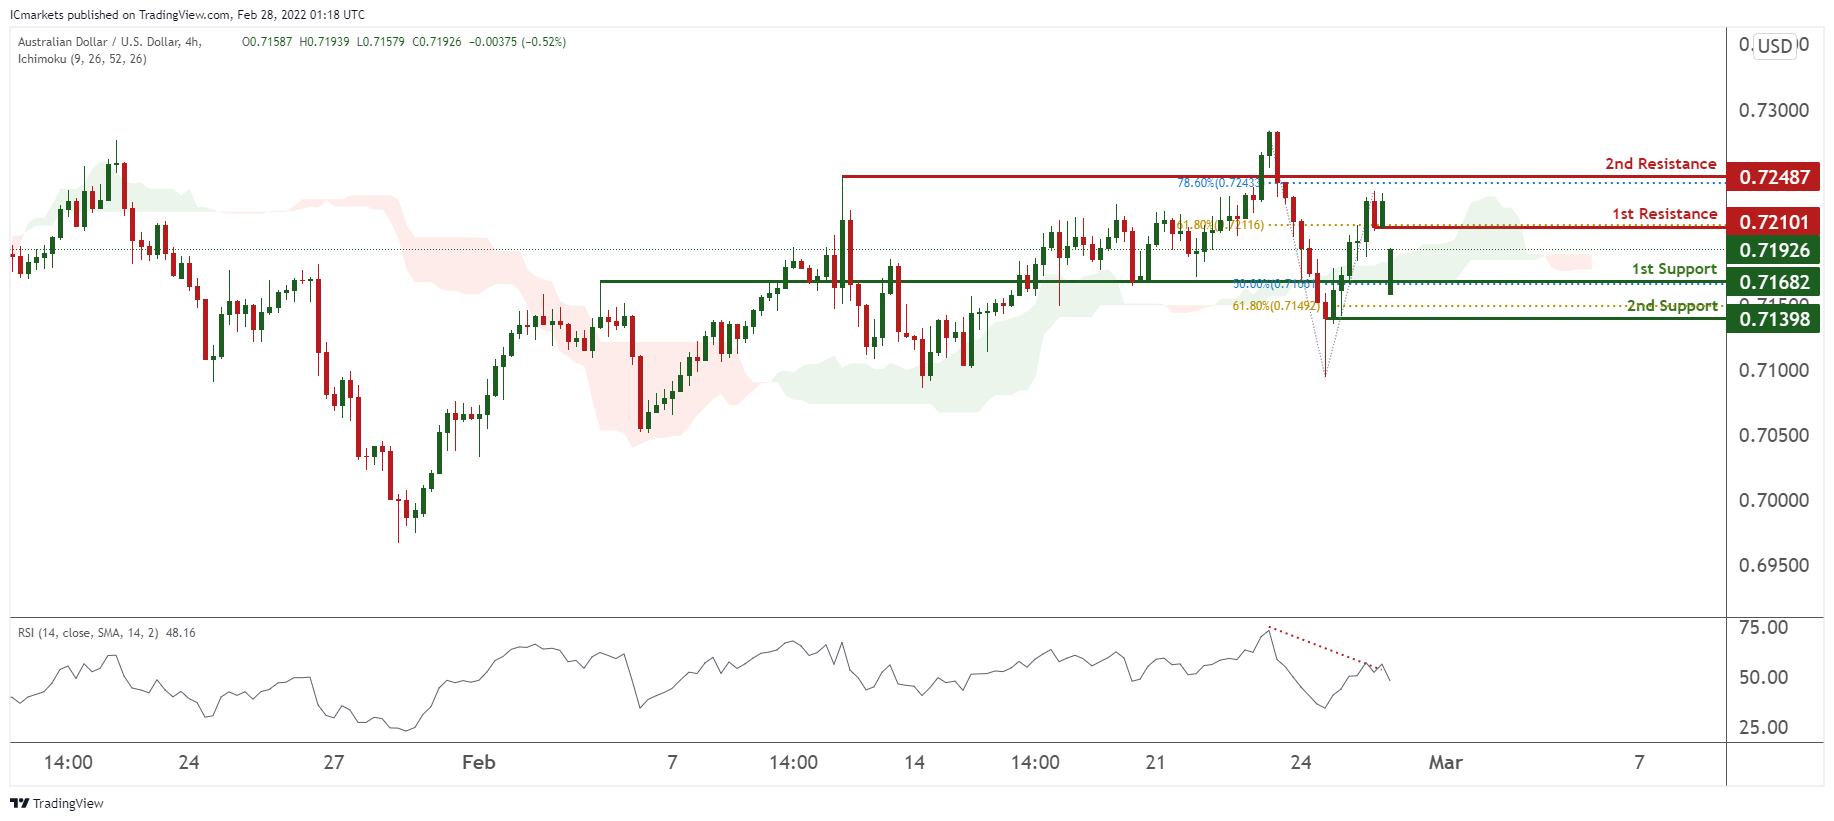
AUD/USD:
On the H4 chart, prices are consolidating horizontally. We see potential for a dip from our 1st resistance at 0.72101 in line with 61.8% Fibonacci retracement and towards our 1st support at 0.71682 in line with 50% Fibonacci retracement. Our bearish bias is further supported by prices trading below our ichimoku clouds and RSI portraying bearish momentum.
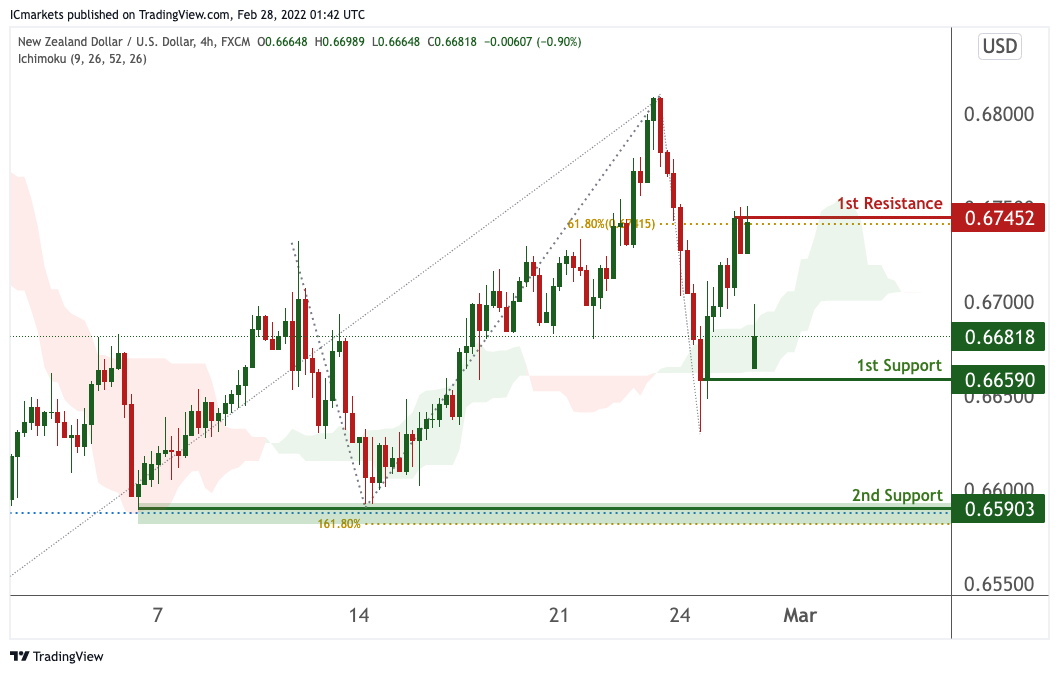
NZD/USD:
On the H4 chart, price is near 1st support level of 0.66590 in line with horizontal swing low support. Price can potentially rise to the 1st resistance level of 0.67452 in line with 61.8% Fibonacci retracement. Alternatively, price may break 1st support and head for 2nd support at 0.65903. Our bullsh bias is supported by how price is expected to bounce off the support of the ichimoku cloud.
Areas of consideration:
- H4 time frame, 1st resistance at 0.67452
- H4 time frame, 1st support at 0.66590
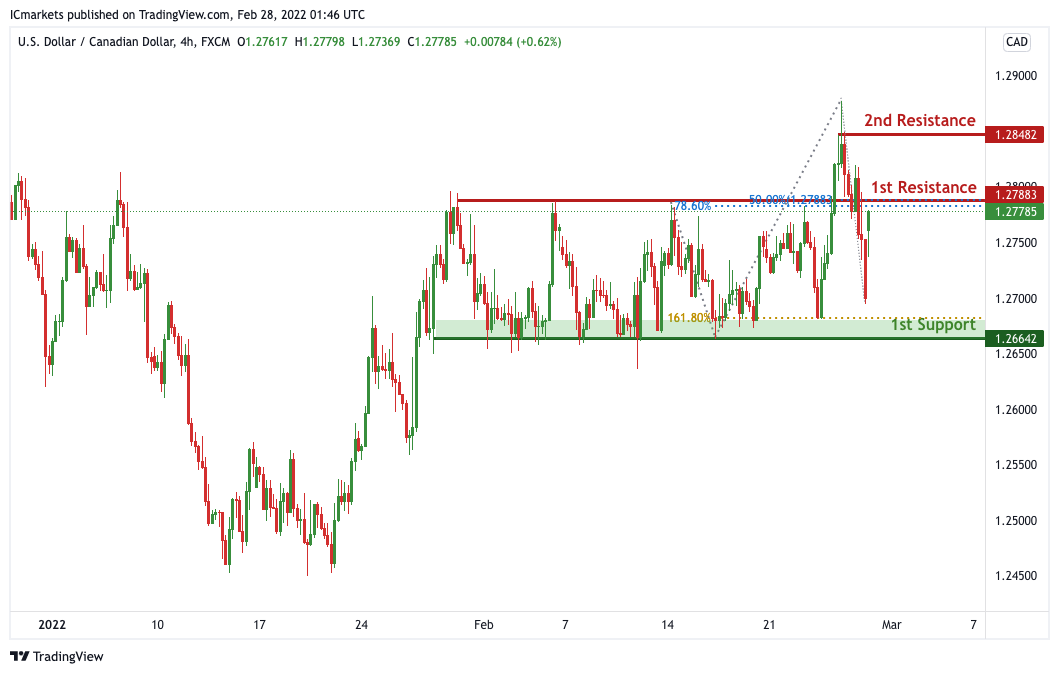
USD/CAD:
On the H4, price is ranging in between our 1st support and 1st resistance. We can expect price to drop to 1st support at 1.26642 in line with 161.8% Fibonacci extension from our 1st resistance at 1.27883 which is a strong resistance and in line with 50% and 78.6% Fibonacci retracement. Alternatively, price may break 1st resistance structure and head for 2nd resistance.
Areas of consideration:
- H4 time frame, 1st support at 1.26642
- H4 time frame, 1st resistance at 1.27883
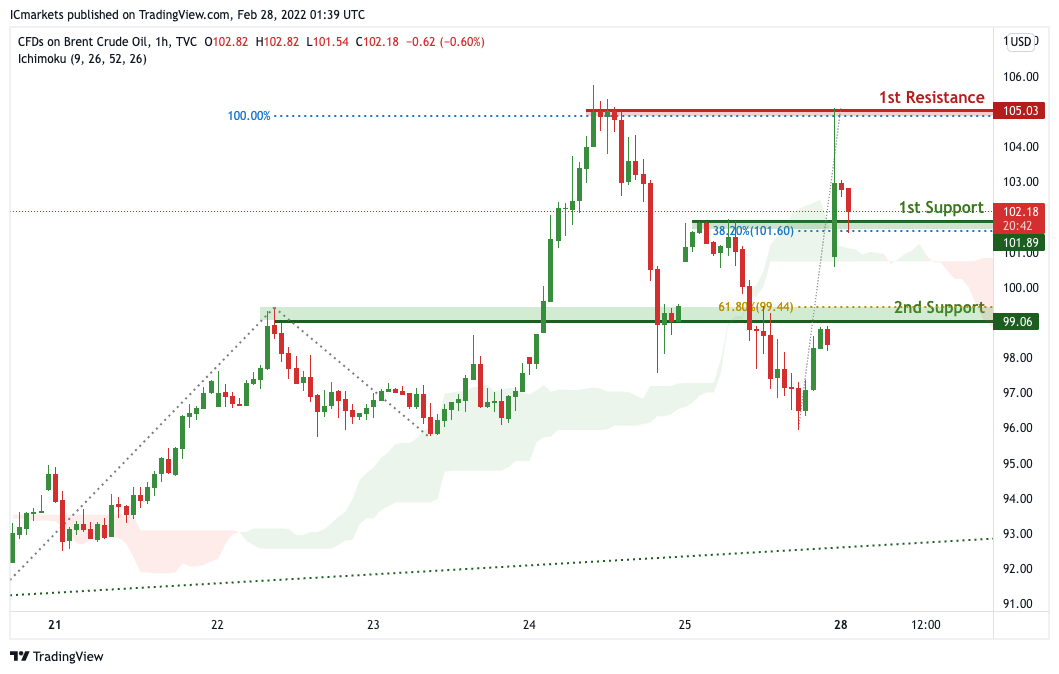
OIL:
On the H4, with price moving above the ichimoku cloud, we can expect bullish continuation from our 1st support at 101.89 in line with 38.2% Fibonacci retracement towards our 1st resistance at 105.03 which is a strong resistance and in line with 100% Fibonacci projection. Alternatively, price may break 1st support structure and head for 2nd support, which coincides with the horizontal overlap support at 99.06.
Areas of consideration:
- H4 time frame, 1st resistance of 105.03
- H4 time frame, 1st support of 101.89
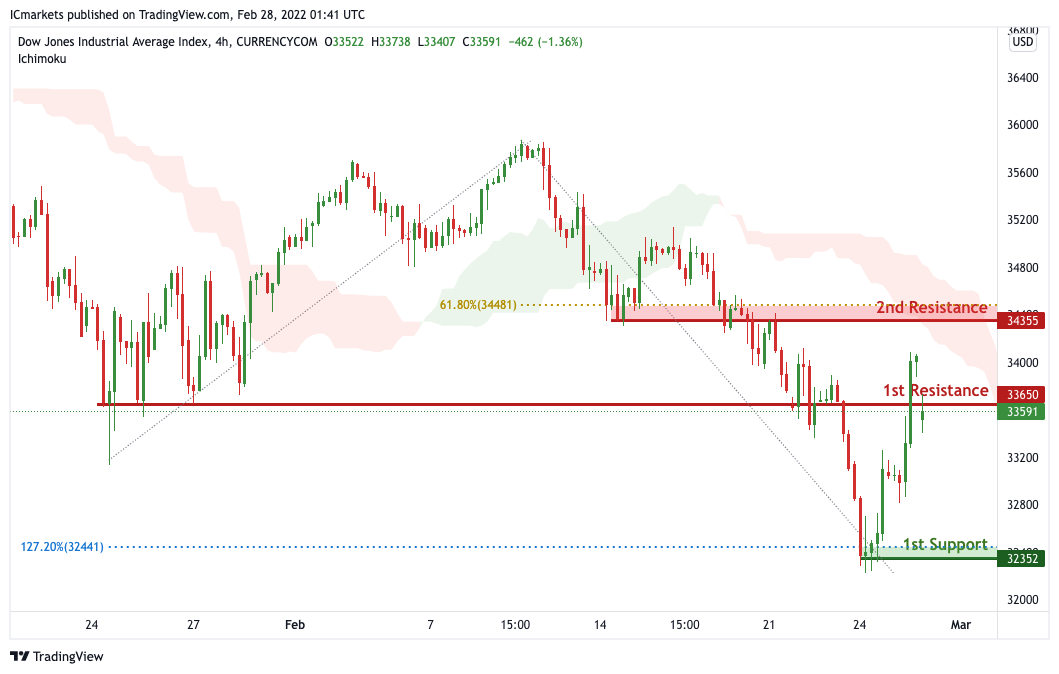
Dow Jones Industrial Average:
On the H4 timeframe, We see the possibility of bearish continuation from our 1st resistance at 33650 in line with horizontal overlap resistance towards our 1st support at 32352 in line with the horizontal swing low support. Alternatively, price may break 1st resistance and head for 2nd resistance at 34355 in line with the 61.8% Fibonacci retracement level. Our bearish bias is further supported by how price is moving below the ichimoku cloud
Areas of consideration :
- H4 1st support at 32352
- H4 1st resistance at 33650


