
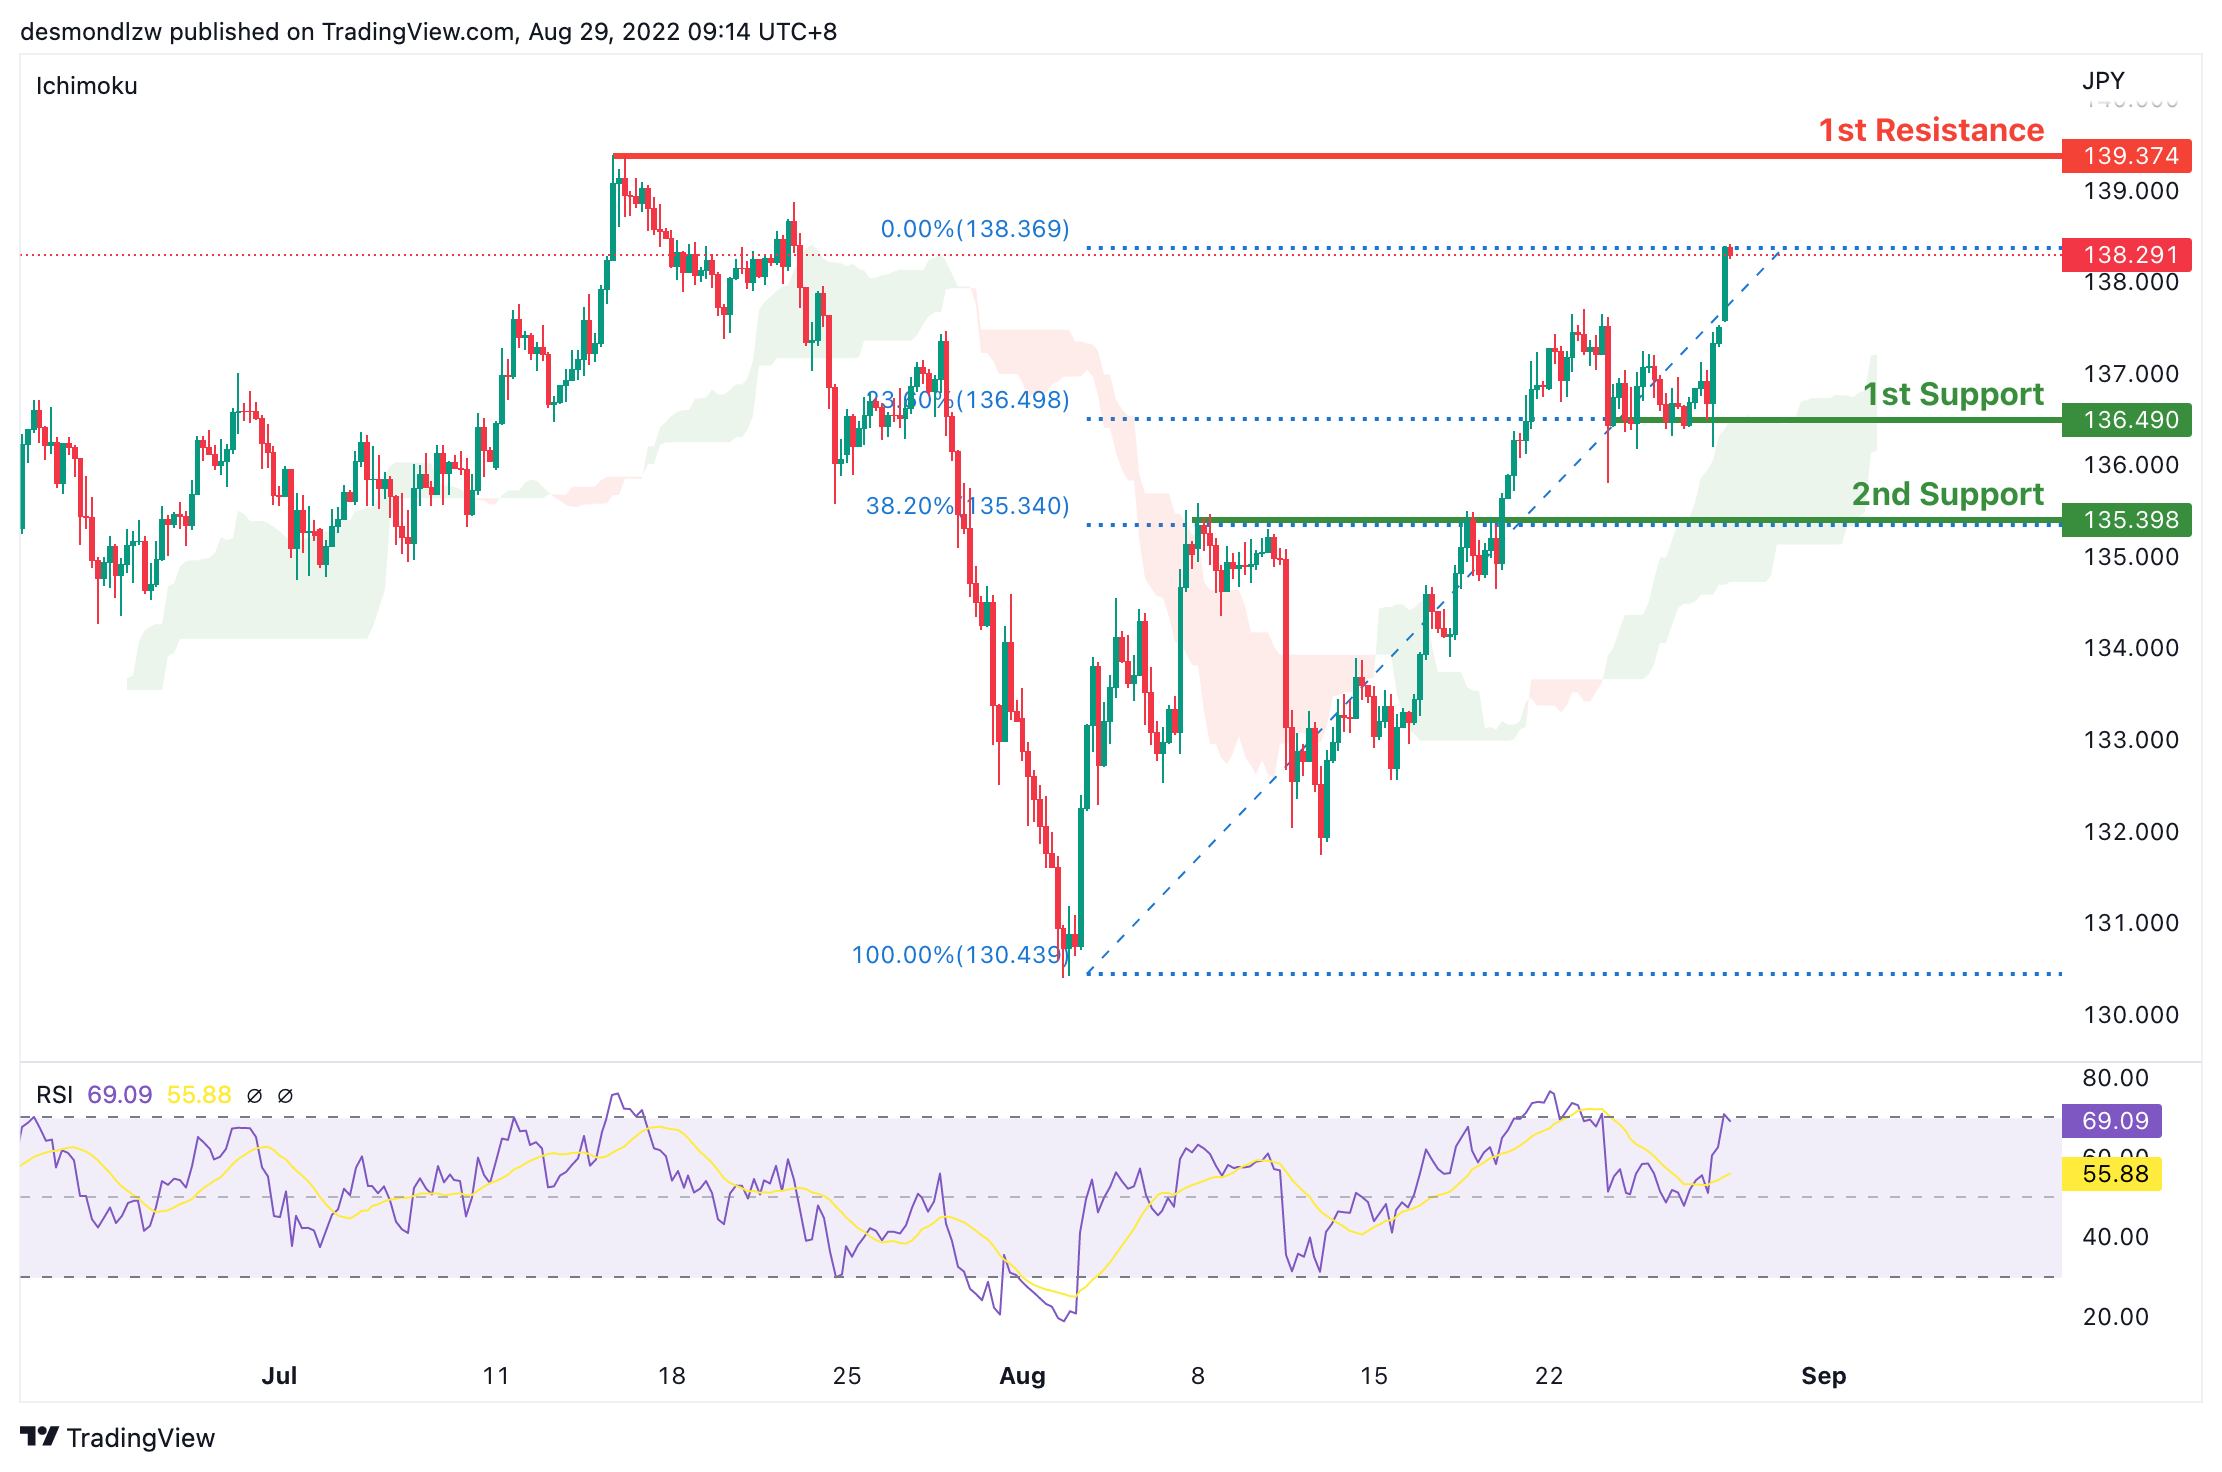
USD/JPY:
On the H4 chart, price has confirmed a bullish momentum breaking the previous high. We are bullish bias- Price is moving towards the first resistance at 139.374 where the previous swing high sits. Alternatively, if price reverse, it might pull back to test the first support at 136.490 where the 23.6% fibonacci retracement sits then subsequently the second support at 135.398 where the 38.2% retracement sits
Areas of consideration:
- H4 time frame, 1st resistance at 139.374
- H4 time frame, 1st support at 136.490
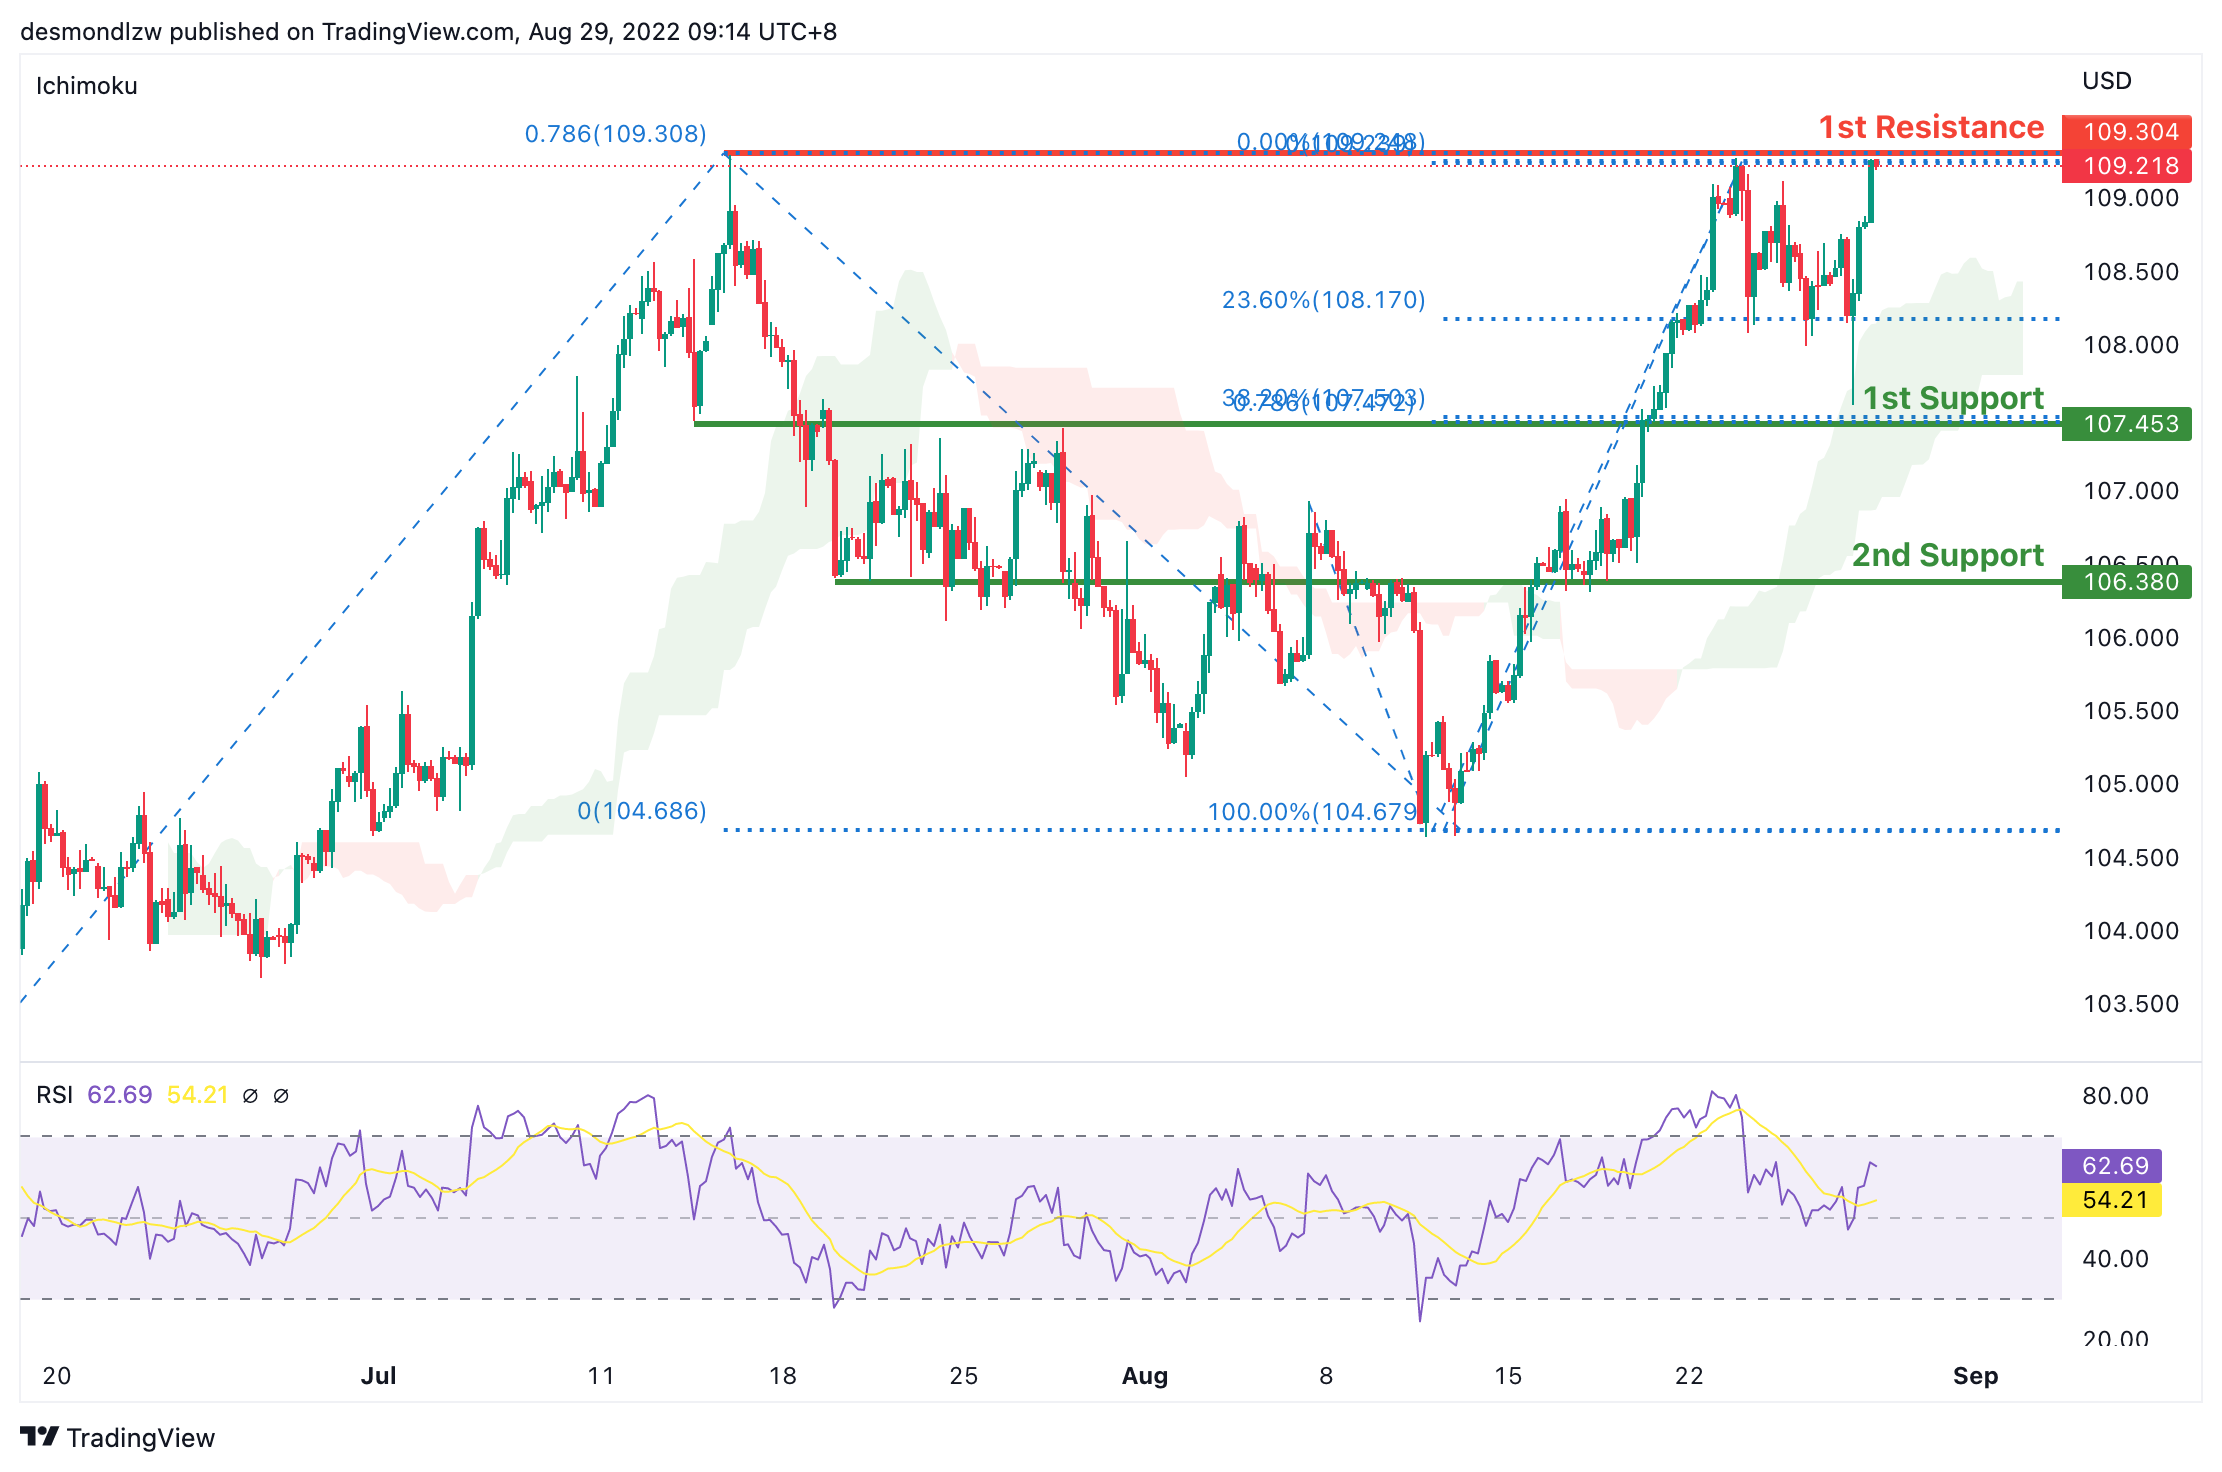
DXY:
On the H4, price is still moving in an ascending trend and is in a bullish momentum. Price is testing the first resistance at 109.304 where the 78.6% Fibonacci projection and the previous swing high sits. If price fails to break this level, it will pull back to test the first support at 107.453 where the 38.2% retracement and 78.6% projection sits and subsequently the second support at 106.380 where the 61.8% retracement sits
Areas of consideration:
- H4 time frame, 1st resistance at 109.304
- H4 time frame, 1st support at 107.453
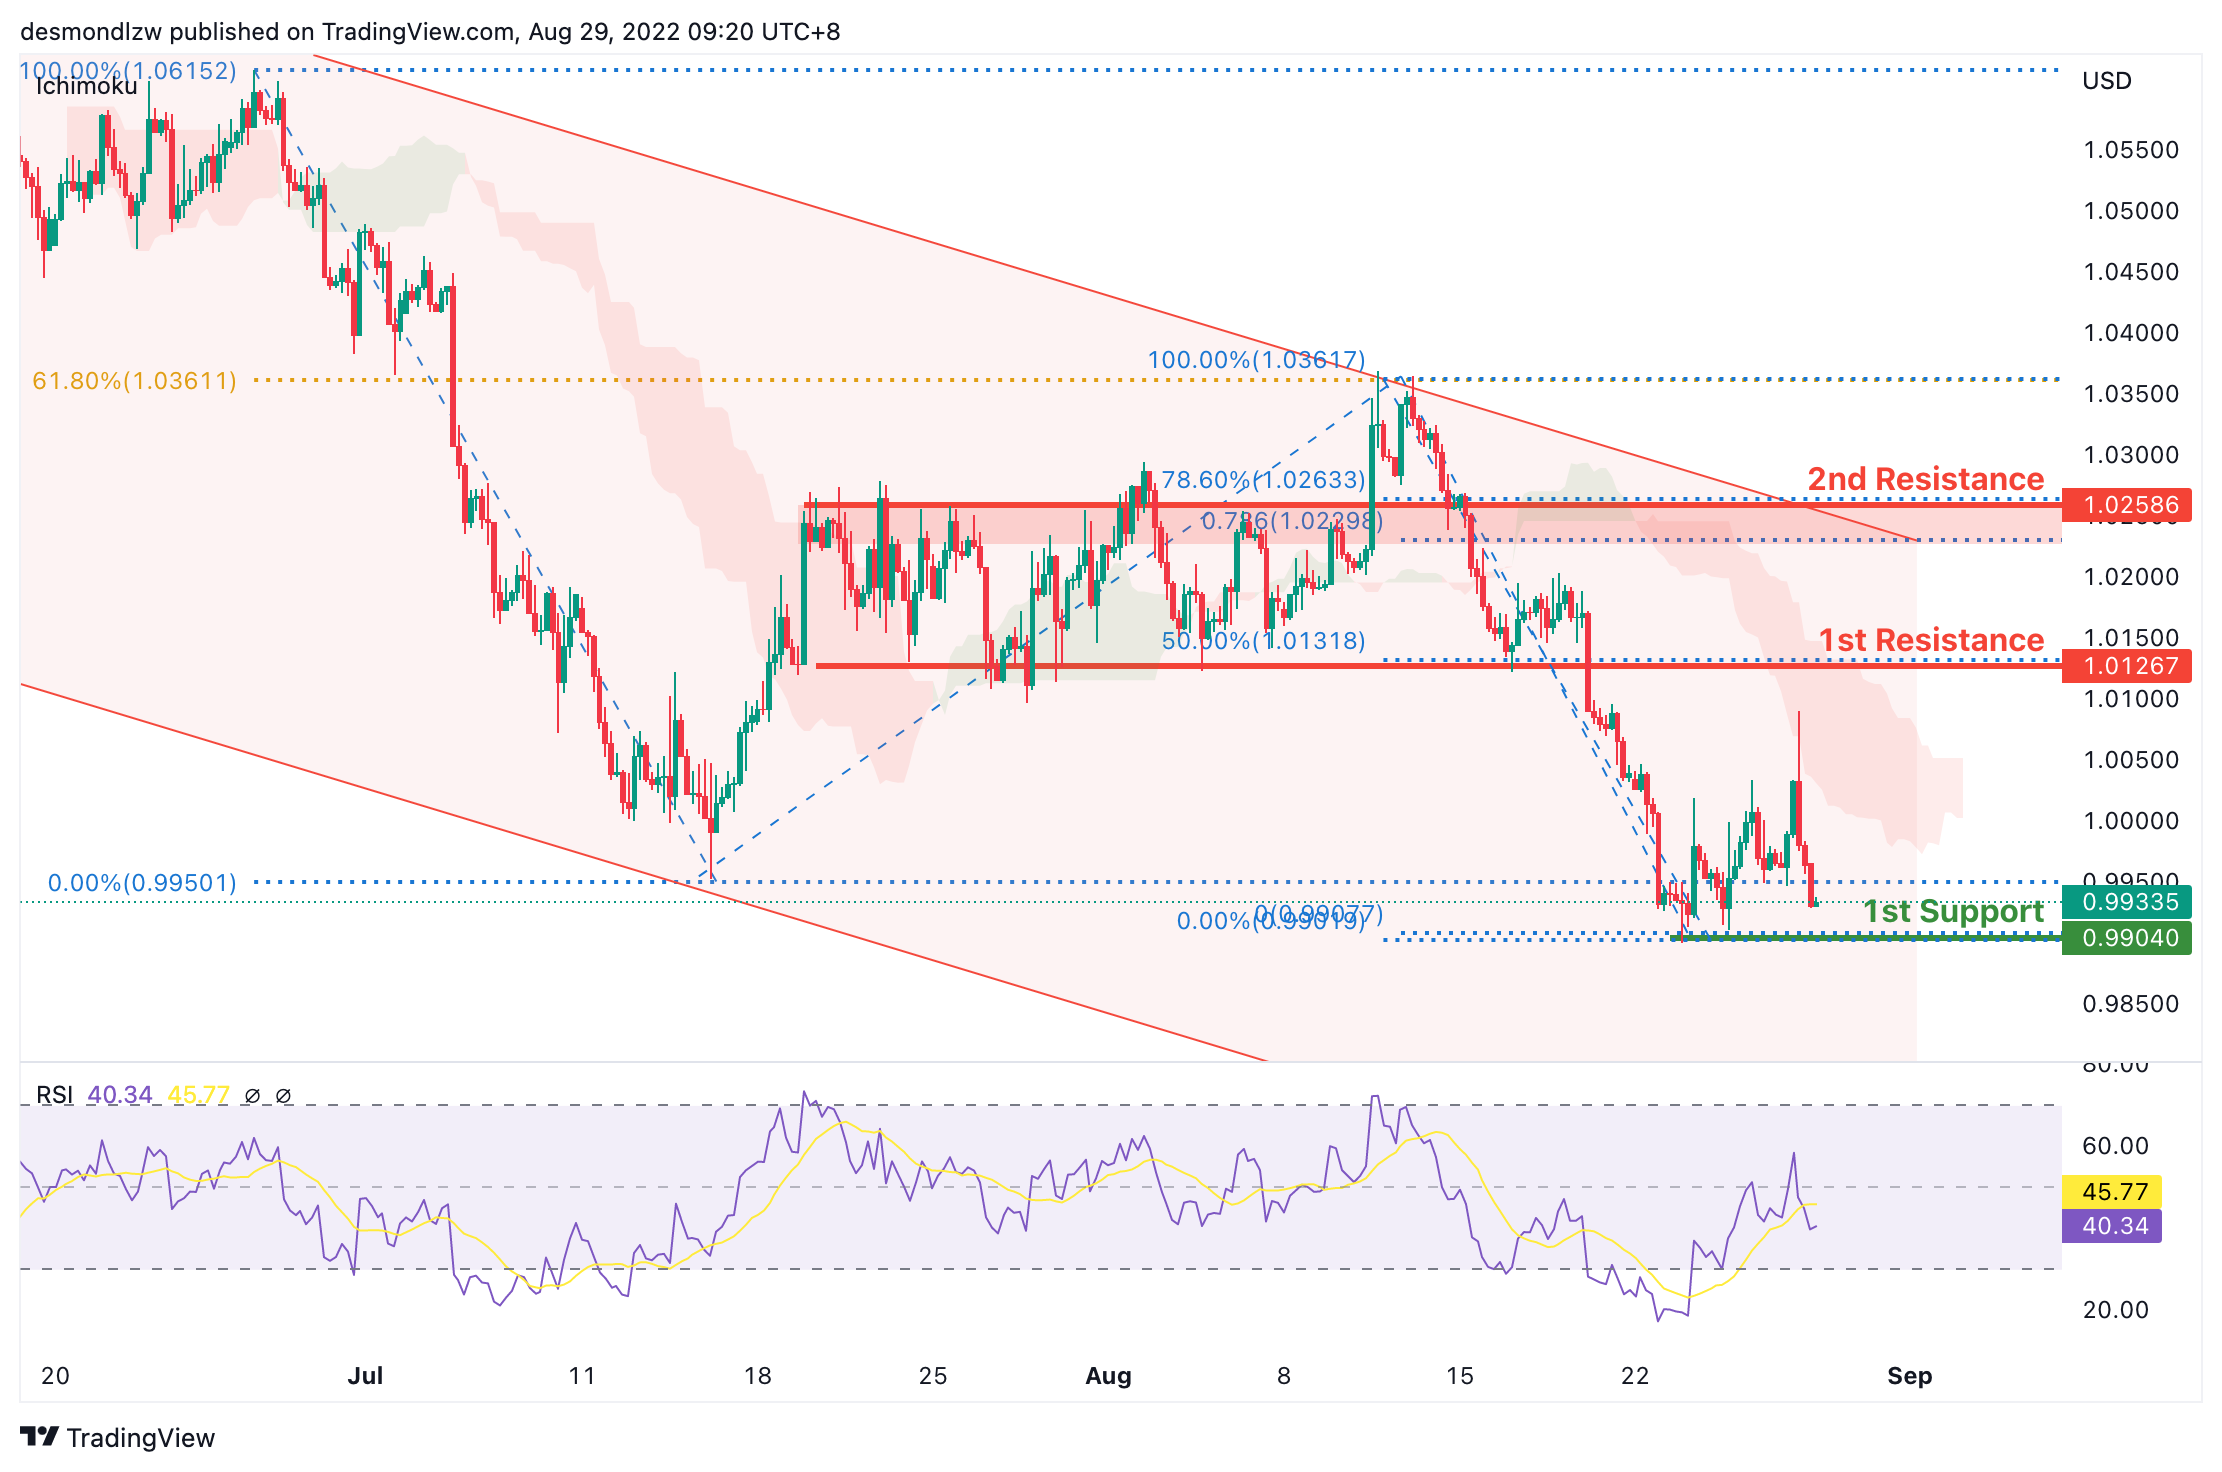
EUR/USD:
On the H4, prices are still in a descending trend and are below the ichimoku indicator, we are bearish bias. Price is looking to test the first support again at 0.9904 where the 61.8% projection sit. If it fails to break the first support, prices could pull back to test the first resistance at 1.0126 where the previous swing low and 50% retracement sits and subsequently the second resistance at 1.0258 where the 78.6% retracement and swing high sits
Areas of consideration :
- H4 1st resistance at 1.0126
- H4 1st support at 0.9904
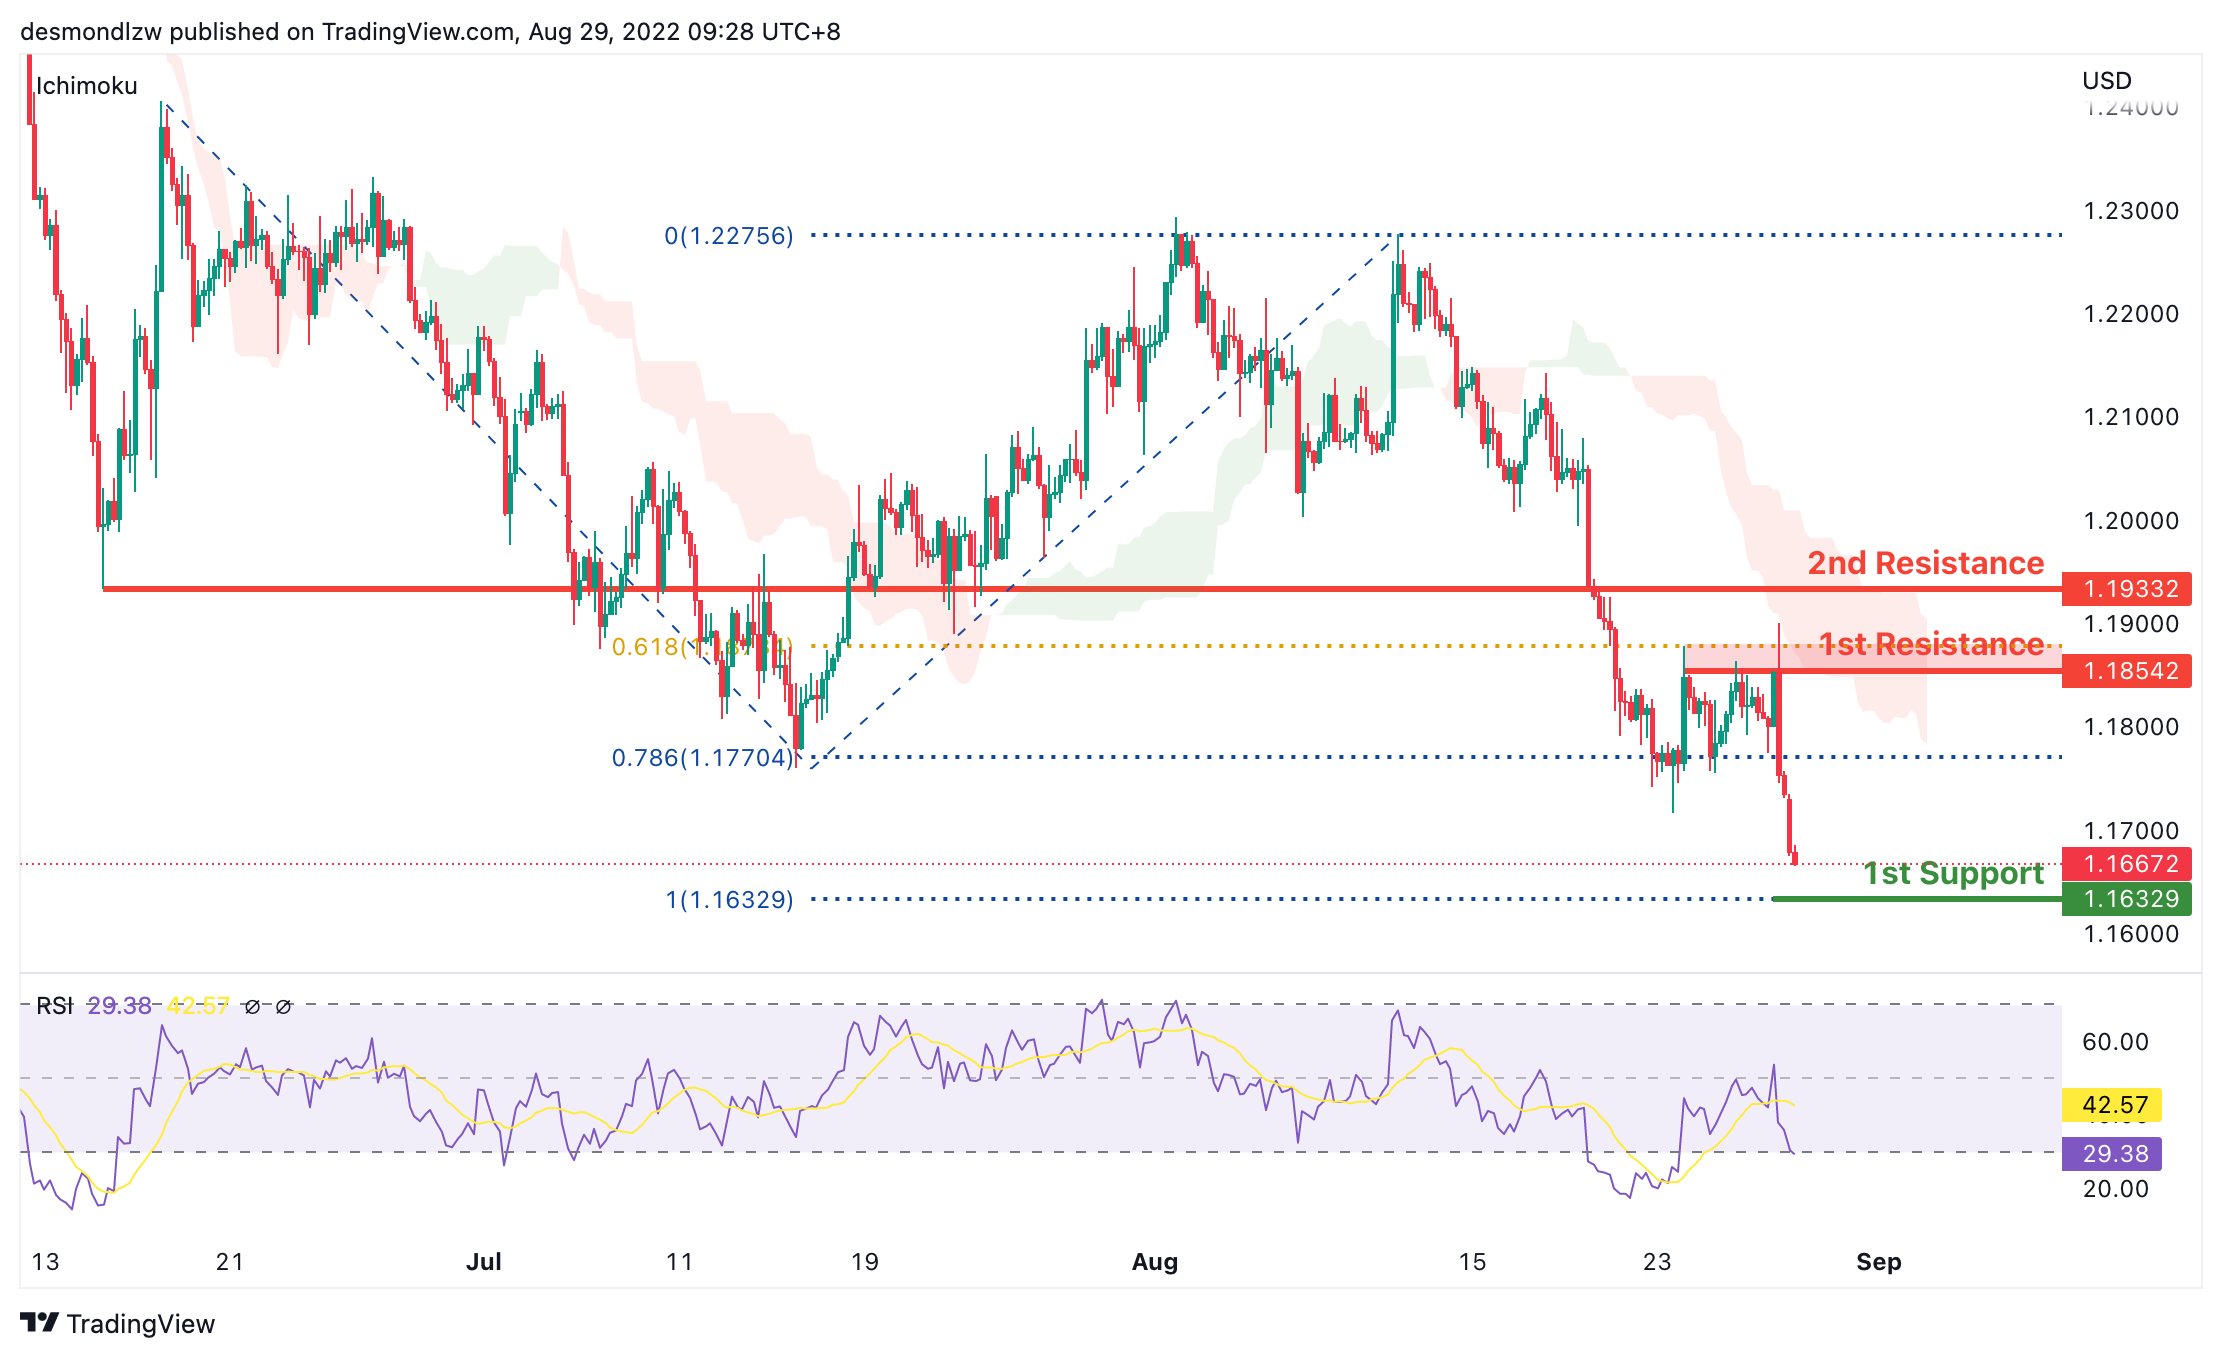
GBP/USD:
On the H4, prices seem to be in a bearish momentum and respecting the ichimoku cloud. Prices have broken the 78.6% projection level and are moving towards the first support, 100% projection at 1.1632 levels. If price fails to break this level, it might pull back to test the first resistance at 1.1854 where the 38.2% retracement sits.
Areas of consideration:
- H4 1st resistance at 1.1920
- H4 1st support at 1.1722
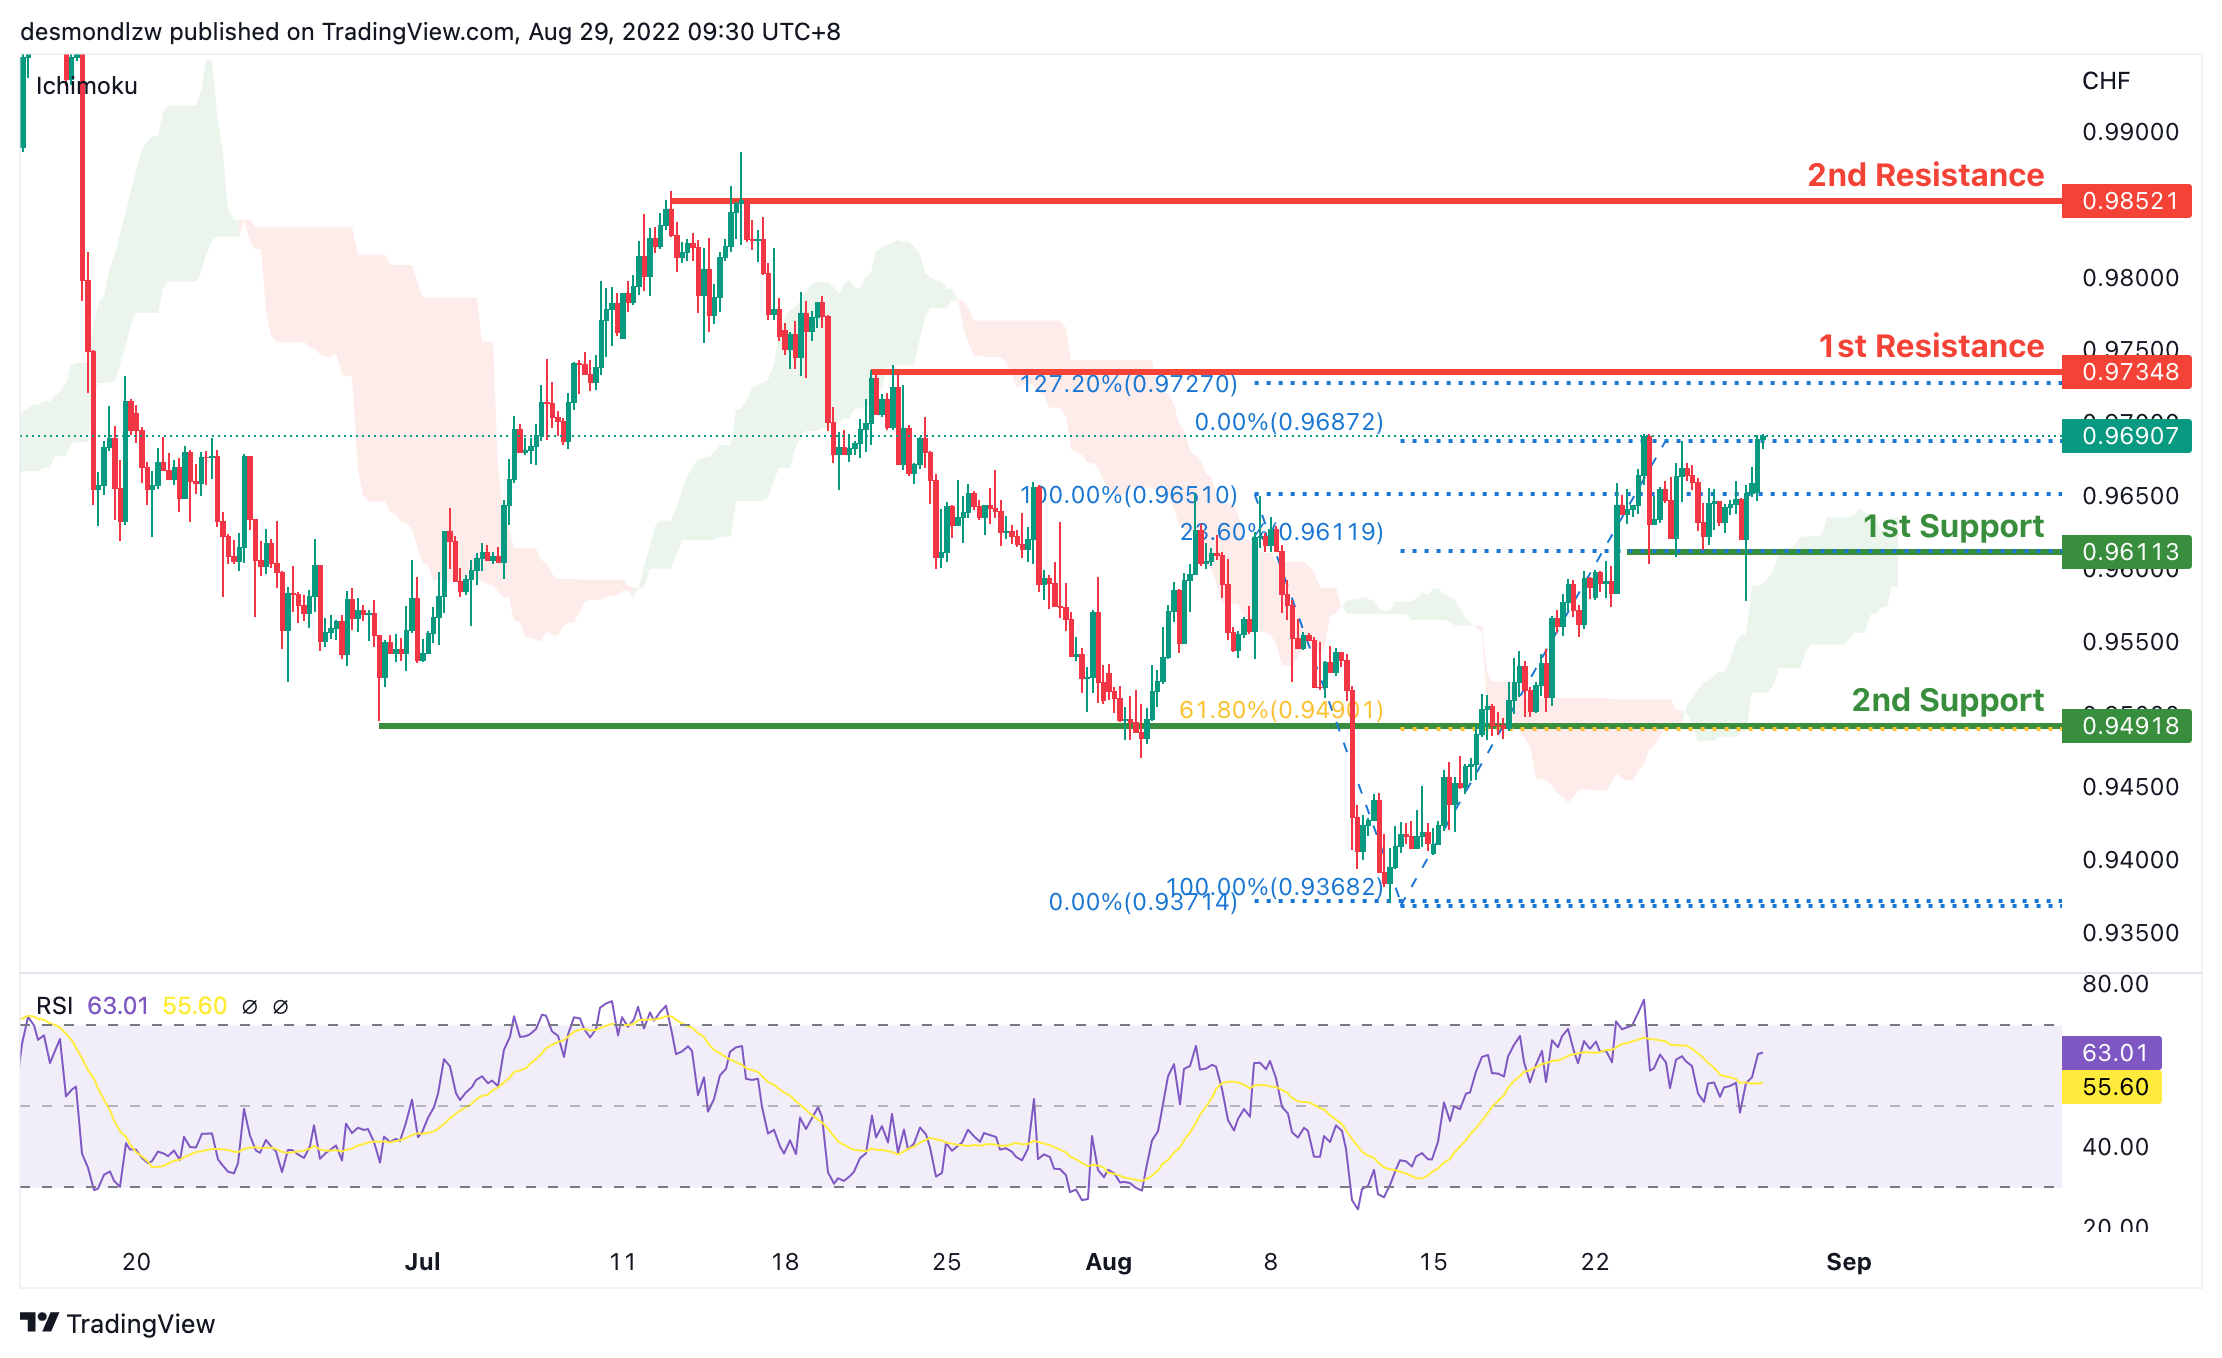
USD/CHF:
On the H4, with prices moving above the ichimoku cloud and breaking the descending trend, we are bullish bias. We’re looking at price to test the first resistance at 0.9734 where the 127.2% extension sits. If price continues with bullish momentum, it will bring price to second resistance at 0.9852. Alternatively, prices could test the intermediate support at 0.95500 where the swing low sits and then the first support at 0.9469 where the 78.6% fibonacci retracement sits
Areas of consideration
- H4 1st support at 0.9469
- H4 1st resistance at 0.9734
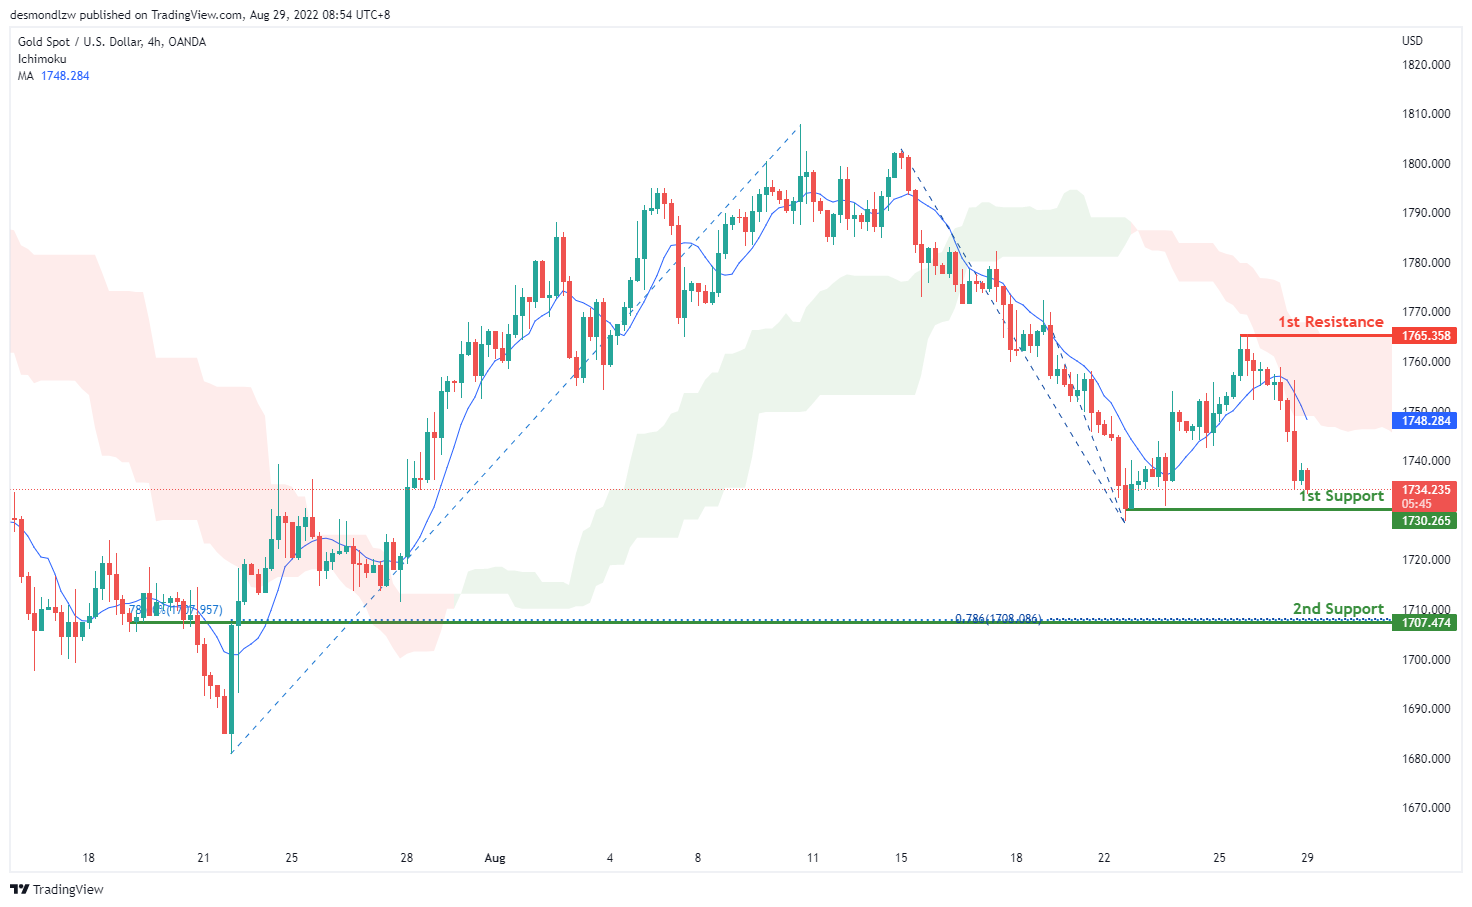
XAU/USD (GOLD):
On the H4, with prices moving below ichimoku cloud and MA, we have a bearish bias that the price may drop from the 1st support at 1730.265, which is in line with the swing low to the 2nd support at 1707.474, which is in line with the 78.6% fibonacci retracement and 78.6% fibonacci projection. Alternatively, price may rise to the 1st resistance at 1765.358, where the swing high is.
Areas of consideration:
- H4 time frame, 1st support at 1730.265
- H4 time frame, 2nd support at 1707.474
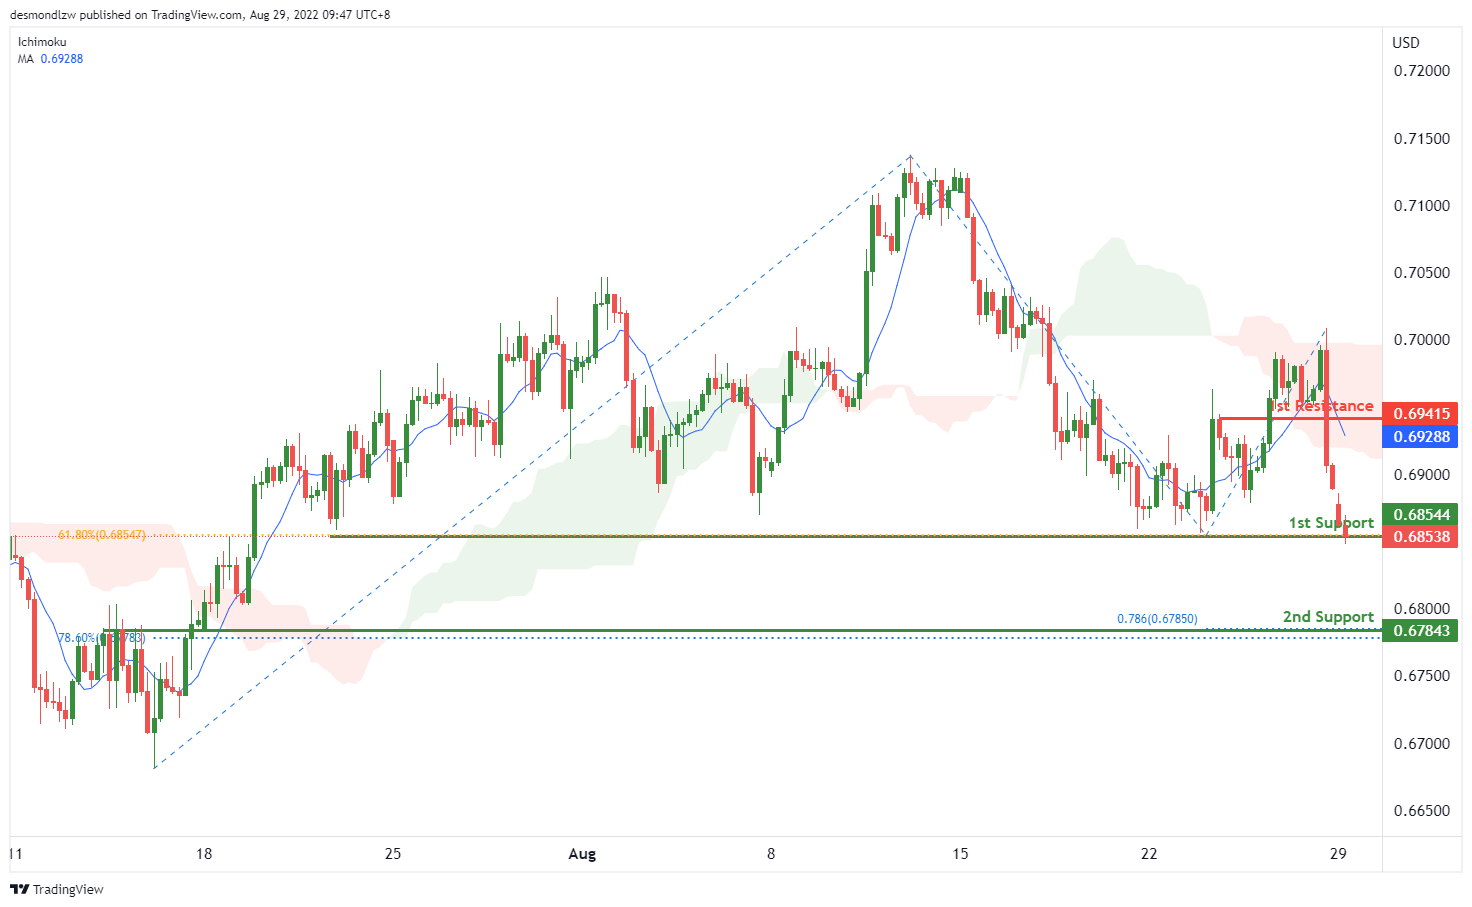
AUD/USD:
On the H4, with the price moving below the ichimoku cloud and MA, we have a bearish bias. As the price almost break the 1st support at 0.65844, we can expect the price to drop to the 2nd support at 0.67843, where the 78.6% fibonacci projection and 78.6% fibonacci retracement are. Alternatively, the price may rise to the 1st resistance at 0.69415, where the previous swing high is
Areas of consideration
- H4 1st support at 0.65844
- H4 2nd support at 0.67843
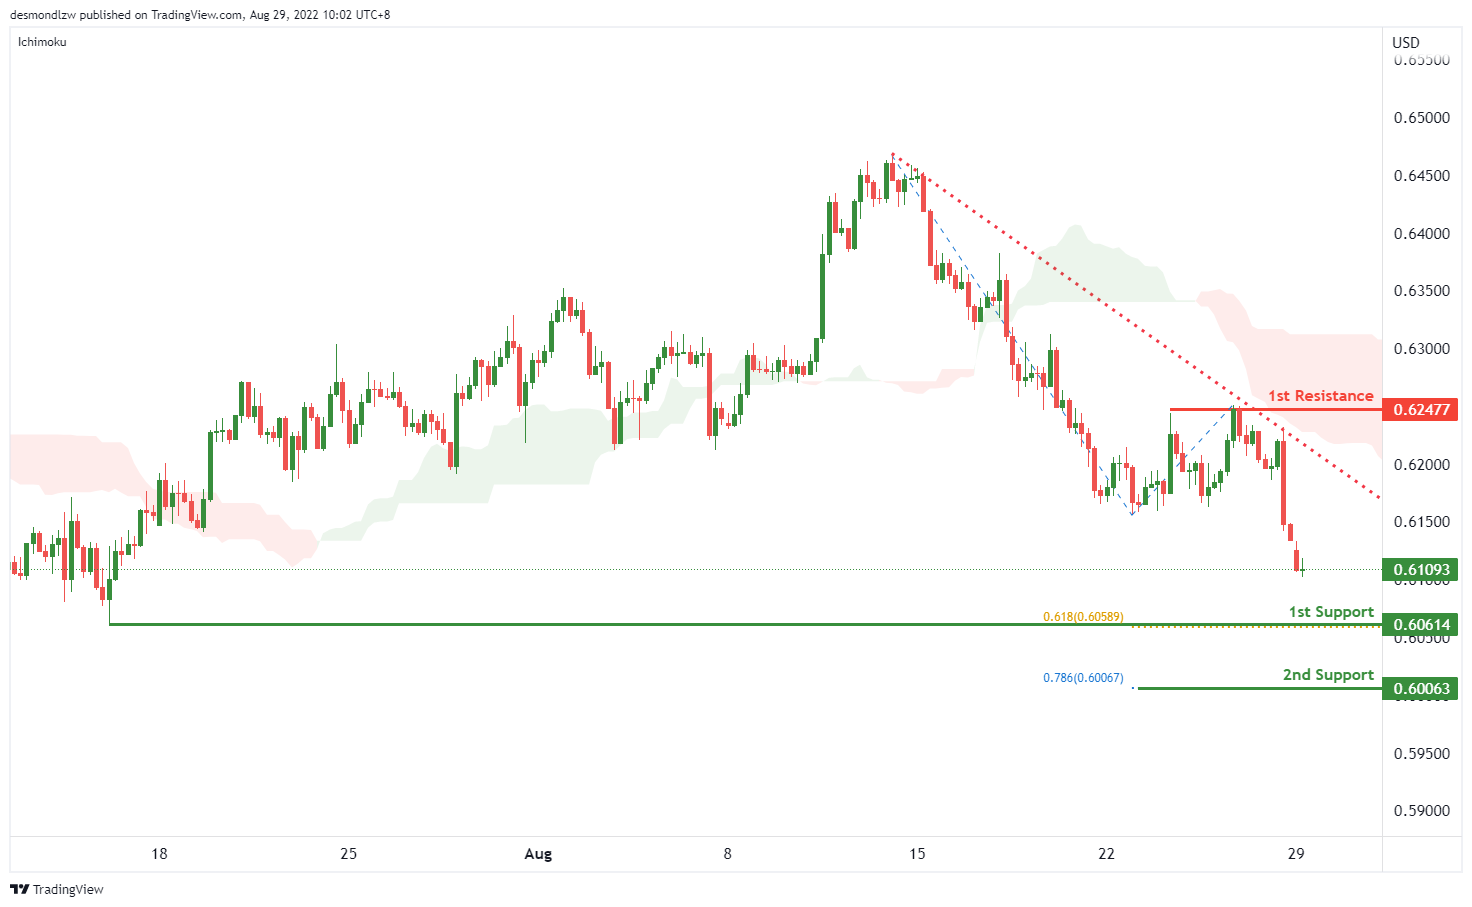
NZD/USD:
On the H4, with price moving within the descending trendline and below the ichimoku indicator, we have a bearish bias that price will drop to 1st support at 0.60617, where the swing low and 61.8% fibonacci projection are. If the price breaks the 1st support, we can expect the price drop to the 2nd support at 0.60063, where the 78.6% fibonacci projection is. Alternatively, price could rise to 1st resistance at 0.62477, which is in line with the swing highs.
Areas of consideration:
- H4 time frame, 1st support at 0.60617
- H4 time frame, 2nd support at 0.60063
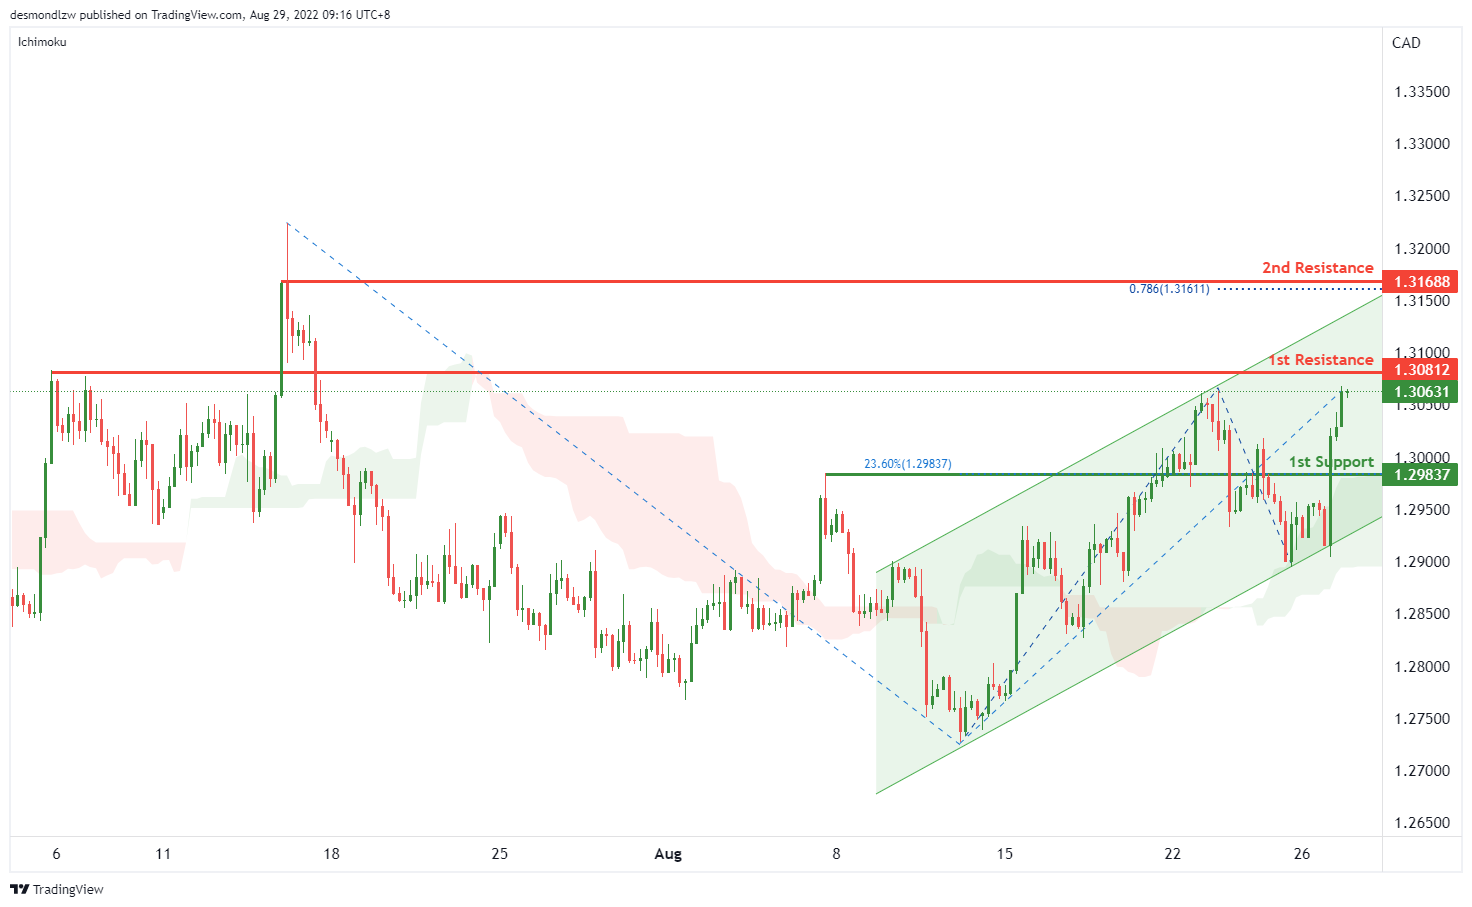
USD/CAD:
On the H4, with the price within the ascending channel, above ichimoku cloud and MACD indicators are above zero, we have a bullish bias that the price may rise from the 1st resistance at 1.30812, where the swing high is to the 2nd resistance at 1.31688, where the swing high and 78.6% fibonacci projection are. Alternatively, price could drop to the 1st support at 1.30622, where the 23.6% fibonacci retracement is.
Areas of consideration:
- H4 time frame, 1st resistance at 1.30812
- H4 time frame, 2nd resistance at 1.31688
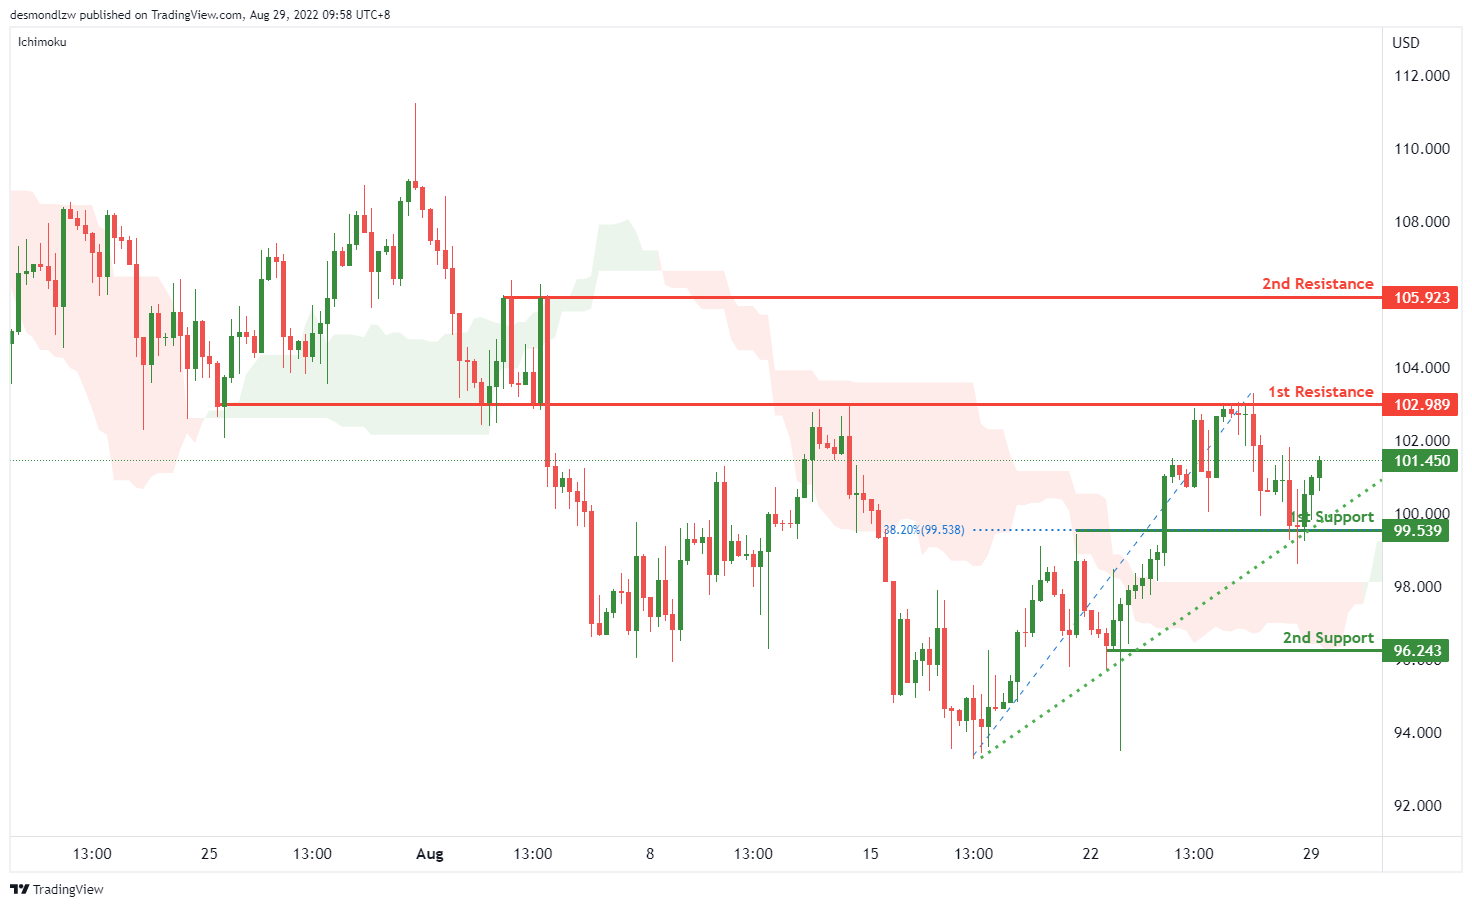
OIL:
On the H4, with price moving within the ascending trendline and above ichimoku cloud, we have a bullish bias that the price may rise from the, which is in line with the 23.6% fibonacci retracement to the 1st resistance at 102.989, where the overlap resistance is. If the price break the 1st resistance, we can expect the price to rise to the 2nd resistance at 105.923, where the previous swing highs are. Alternatively, the price may drop to the 2nd support at 96.243, which is in line with the swing low support.
Areas of consideration:
- H4 time frame, 1st support at 99.539
- H4 time frame, 1st resistance at 102.989
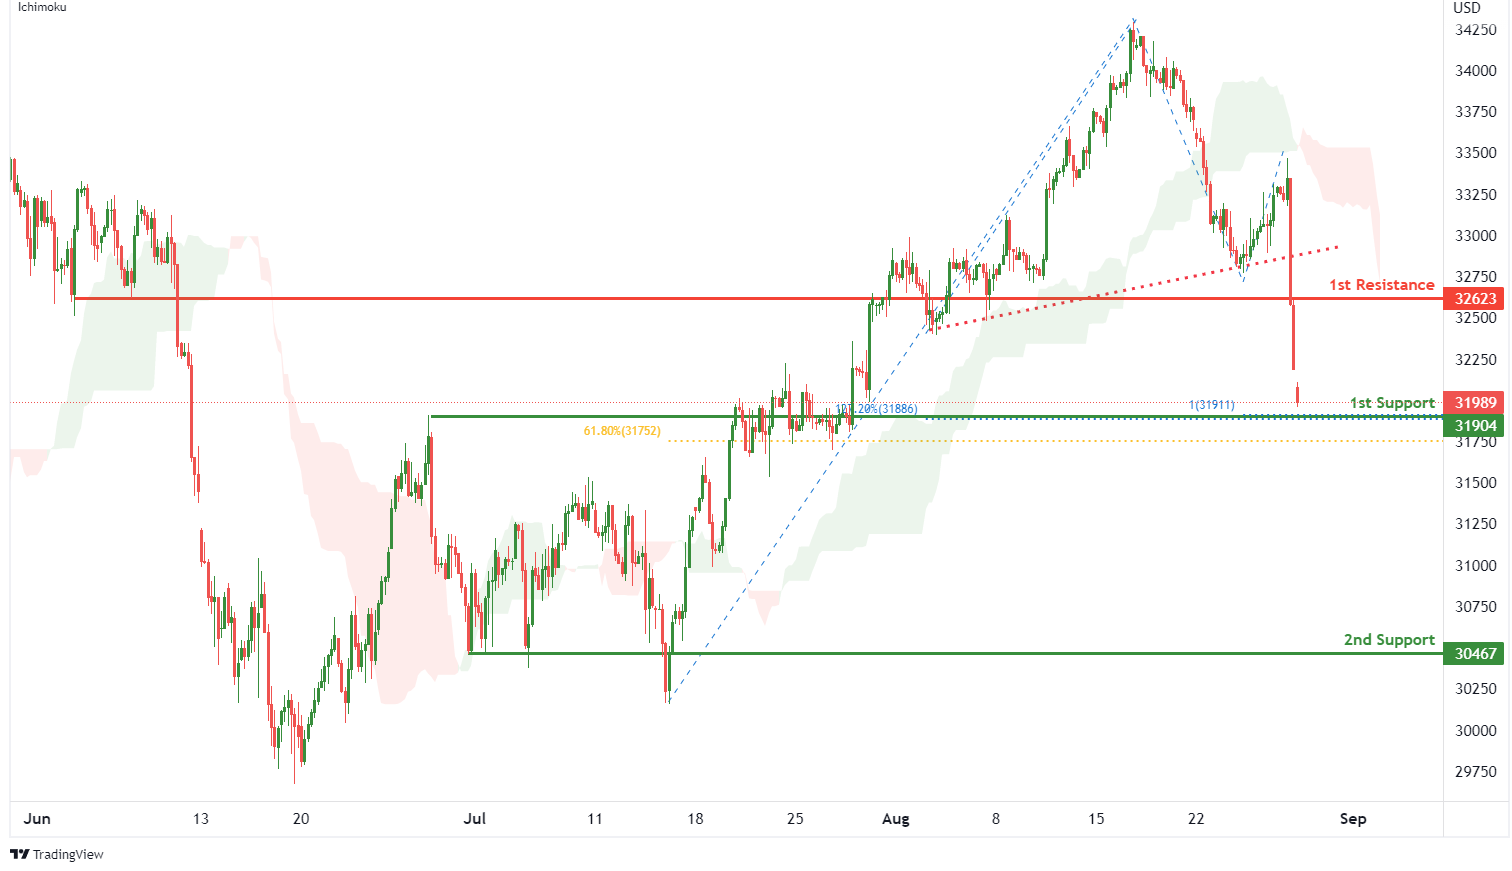
Dow Jones Industrial Average:
On the H4, with price breaking the ascending trendline and moving below the ichimoku indicator, ,we have a bearish bias that price will drop to 1st support at 31904 where the pullback support, 100% fibonacci projection, 61.8% fibonacci retracement and 127.2% fibonacci extension are. Should price break 1st support, we would expect bearish momentum to carry price to 2nd support at 30467 where the pullback support is. Alternatively, price could rise to 1st resistance at 32623 in line with pullback resistance.
Areas of consideration:
- H4 time frame, 1st resistance of 32623
- H4 time frame, 1st support at 31904
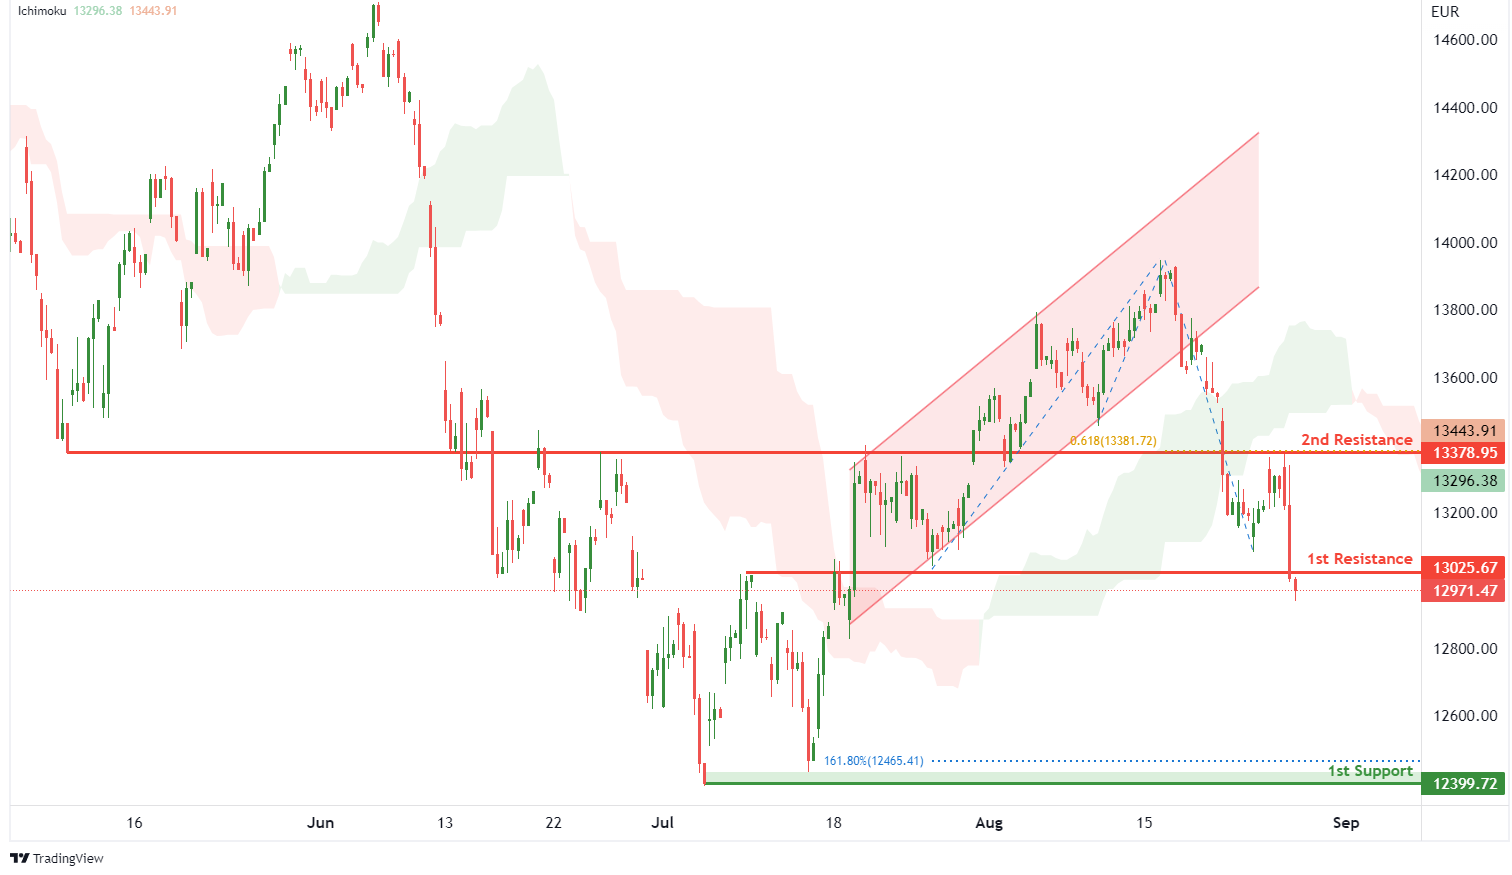
DAX:
On the H4, with price breaking out of an ascending channel and moving below the ichimoku indicator, we have a bearish bias that price will drop from 1st resistance at 13025.67 where the pullback resistance is to the 1st support at 12399.72 where the swing low support and 161.8% fibonacci extension are. Alternatively, price could break 1st resistance and rise to 2nd resistance at 13378.95 where the overlap resistance and 61.8% fibonacci projection are.
Areas of consideration:
- H4 time frame, 1st resistance of 13025.67
- H4 time frame, 1st support at 12399.72
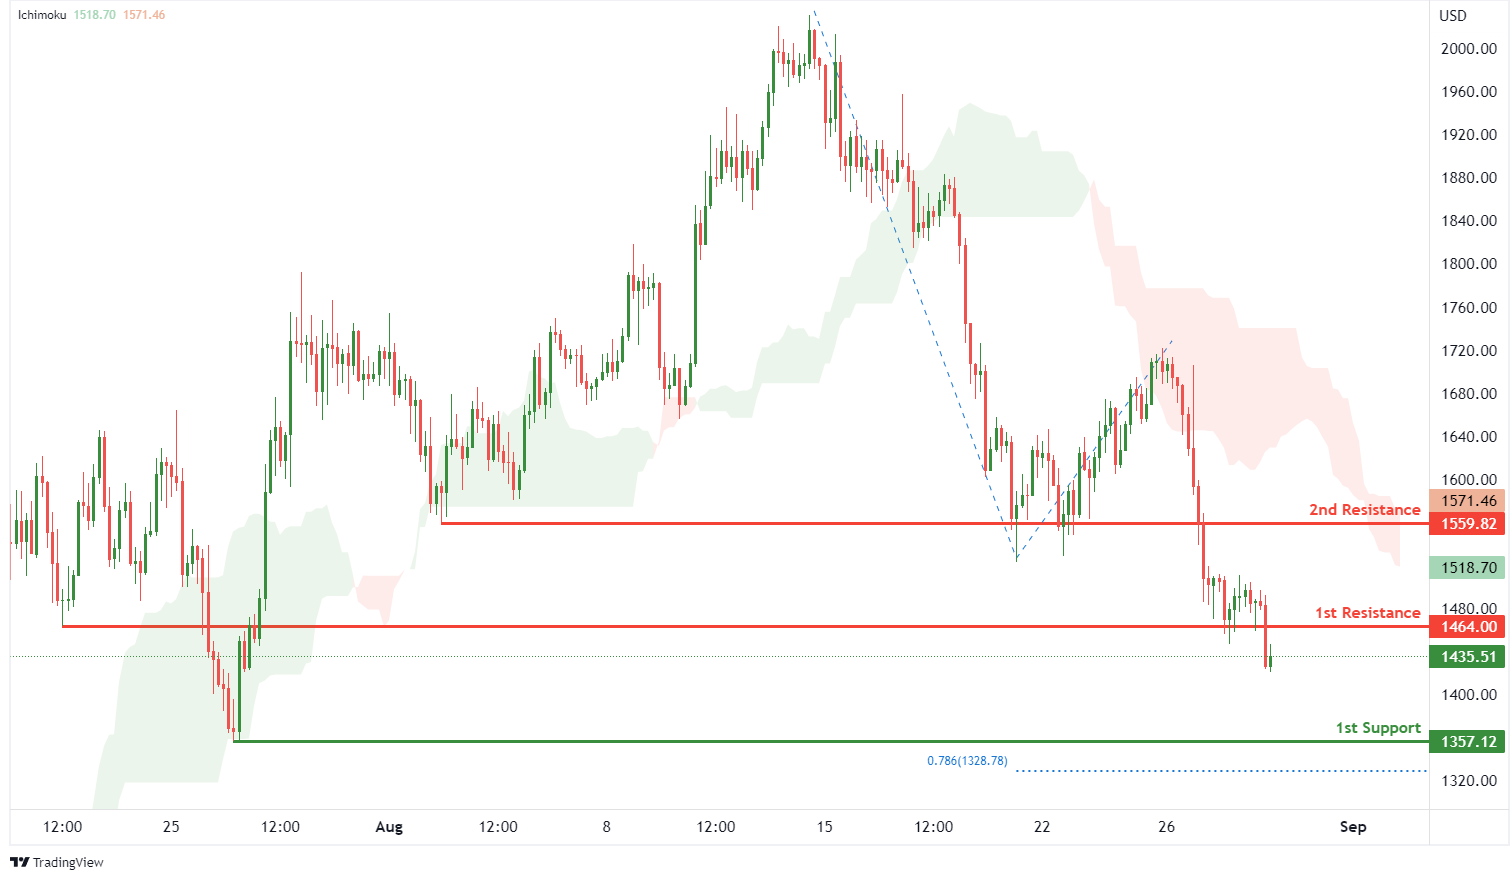
ETHUSD:
On the H4, with price moving below the ichimoku indicator, we have a bearish bias that price will drop from 1st resistance at 1464.00 where the pullback resistance is to the 1st support at 1357.12 where the swing low support and 78.6% fibonacci projection are. Alternatively, price could break 1st resistance structure and rise to 2nd resistance at 1559.82 where the overlap resistance is.
Areas of consideration:
- H4 time frame, 1st resistance of 1464.00
- H4 time frame, 1st support at 1357.12
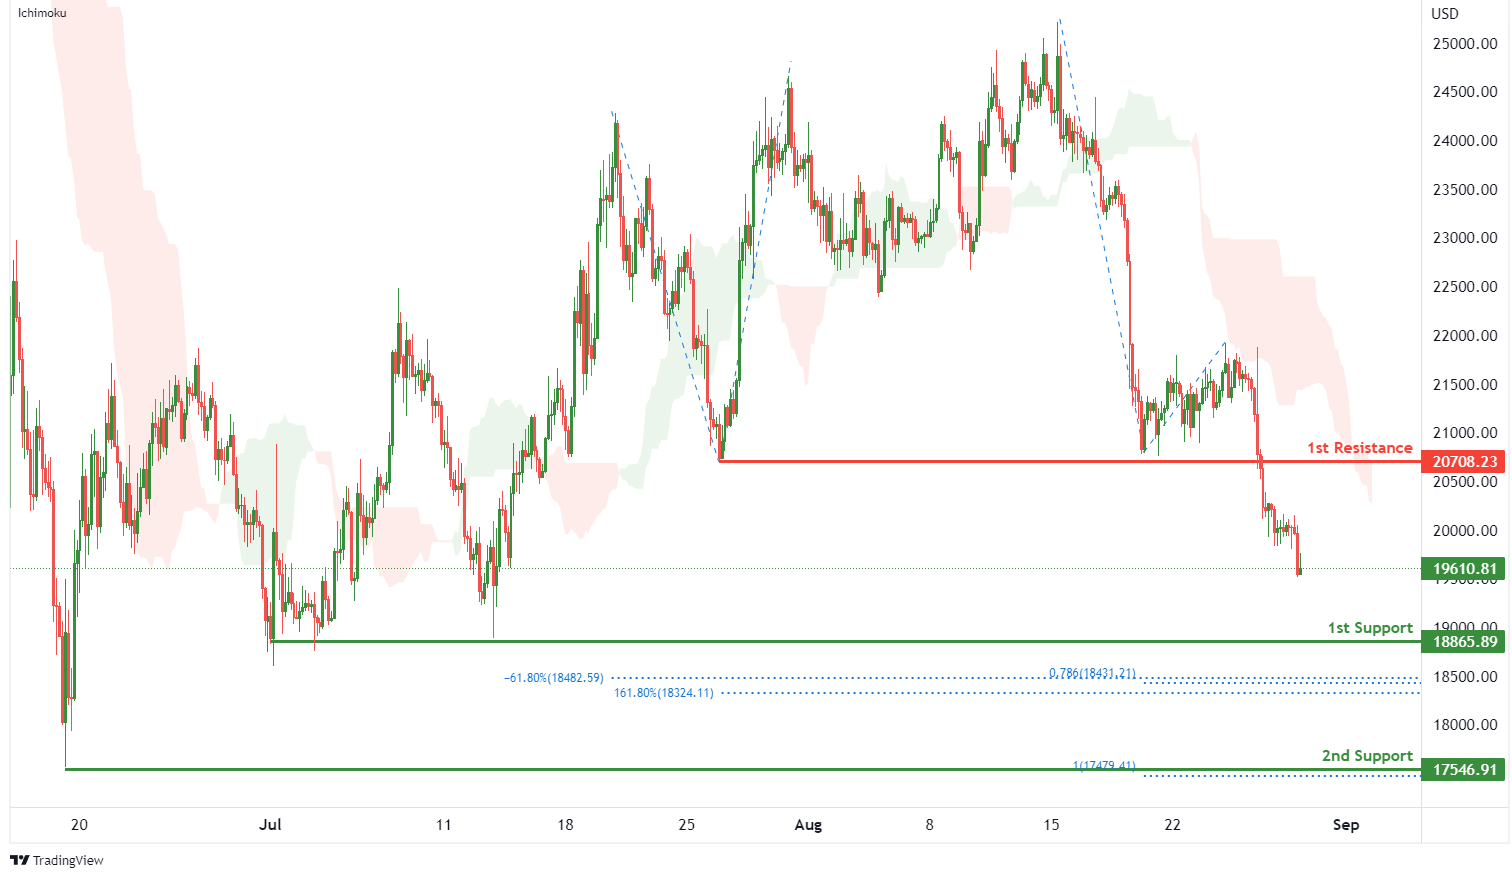
BTCUSD:
On the H4, with price moving below an ichimoku indicator, we have a bearish bias that price will drop to 1st support 18865.89 where the overlap support, -61.8% fibonacci expansion, 161.8% fibonacci extension and 78.6% fibonacci projection are. Should price break 1st support, we have a bearish bias that price will drop to 2nd support at 17546.91 where the swing low support and 100% fibonacci projection are. Alternatively, price could rise to 1st resistance at 207078.23 where the pullback resistance is.
Areas of consideration:
- H4 time frame, 1st resistance of 207078.23
- H4 time frame, 1st support at 18865.89
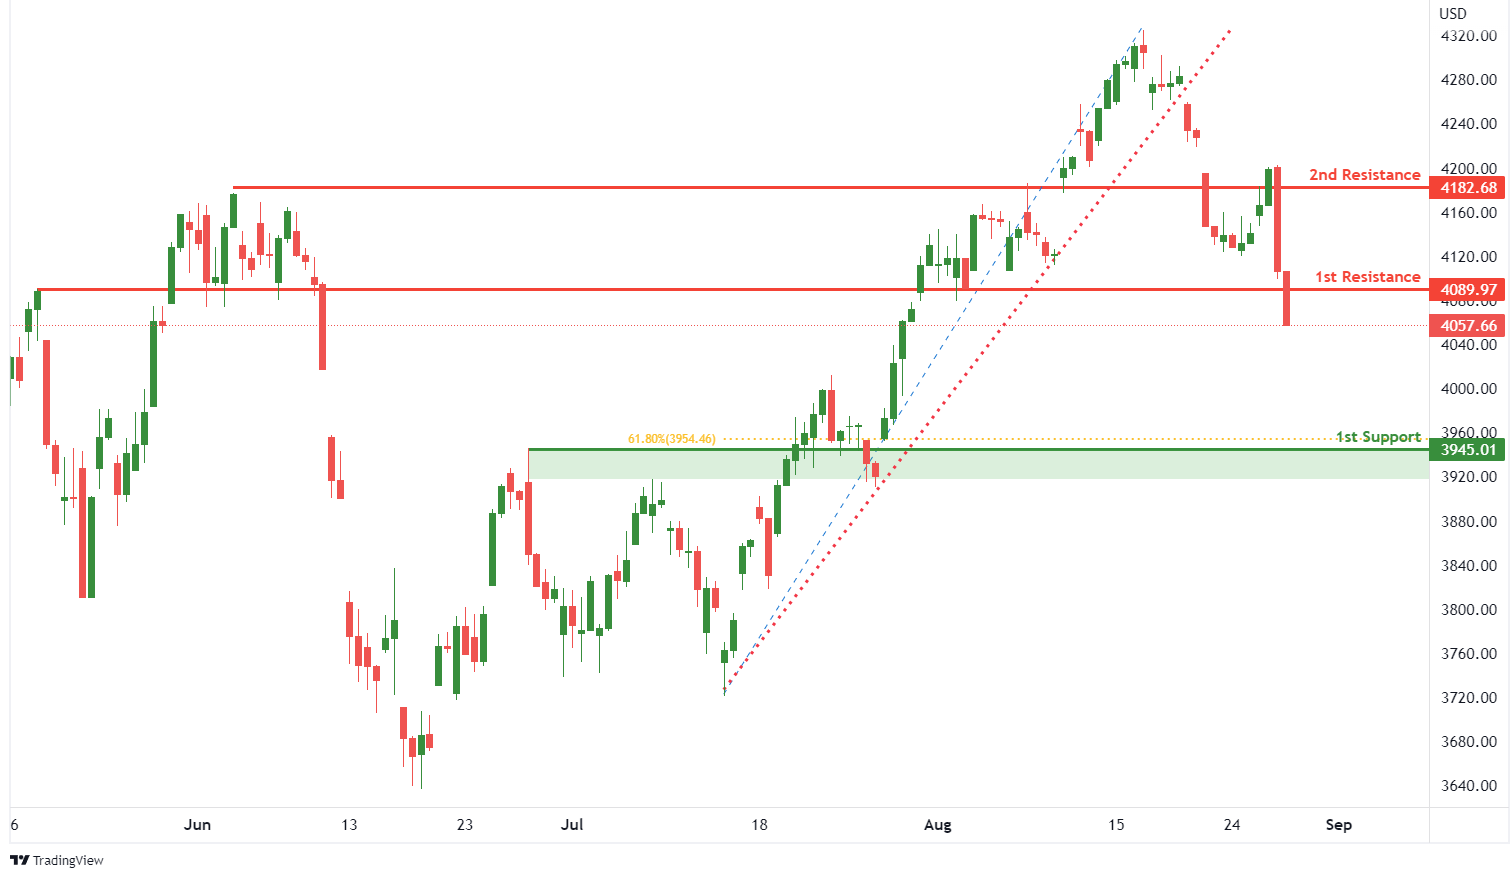
S&P 500:
On the H4, with prices breaking out of the ascending trendline, we have a bearish bias that price will drop from 1st resistance at 4089.97 where the pullback resistance is to the 1st support at 3945.01 where the pullback support and 61.8% fibonacci retracement are. Alternatively, price could rise to 2nd resistance at 4182.68 where the pullback resistance is.
Areas of consideration:
- H4 time frame, 1st resistance of 4089.97
- H4 time frame, 1st support at 3945.01


