
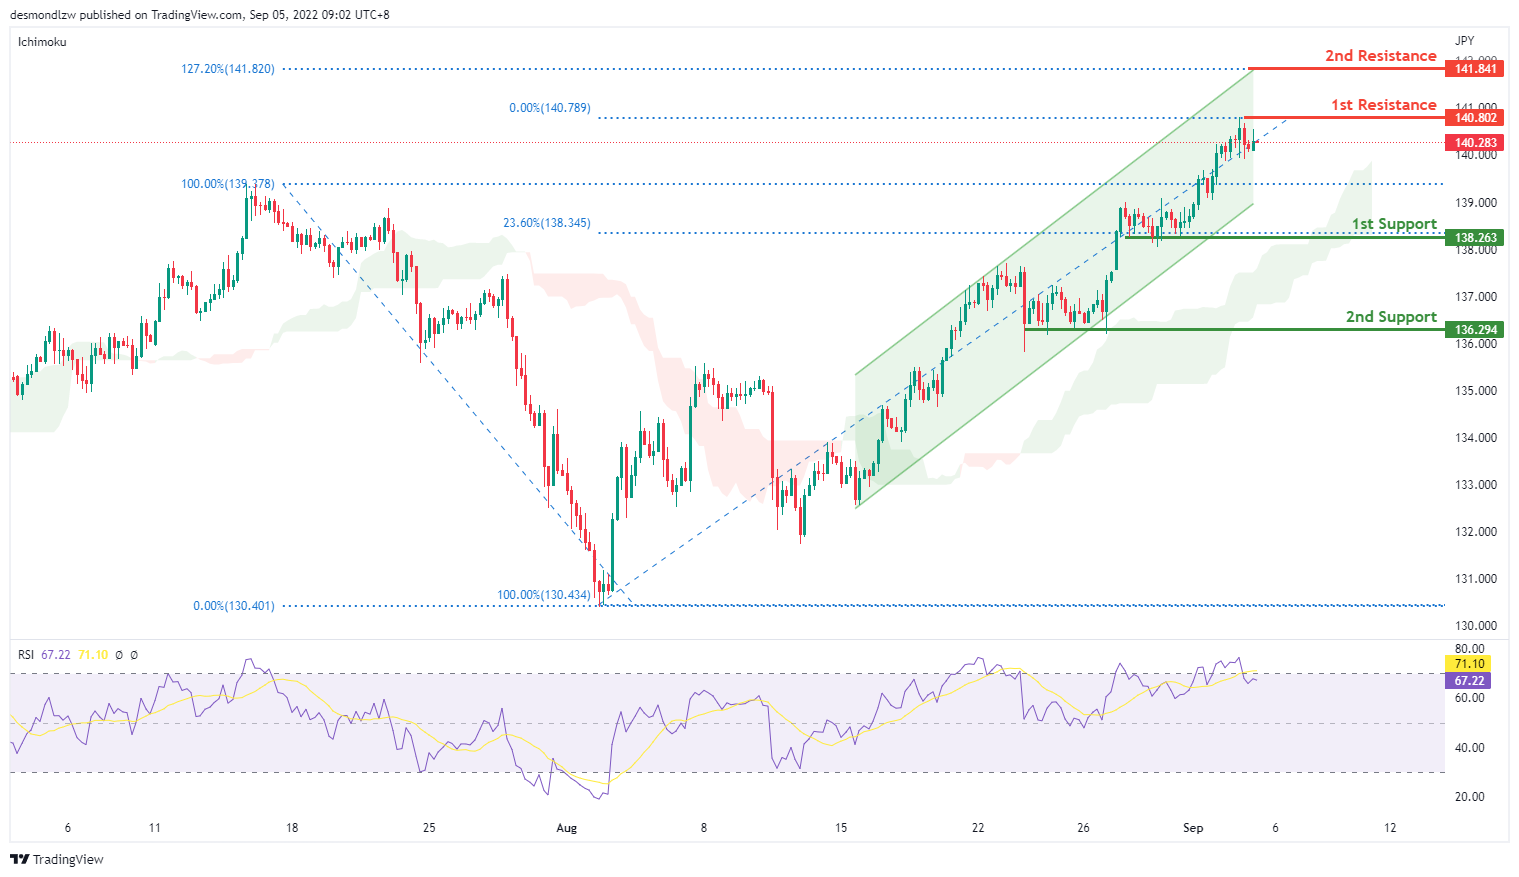
USD/JPY:
On the H4 chart, price has confirmed a bullish momentum breaking the previous high. We are bullish bias- Price has pulled back slightly but if bullish momentum continues, it should test the first resistance at 140.802 and then the second resistance at 141.841 where the 127.2% extension sits. Alternatively, if price reverse, it might pull back to test the first support at 138.263 where the 23.6% retracement sits then the second support at 136.294 levels
Areas of consideration:
- H4 time frame, 1st resistance at 140.802
- H4 time frame, 1st support at 138.263
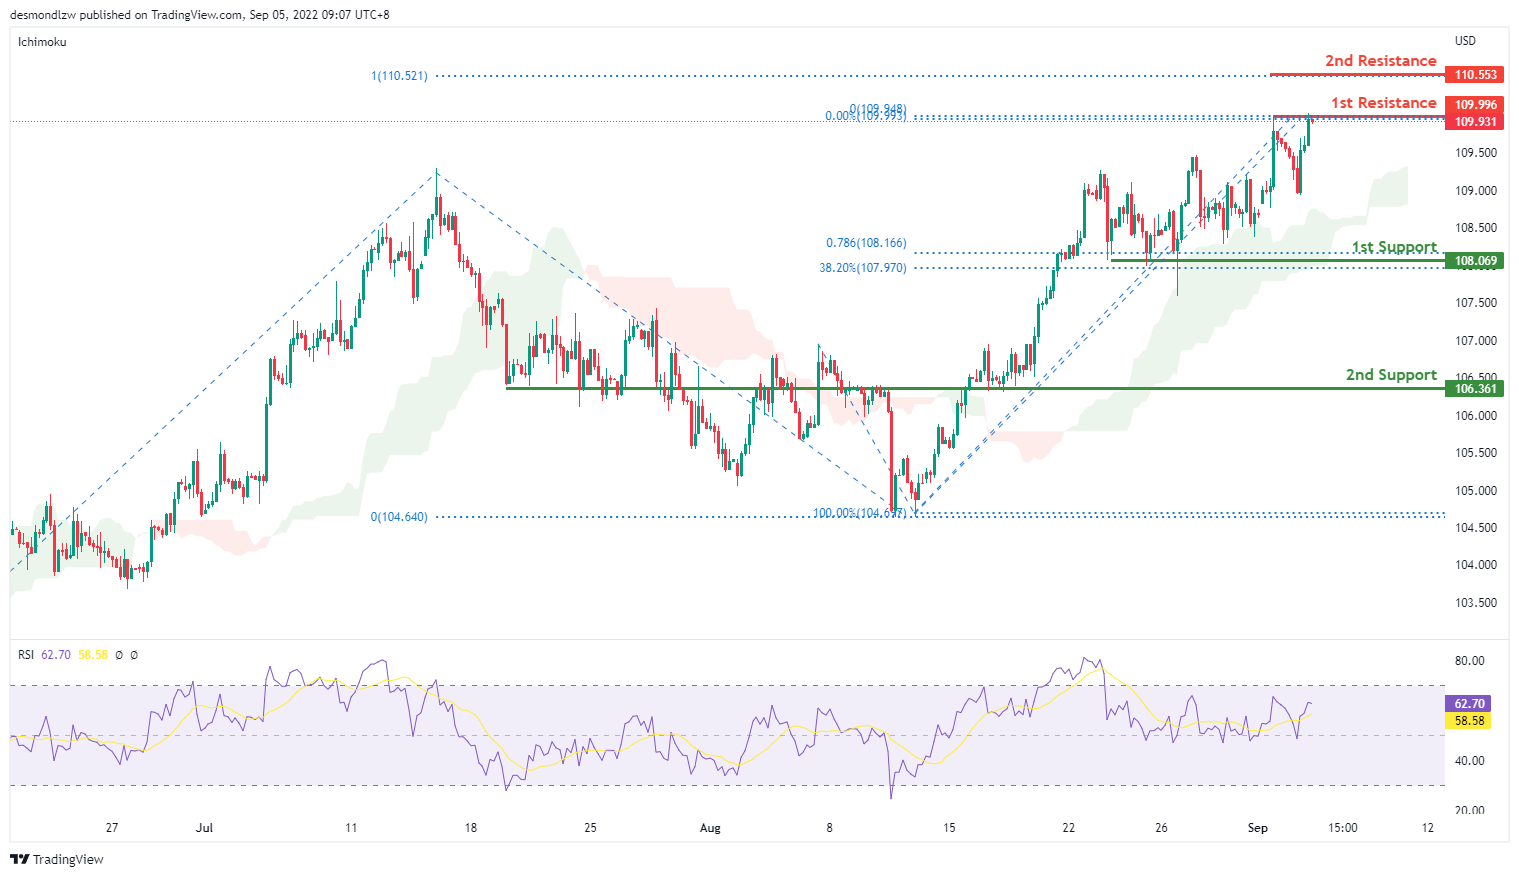
DXY:
On the H4, price seems to be ranging but it is still moving in an ascending trend and is in a bullish momentum. Price is currently testing the first resistance at 109.996 levels. If bullish momentum continues, it should bring price up to 110.553 where the 100% Fibonacci projection sits. If price fails to break this level, it will pull back to test the first support at 108.069 where the 78.6% projection and 38.2% retracement sits and subsequently the second support at 106.361 levels
Areas of consideration:
- H4 time frame, 1st resistance at 109.996
- H4 time frame, 1st support at 108.069
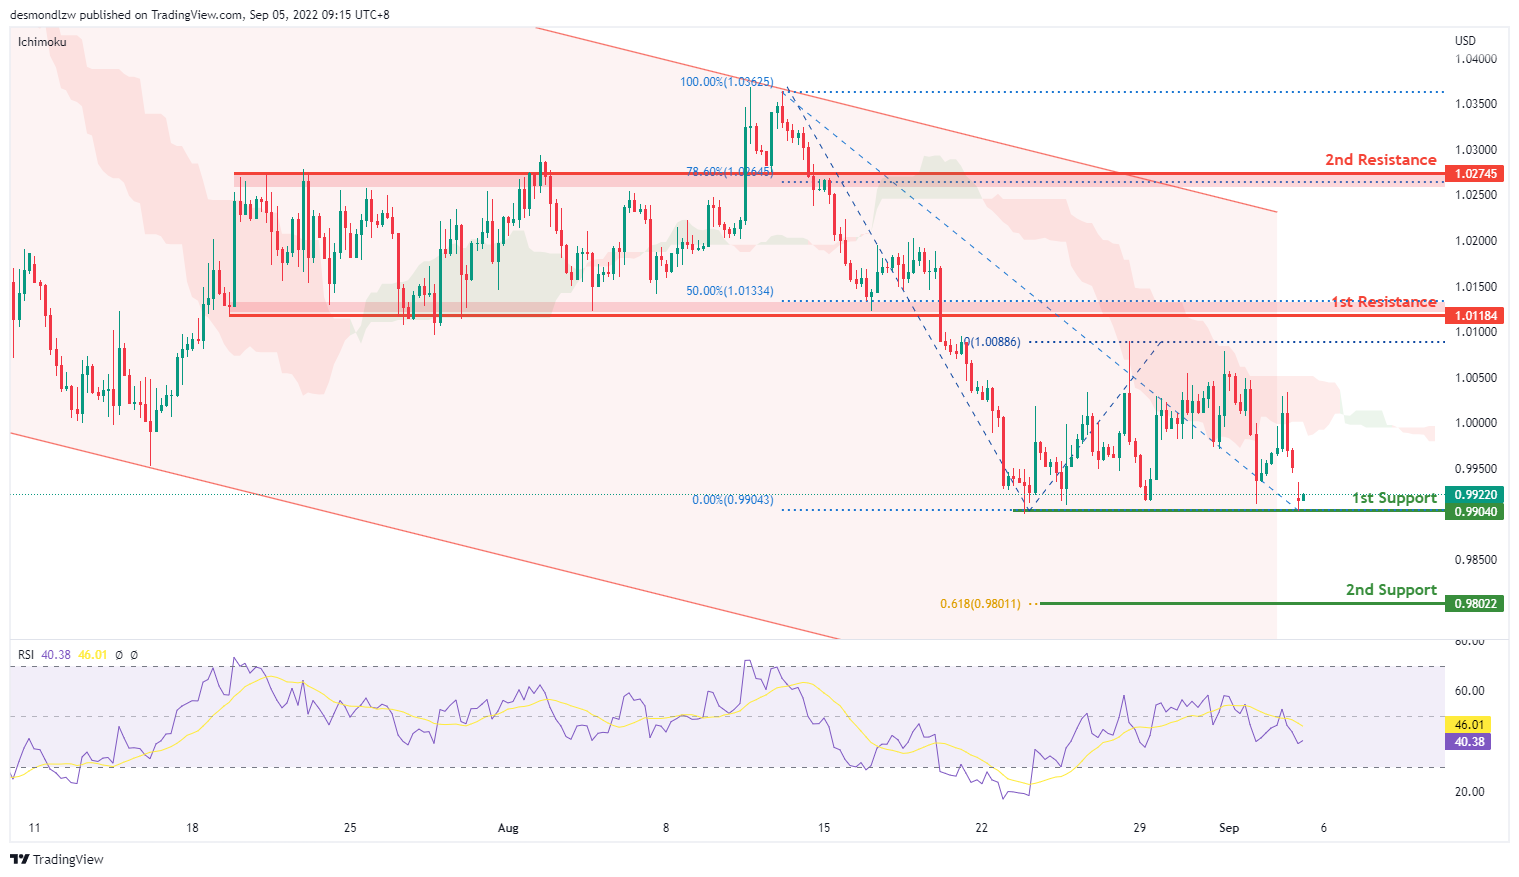
EUR/USD:
On the H4, price seem to have formed a bottom and is pulling back slightly – we are slightly bullish bias. Price looks like it’s pulling back to test the first resistance at 1.0118 where the previous swing low and 50% retracement sits and subsequently the second resistance at 1.0274 where the 78.6% retracement and swing high sits. If price fail to test the first resistance, it might pull back to test the first support at 0.9904 again and then the second support at 0.9802 where the 61.8% projection sits
Areas of consideration :
- H4 1st resistance at 1.0118
- H4 1st support at 0.9904
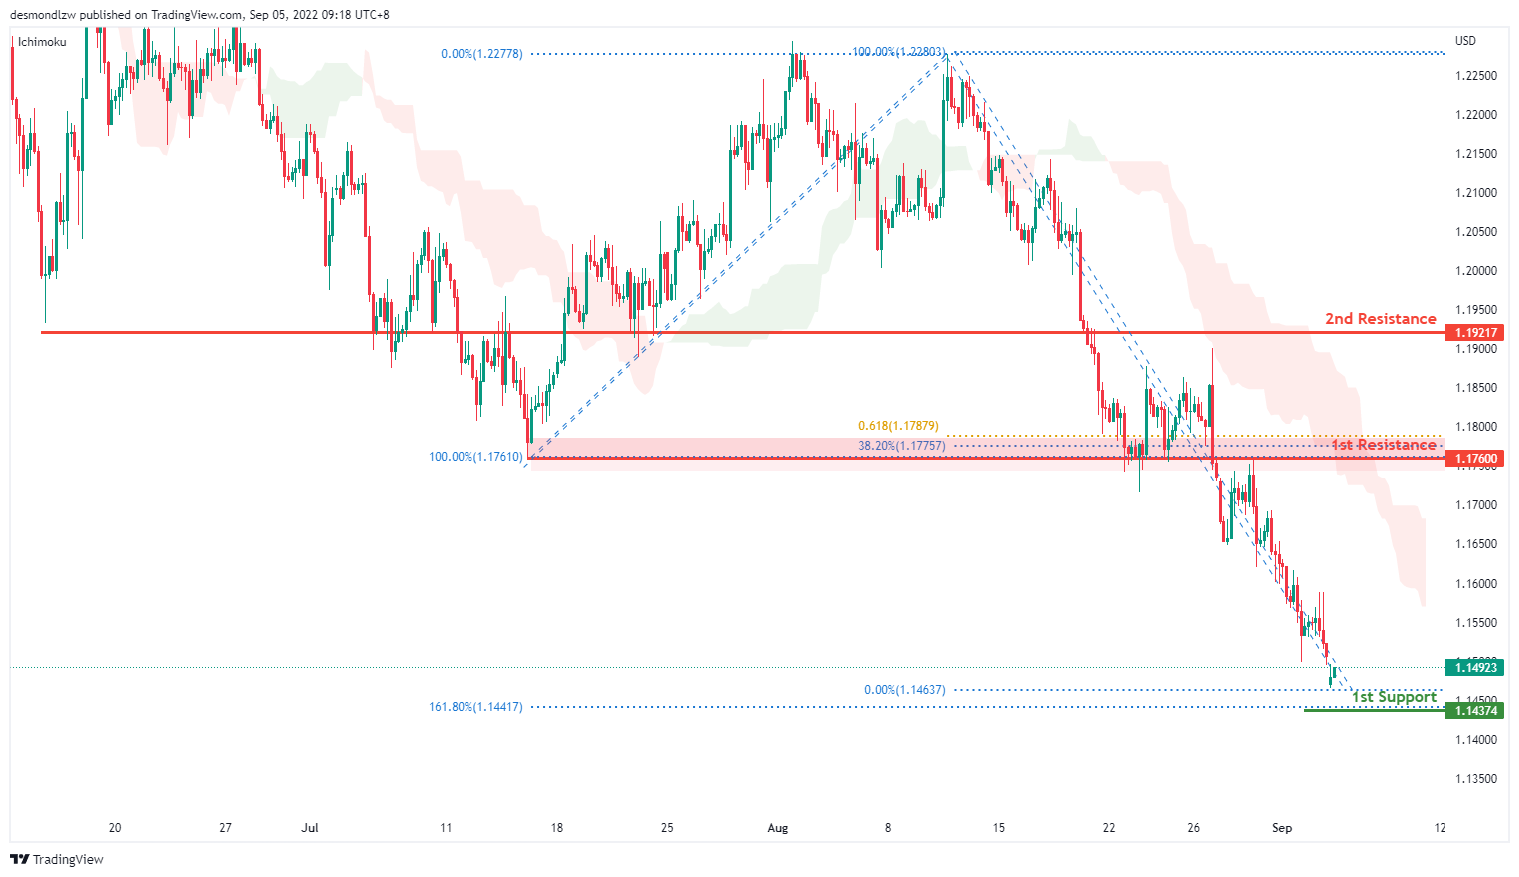
GBP/USD:
On the H4, prices seem to be in a bearish momentum and respecting the ichimoku cloud. Prices have broken the 78.6% projection level and is moving toward the first support at 1.1437 levels where the 161.8% extension sits. Alternatively, if it fails to break this level, it might look to test the first resistance at 1.1760 level where the 61.8% projection and 38.2% retracement sits then the second resistance at 1.1921 level where the previous swing low and 78.6% projection sits
Areas of consideration:
- H4 1st resistance at 1.1760
- H4 1st support at 1.1437
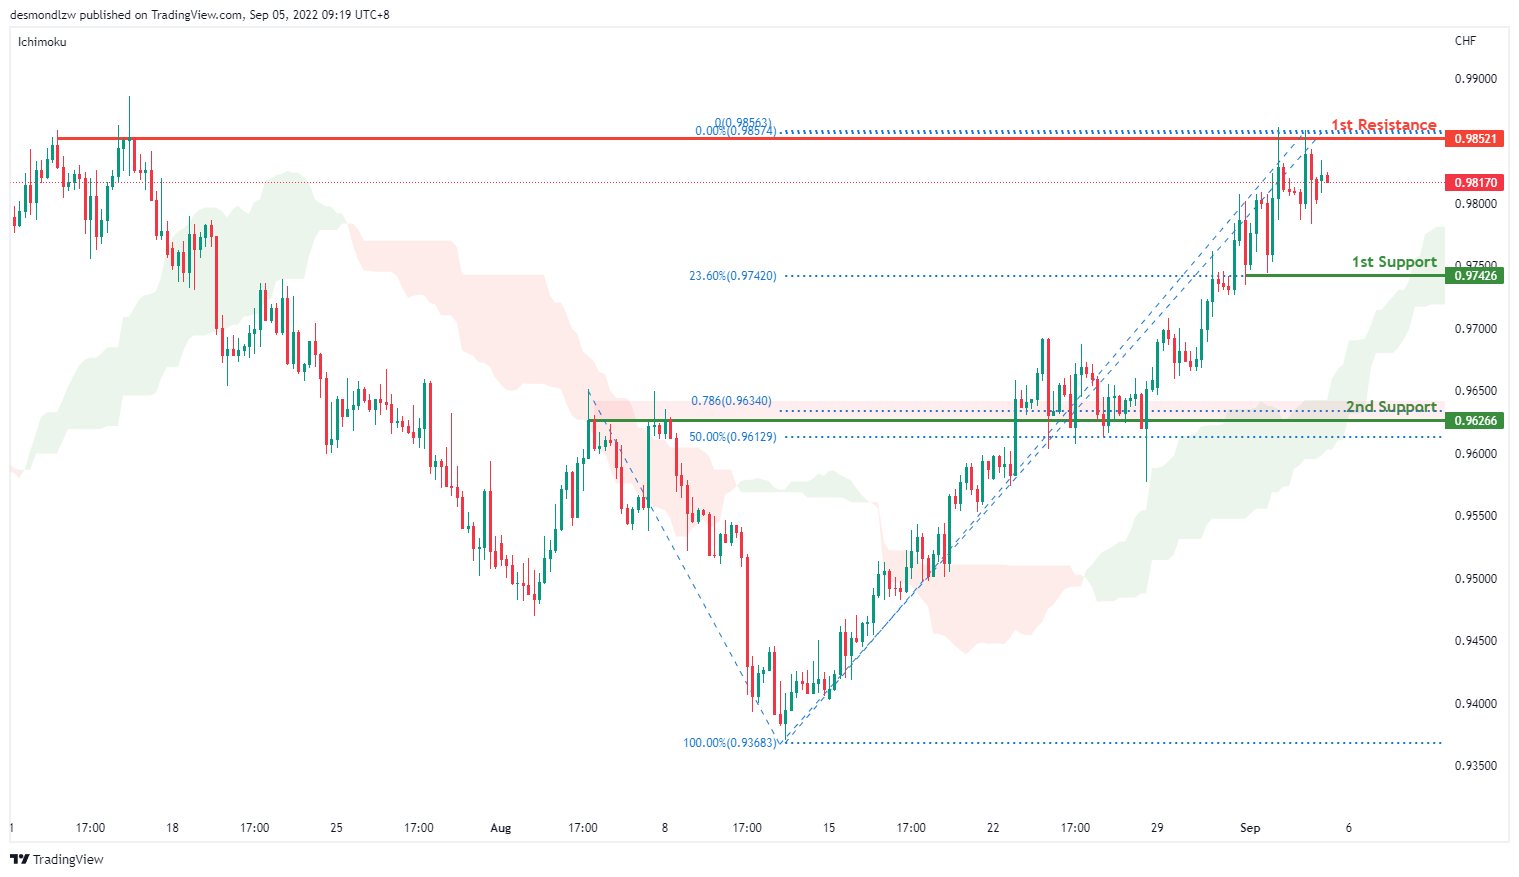
USD/CHF:
On the H4, with prices moving above the ichimoku cloud and breaking the descending trend, we are bullish. Price has tested the first resistance at 0.9852 where the previous swing high sits and has pulled back slightly. If price do not break the first resistance, it could pull back to test the first support around the 0.9742 levels where the 23.6% retracement and swing low sits, subsequently the second support at 0.9626 where the 50% fibonacci retracement,78.6% projection and previous swing low sits
Areas of consideration
- H4 1st support at 0.9742
- H4 1st resistance at 0.9852
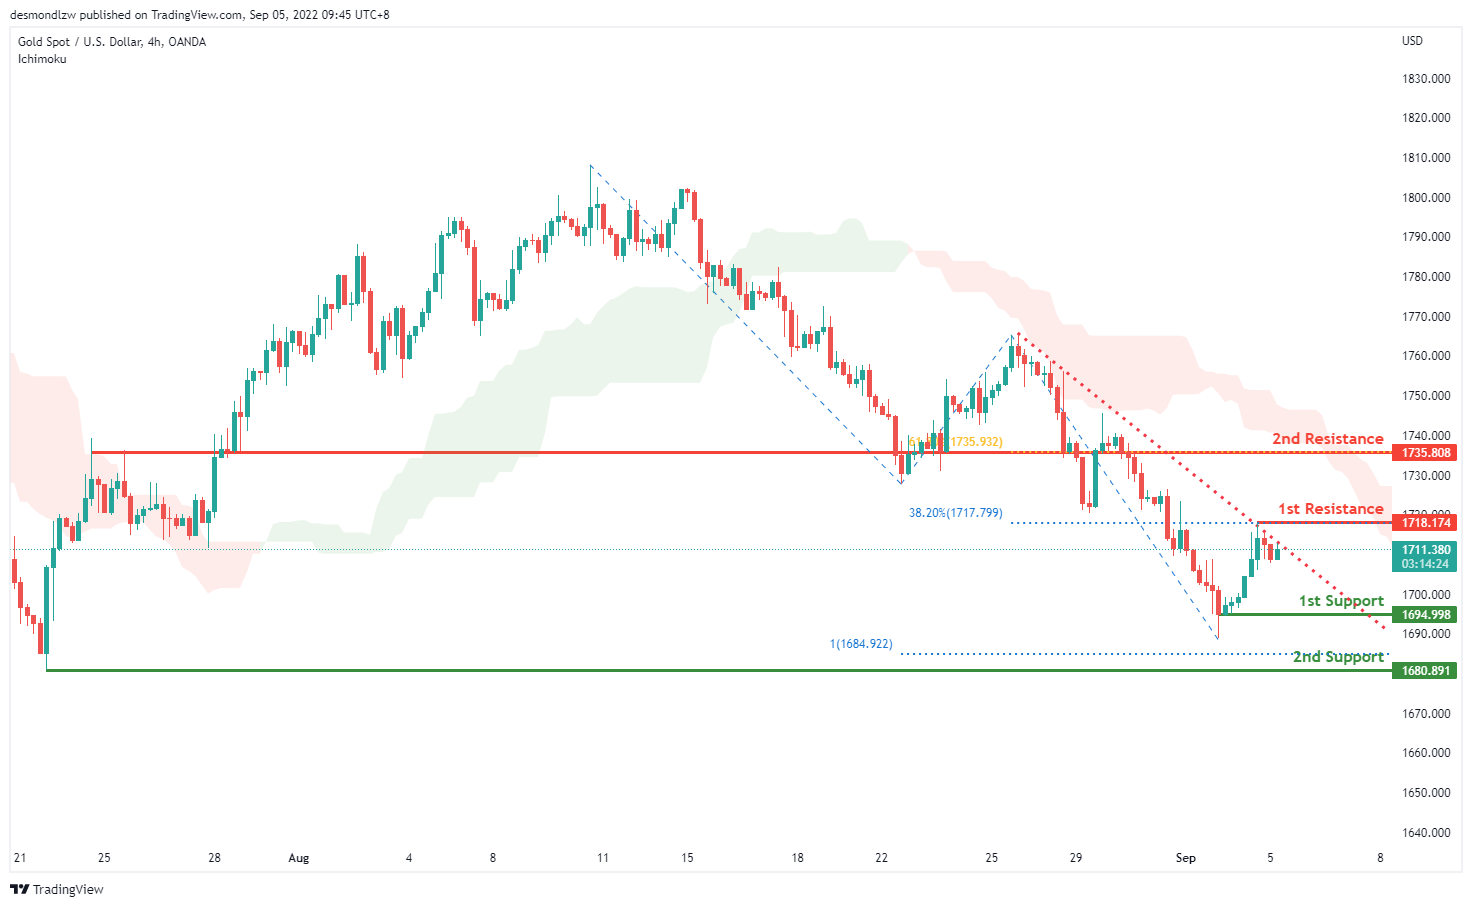
XAU/USD (GOLD):
On the H4, with prices below ichimoku cloud and moving within the descending trendline, we have a bearish bias that the price may drop to the 1st support at 1694.998, where the previous swing low is. If the price can break this support line, the next support level could be at 1680.891, where the significant swing low is. Alternatively, the price may rise to the 1st resistance at 1718.174, where the price tested before and 38.2% fibonacci retracement is. If the price retest this level and break it, the 2nd resistance could be at 1735.808, which is in line with previou swing highs and 61.8% fibonacci retracement.
Areas of consideration:
- H4 time frame, 1st resistance at 1718.174
- H4 time frame, 1st support at 1694.998
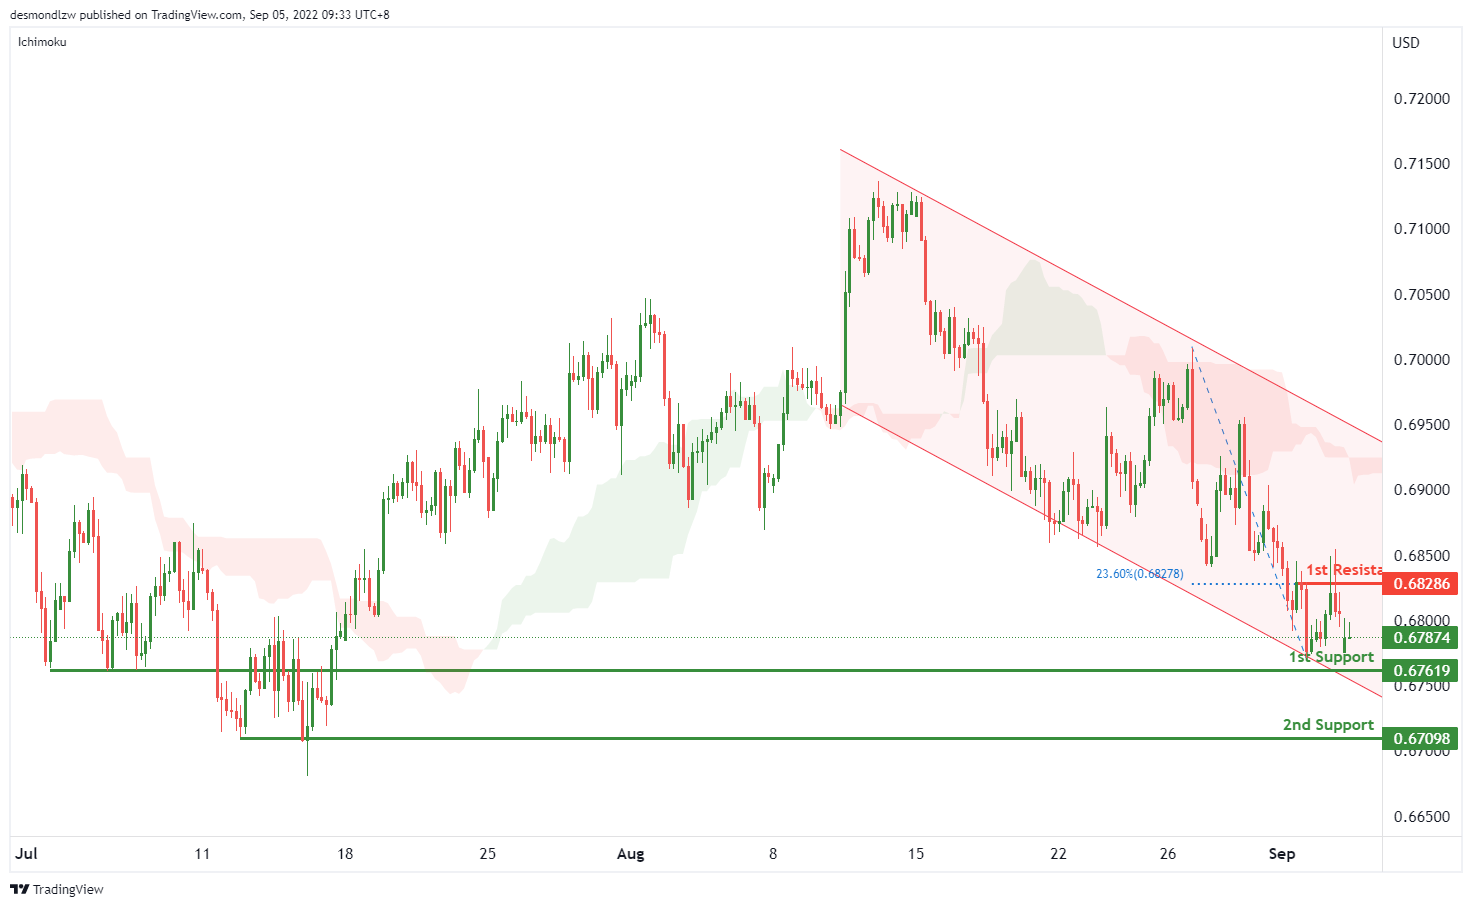
AUD/USD:
On the H4, with the price moving below the ichimoku cloud and moving within the descending channel, we have a bearish bias that the price may drop from the 1st support at 0.67619, which is in line with the multiple swing lows to the 2nd support at 0.67098, where the swing lows are. Alternatively, the price may rise to the 1st resistance 0.68286, where the 23.6% fibonacci retracement is.
Areas of consideration
- H4 1st support at 0.67619
- H4 2nd support at 0.67098
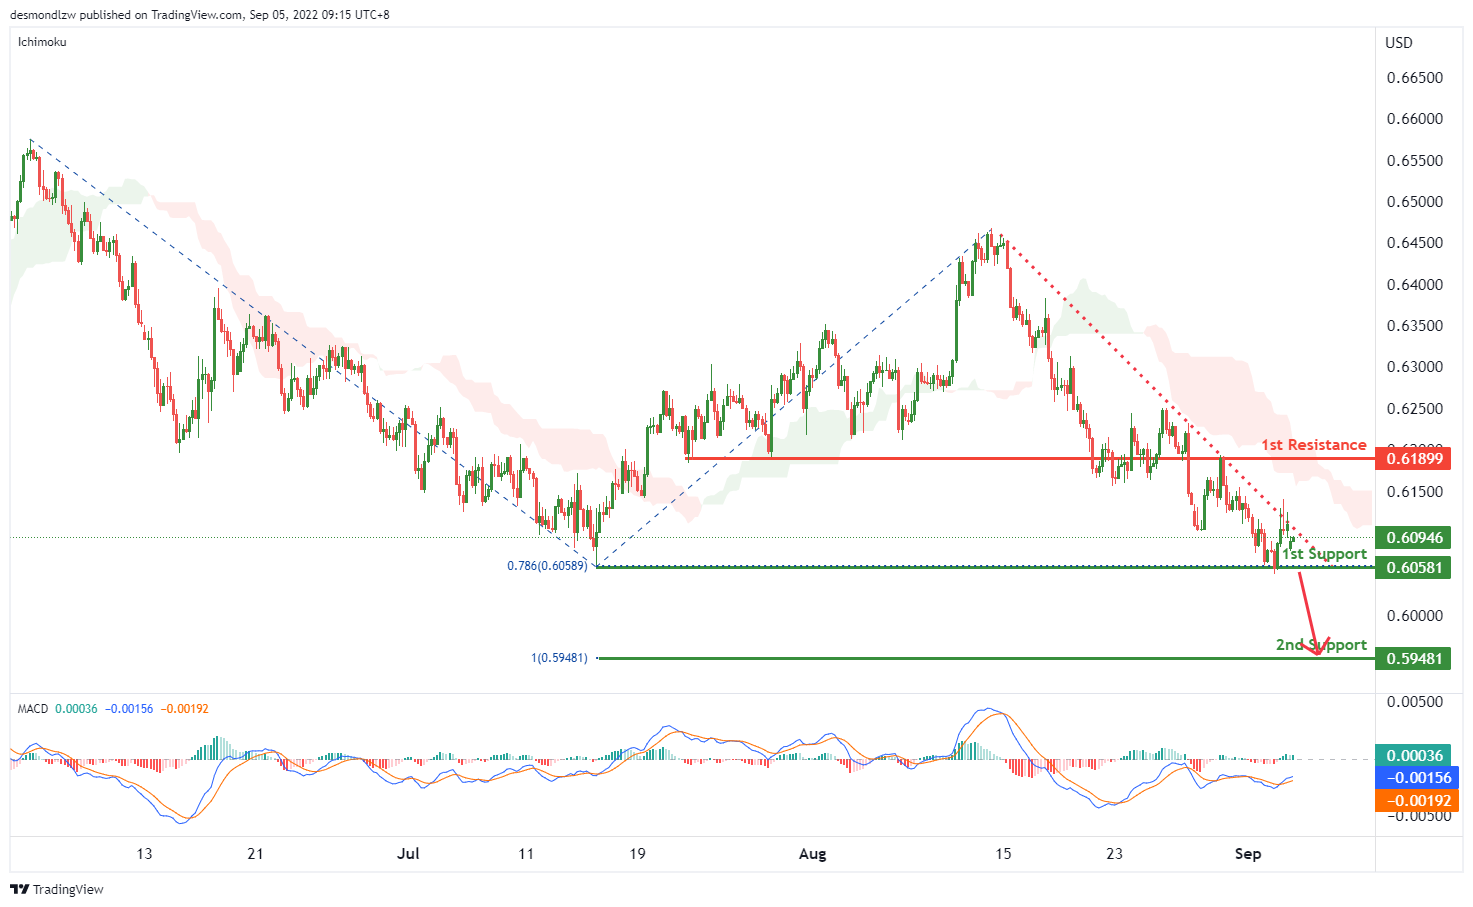
NZD/USD:
On the H4, with price moving within the descending trendline and below the ichimoku indicator, we have a bearish bias that price may drop to the 1st support at 0.60581, where is the 78.6% fibonacci projection, if the price can break the 1st support, the 2nd support could be at 0.59481, where the 100% fibonacci projection are. Alternatively, price could rise to 1st resistance at 0.61899, which is in line with overlap resistance.
Areas of consideration:
- H4 time frame, 1st support at 0.60581
- H4 time frame, 2nd support at 0.59481
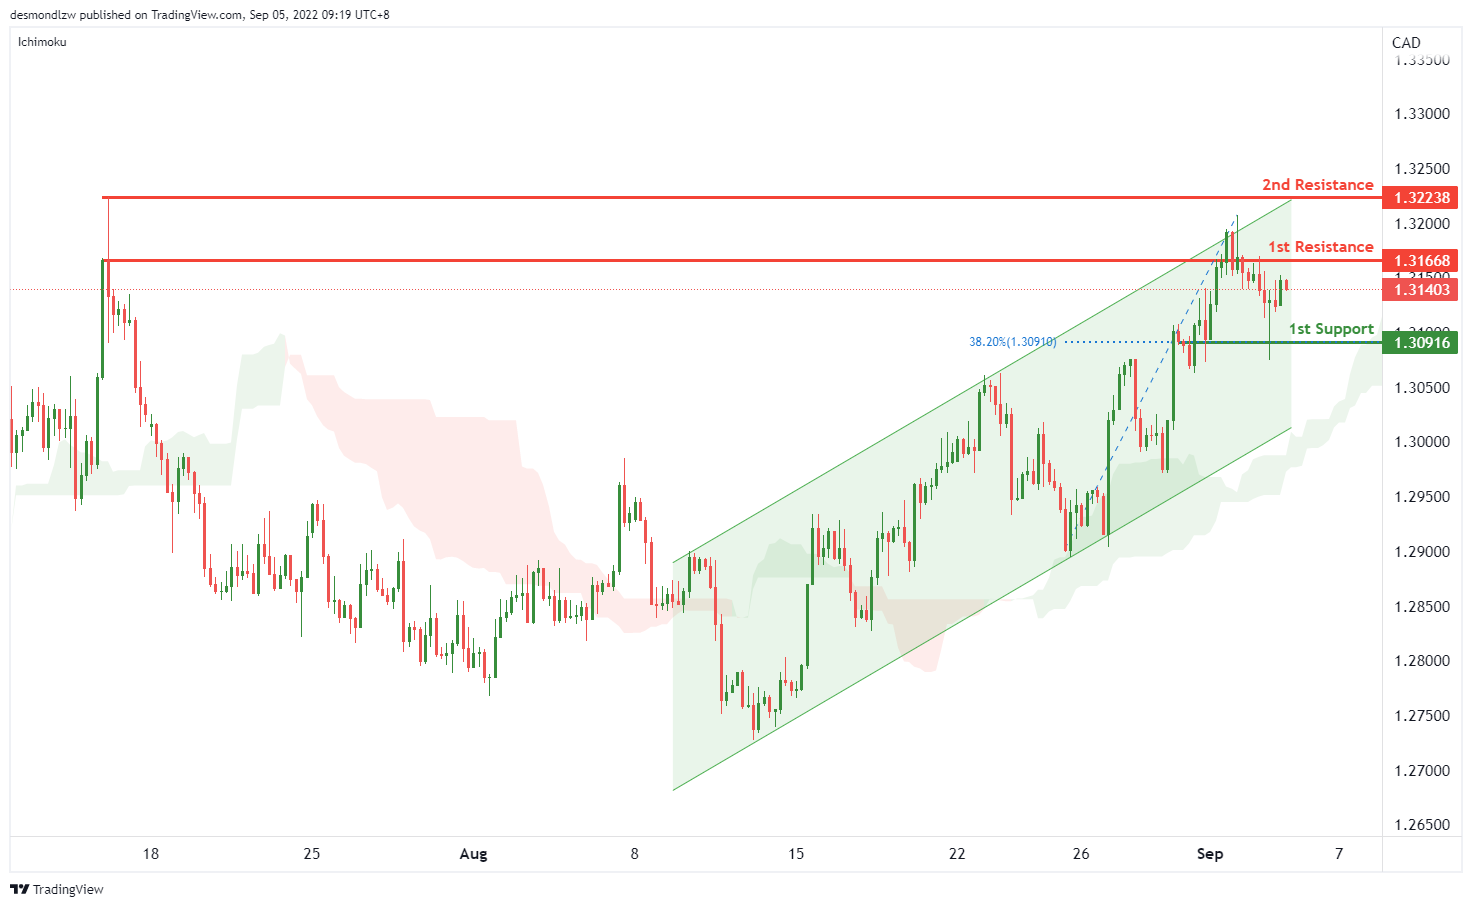
USD/CAD:
On the H4, with the price moving within the ascending channel, above ichimoku cloud, we have a bullish bias that the price may rise to the 1st resistance at 1.31668, where the swing highs are, If the price can break the 1st resistance, we can expect the price rise to the 2nd resistance at 1.32238, where the swing high is. Alternatively, price could pullback from the 1st resistance and drop to the 1st support at 1.30916, where the overlap support and 23.6% fibonacci retracement are.
Areas of consideration:
- H4 time frame, 1st resistance at 1.31668
- H4 time frame, 2nd resistance at 1.32238
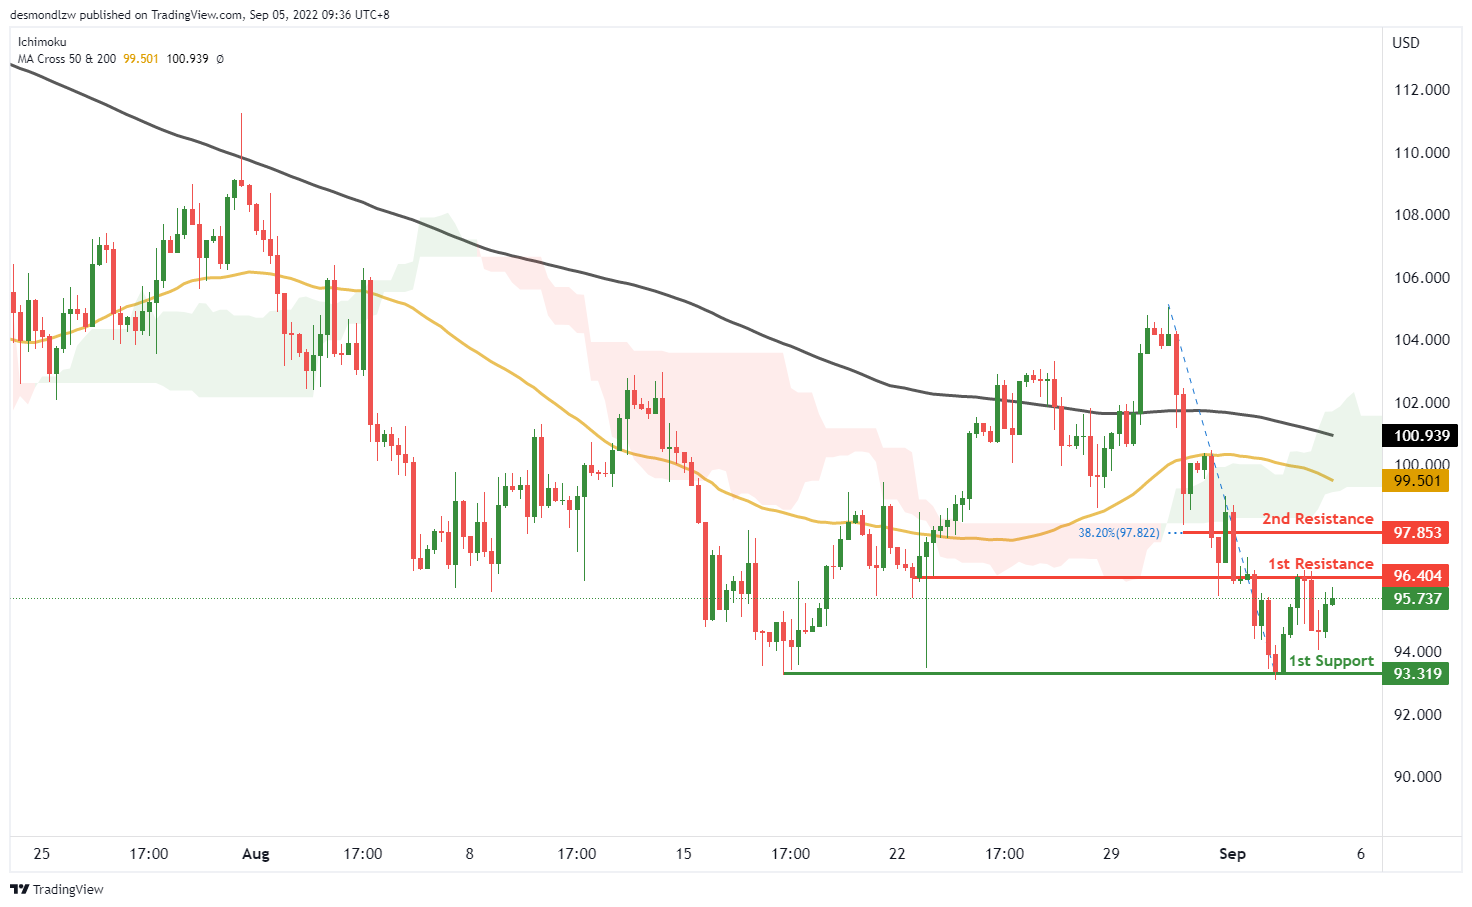
OIL:
On the H4, with price below ichimoku cloud and MA Cross, we have a bearish bias that the price may pullback to the 1st resistance at 96.404, where the overlap resistance is, and then drop to the 1st support at 93.319, which is in line with the swing lows support. Alternatively, if the price breaks the 1st resistance, the 2nd resistance could be at 97.853, where the 38.2% fibonacci retracement is.
Areas of consideration:
- H4 time frame, 1st resistance at 96.404
- H4 time frame, 1st support at 93.319
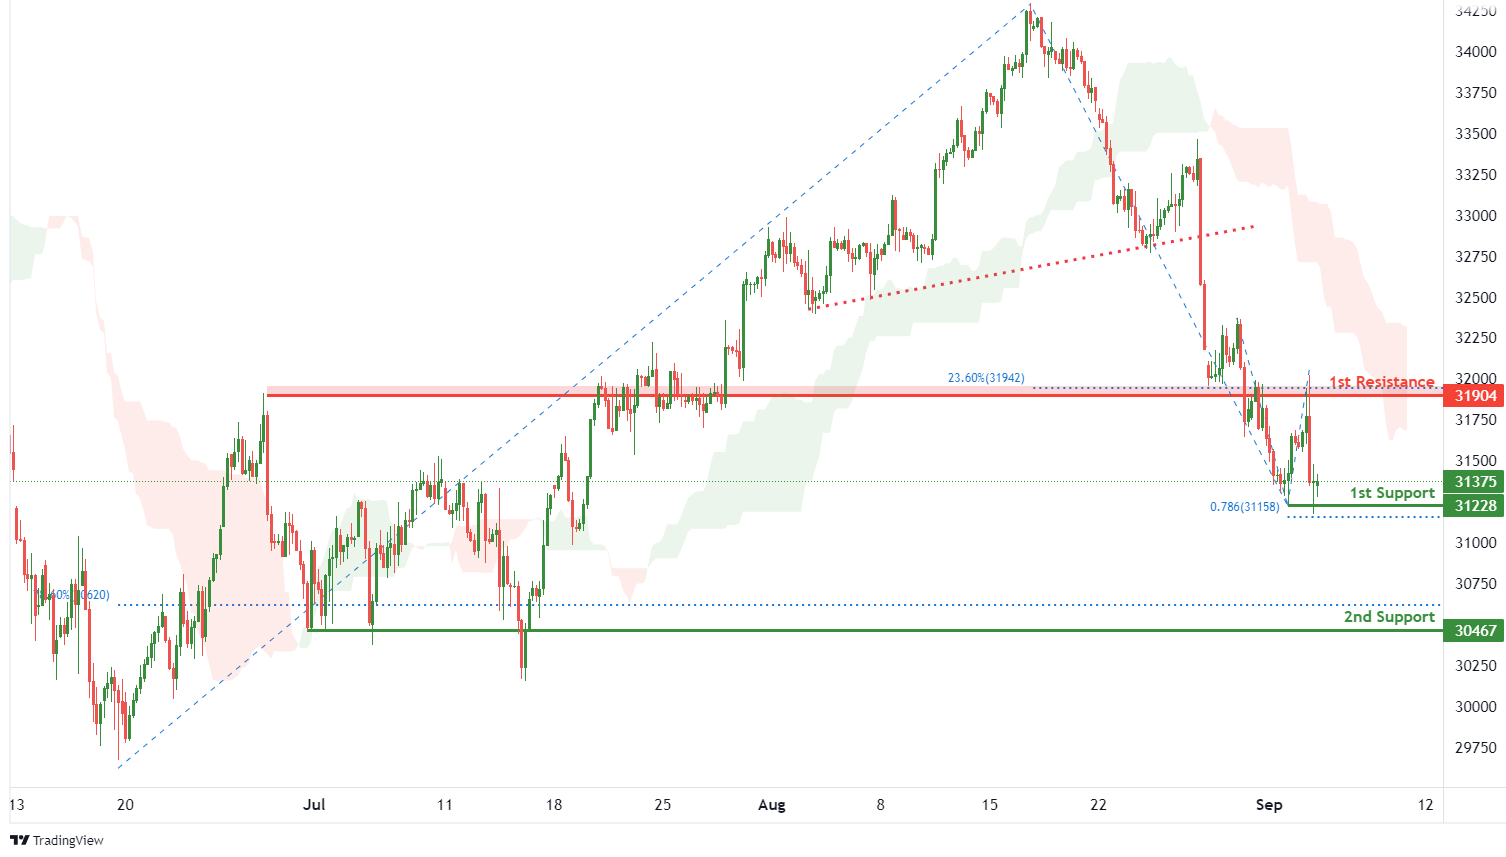
Dow Jones Industrial Average:
On the H4, with price breaking the ascending trendline and moving below the ichimoku indicator, we have a bearish bias that price will drop to 1st support at 31228 where the swing low support and 78.6% fibonacci projection are. Once there is downside confirmation that price has broken 1st support structure, we would expect bearish momentum to carry price to 2nd support at 30467 where the pullback support and 78.6% fibonacci retracement are. Alternatively, price could rise to 1st resistance at 31904 where the overlap resistance and 23.6% fibonacci retracement are.
Areas of consideration:
- H4 time frame, 1st resistance of 31904
- H4 time frame, 1st support at 31228
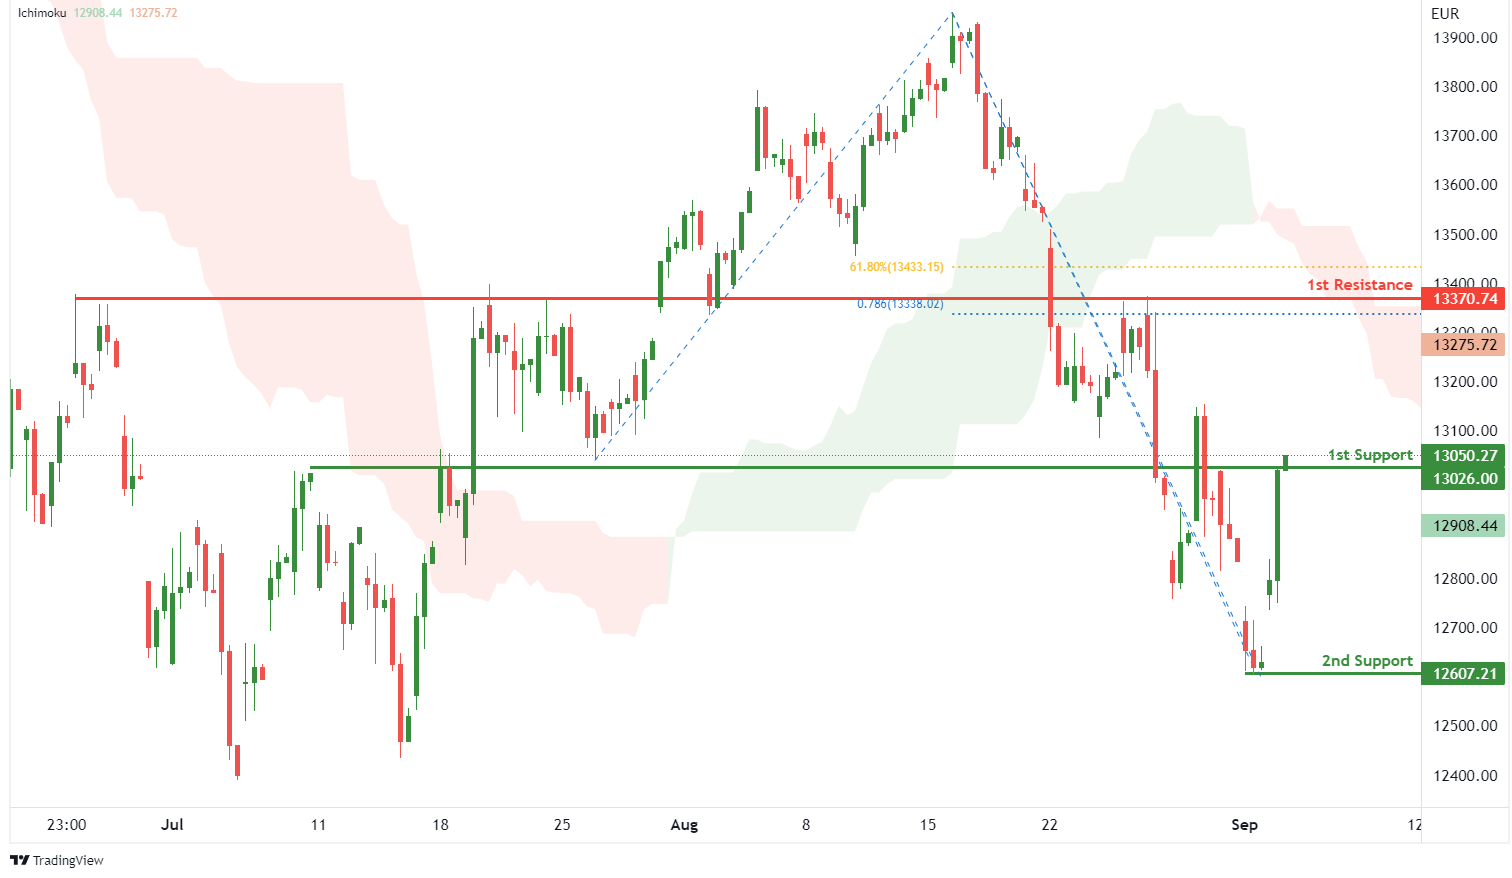
DAX:
On the H4, with price moving within below the ichimoku indicator, we have a bearish bias that price will drop to 1st support at 13026.00 where the pullback support is. Once there is downside confirmation that price has broken 1st support structure, we would expect bearish momentum to carry price to 2nd support at 12607.21 where the swing low support is. Alternatively, price could rise to 1st resistance at 13370.74 where the overlap resistance, 61.8% fibonacci retracement and 78.6% fibonacci projection are.
Areas of consideration:
- H4 time frame, 1st resistance of 13370.74
- H4 time frame, 1st support at 13026.00
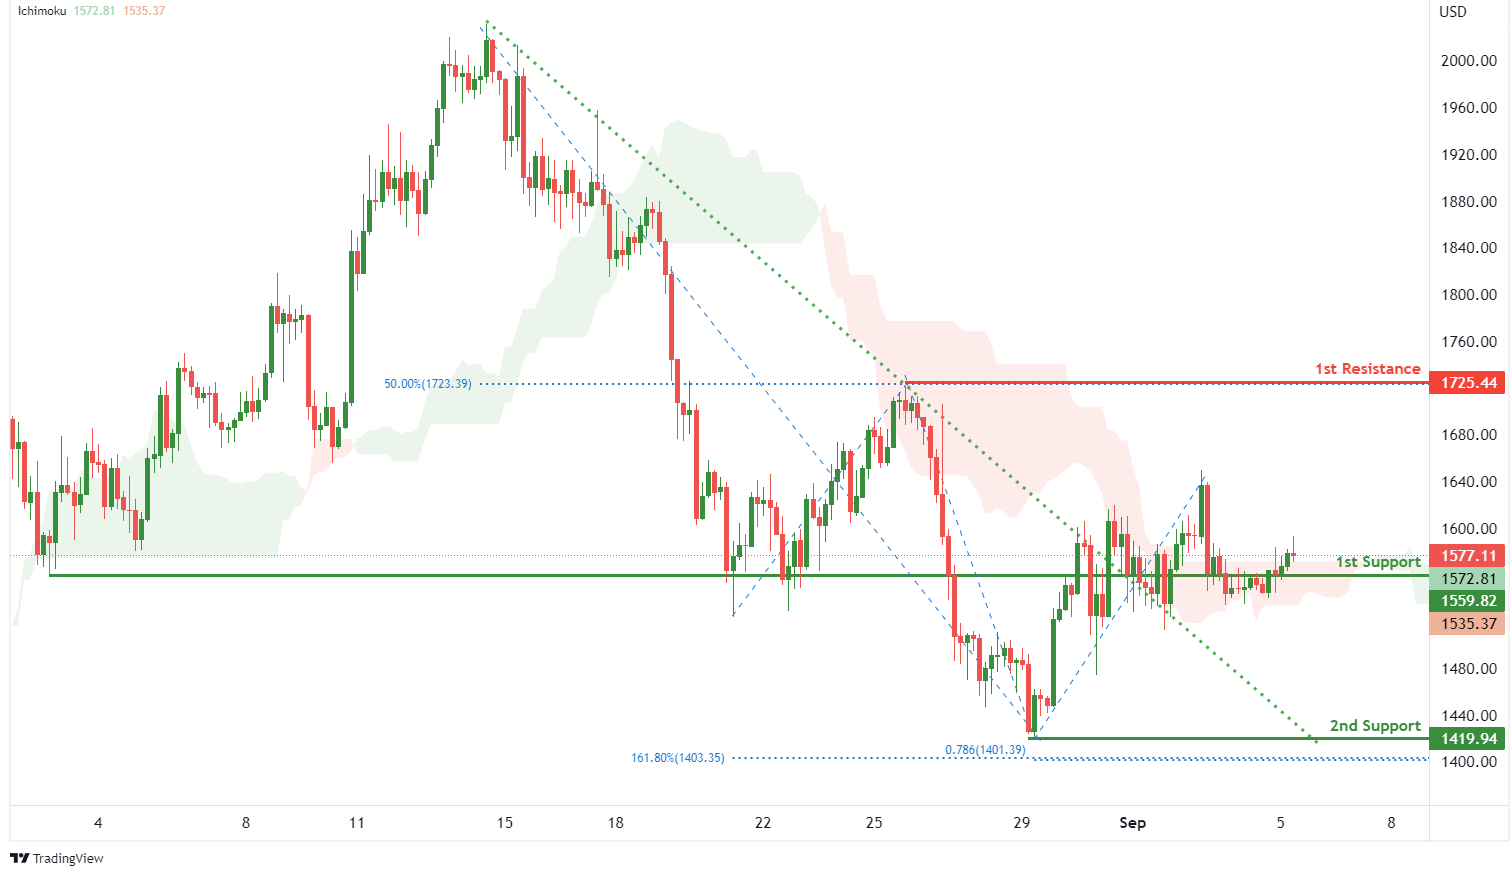
ETHUSD:
On the H4, with price breaking out of the descending trendline and moving above the ichimoku indicator, we have a bullish bias that price will rise from 1st support at 1559.82 where the overlap support is to the 1st resistance at 1725.44 where the swing high resistance and 50% fibonacci retracement are. Alternatively, price could break 1st support and drop to 2nd support at 1419.94 where the swing low support, 78.6% fibonacci projection and 161.8% fibonacci extension are.
Areas of consideration:
- H4 time frame, 1st resistance of 1725.44
- H4 time frame, 1st support at 1559.82
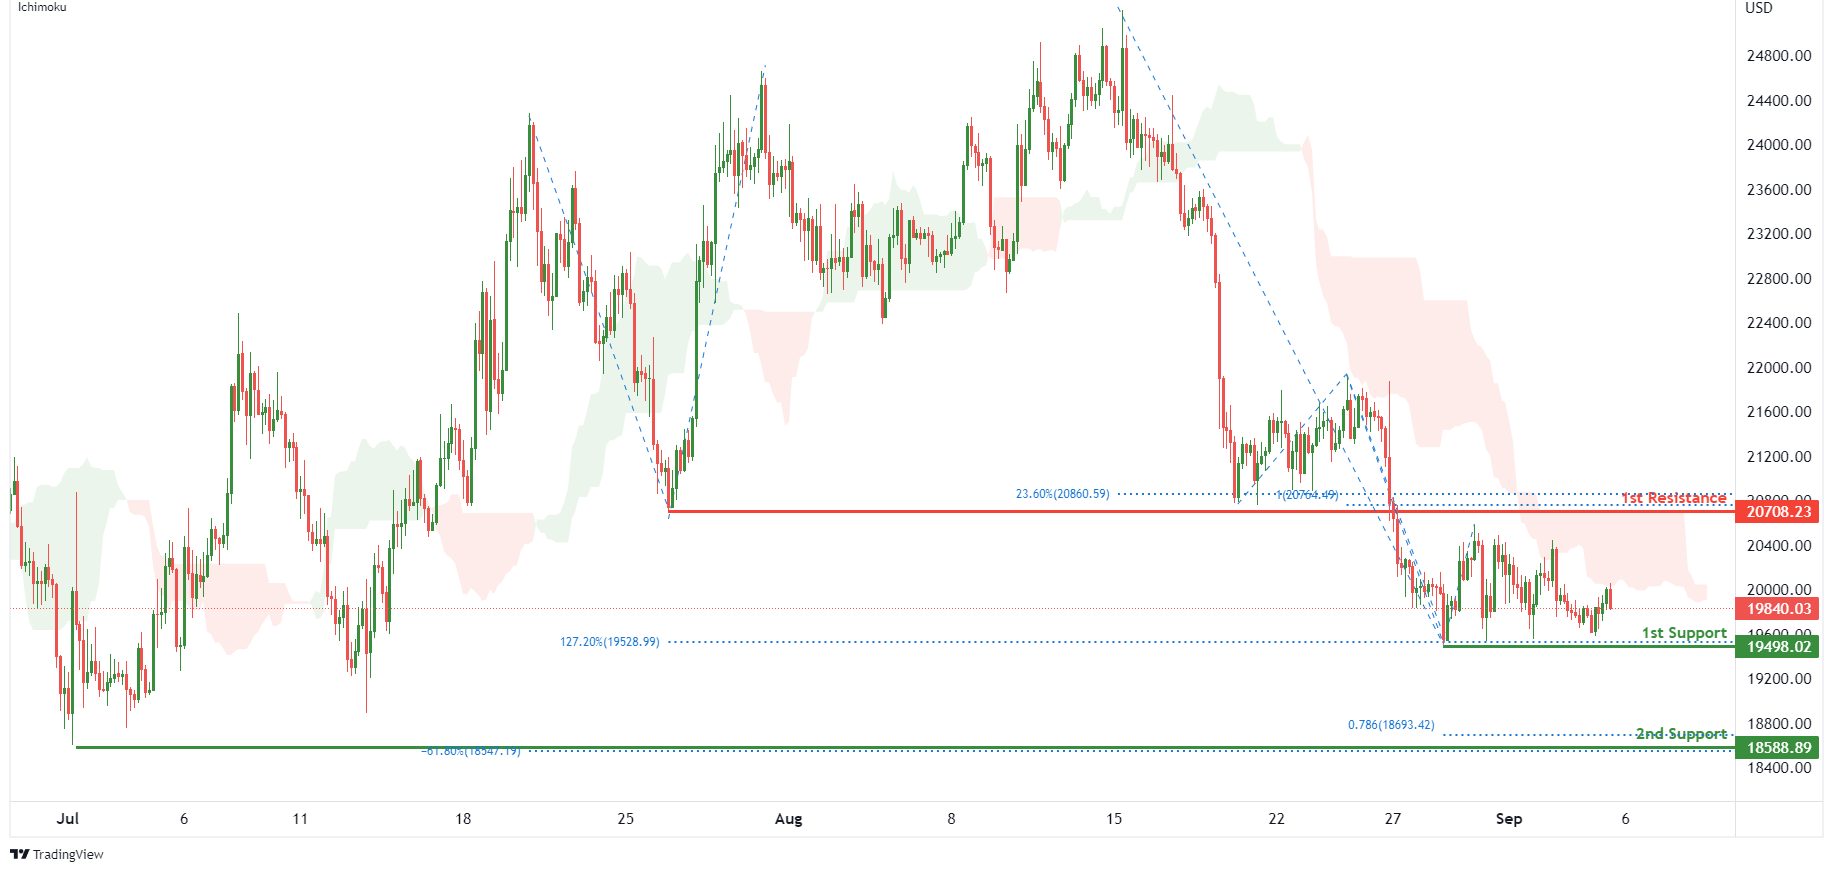
BTCUSD:
On the H4, with price moving below an ichimoku indicator, we have a bearish bias that price will drop to 1st support at 19498.02 where the swing low support and 127.2% fibonacci extension are. Should price break 1st support structure, we would expect bearish momentum to carry price to 2nd support at 18588.89 where the swing low support, -61.8% fibonacci expansion and 78.6% fibonacci projection are. Alternatively, price could rise to 1st resistance at 20708.23 where the pullback resistance, 100% fibonacci projection and 23.6% fibonacci retracement are.
Areas of consideration:
- H4 time frame, 1st resistance of 20708.23
- H4 time frame, 1st support at 19498.02
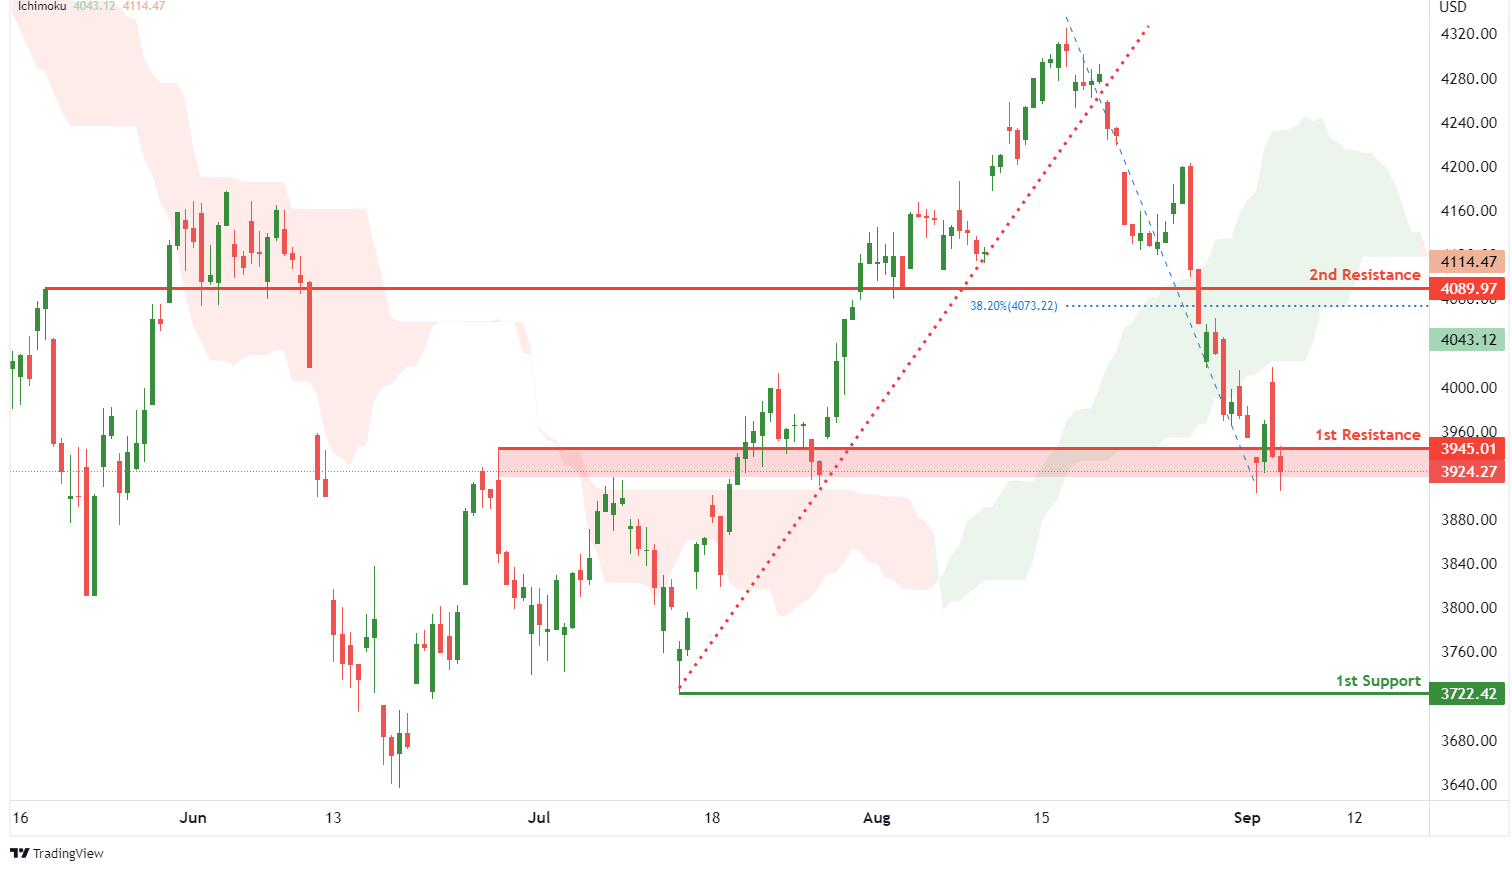
S&P 500:
On the H4, with prices breaking out of the ascending trendline and moving below the ichimoku indicator, we have a bearish bias that the price will drop from 1st resistance at 3945.01 where the pullback resistance is to the 1st support at 3722.42 where the swing low support is. Alternatively, price could break 1st resistance structure and rise to 2nd resistance at 4089.97 where the pullback resistance and 38.2% fibonacci retracement are.
Areas of consideration:
- H4 time frame, 1st resistance of 3945.01
- H4 time frame, 1st support at 3722.42


