
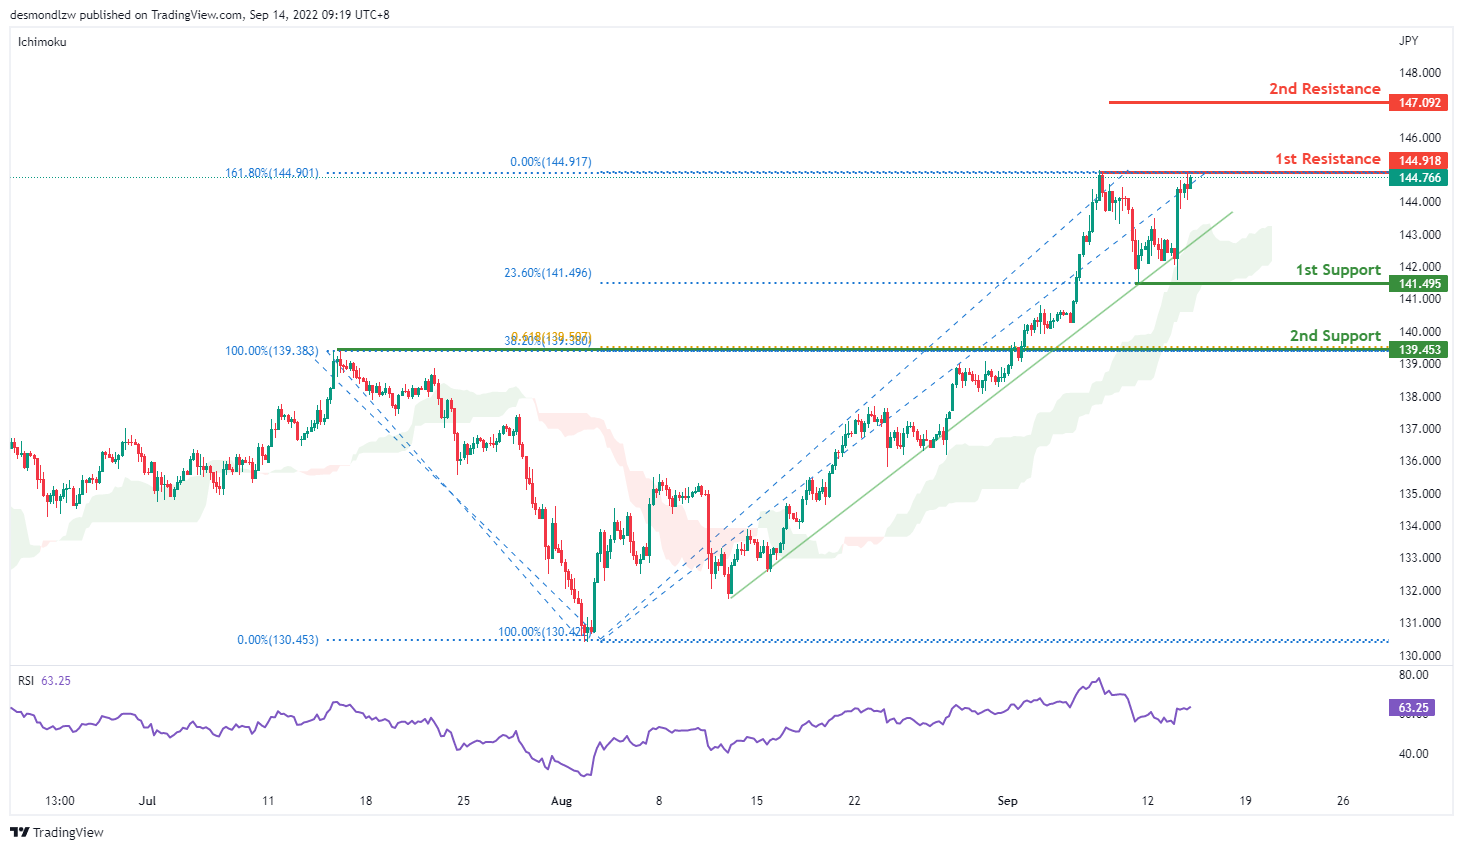
USD/JPY:
On the H4 chart, price is still respecting the ascending channel. We are still bullish bias- Price is testing at the first resistance 144.918 where the 161.8% extension sits. If bullish momentum continues, it should bring price to 147.092 where the previous swing high sits. Alternatively it could pull back to the first support at 141.495 where the 23.6% retracement sits then to the second support at 139.453 where the 38.2% retracement and overlapping support sits.
Areas of consideration:
- H4 time frame, 1st resistance at 144.918
- H4 time frame, 1st support at 141.495
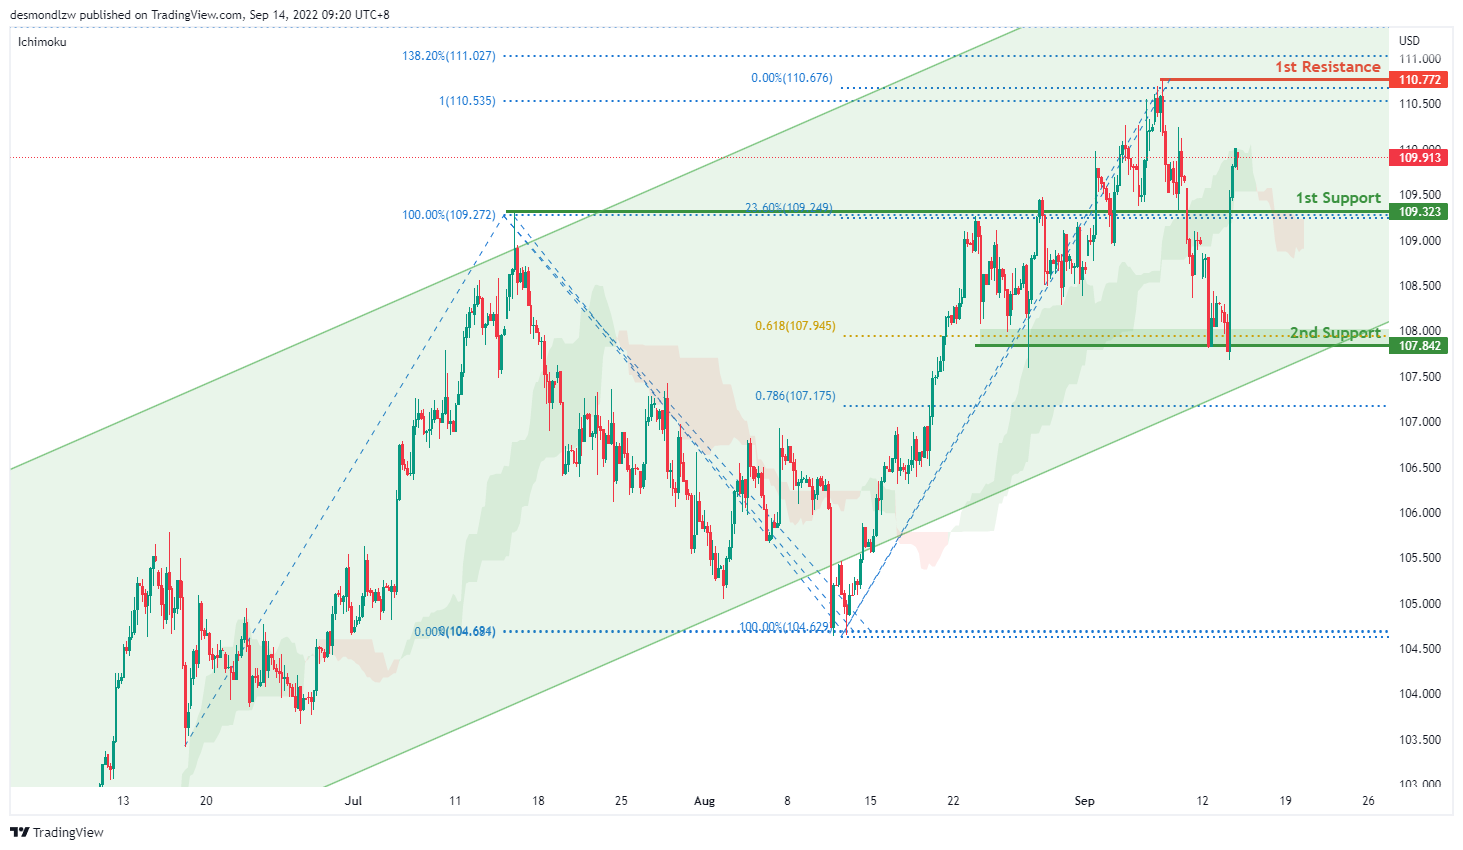
DXY:
On the H4, price is still respecting the bullish channel- we are bullish bias. Price has rebounded off the support level and is moving toward the first resistance at 110.772 levels where the previous swing high sits. Alternatively, price could pull back to test the first support at 109.323 where the 23.6% retracement sits then the second support at 107.842 where the 61.8% projection and previous swing low sits.
Areas of consideration:
- H4 time frame, 1st resistance at 110.772
- H4 time frame, 1st support at 109.323
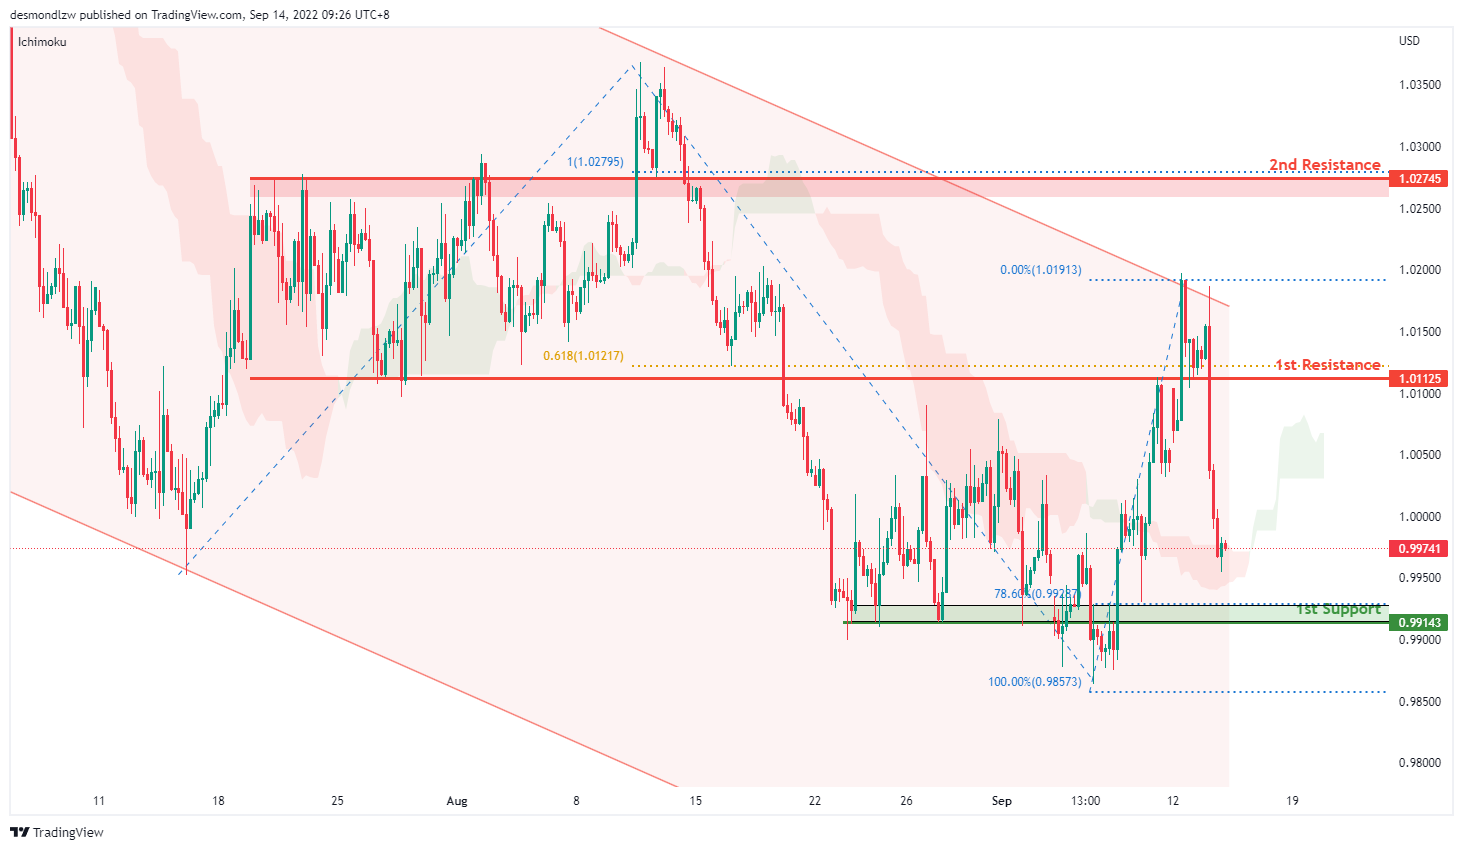
EUR/USD:
On the H4, price is moving within the channel, we are currently bearish bias. Price seems like its moving to the first support at 0.9914 where the 7836% retracement and previous swing low sits. Alternatively, if price pulls back it should test the first resistance at 1.0112 level where the 61.8% projection and previous swing low sits then the second resistance at 1.0274 where the previous swing high sits
Areas of consideration :
- H4 1st resistance at 1.0112
- H4 1st support at 0.9914
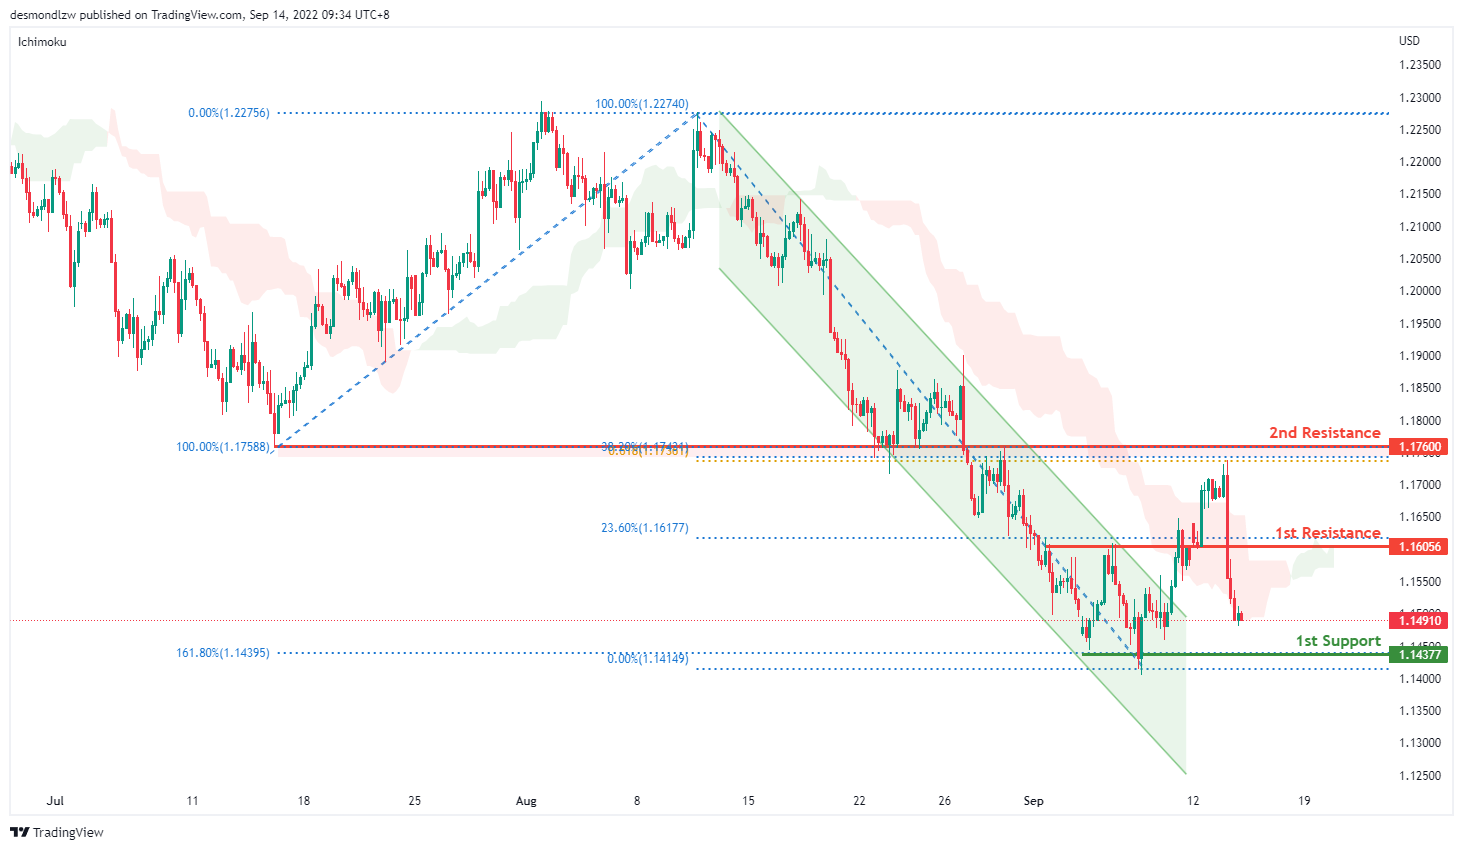
GBP/USD:
On the H4, prices are still moving in a bearish momentum hence we are bearish biassed. Prices seem to be moving toward the first support at 1.1442 where the 161.8% extension and previous swing low sits. Alternatively, price could pull back to test the first resistance at 1.1605 where the 23.6% retracement and overlapping support sits then the second support at 1.1760 where the 38.2% retracement and 61.8% projection sits.
Areas of consideration:
- H4 1st resistance at 1.1605
- H4 1st support at 1.1437
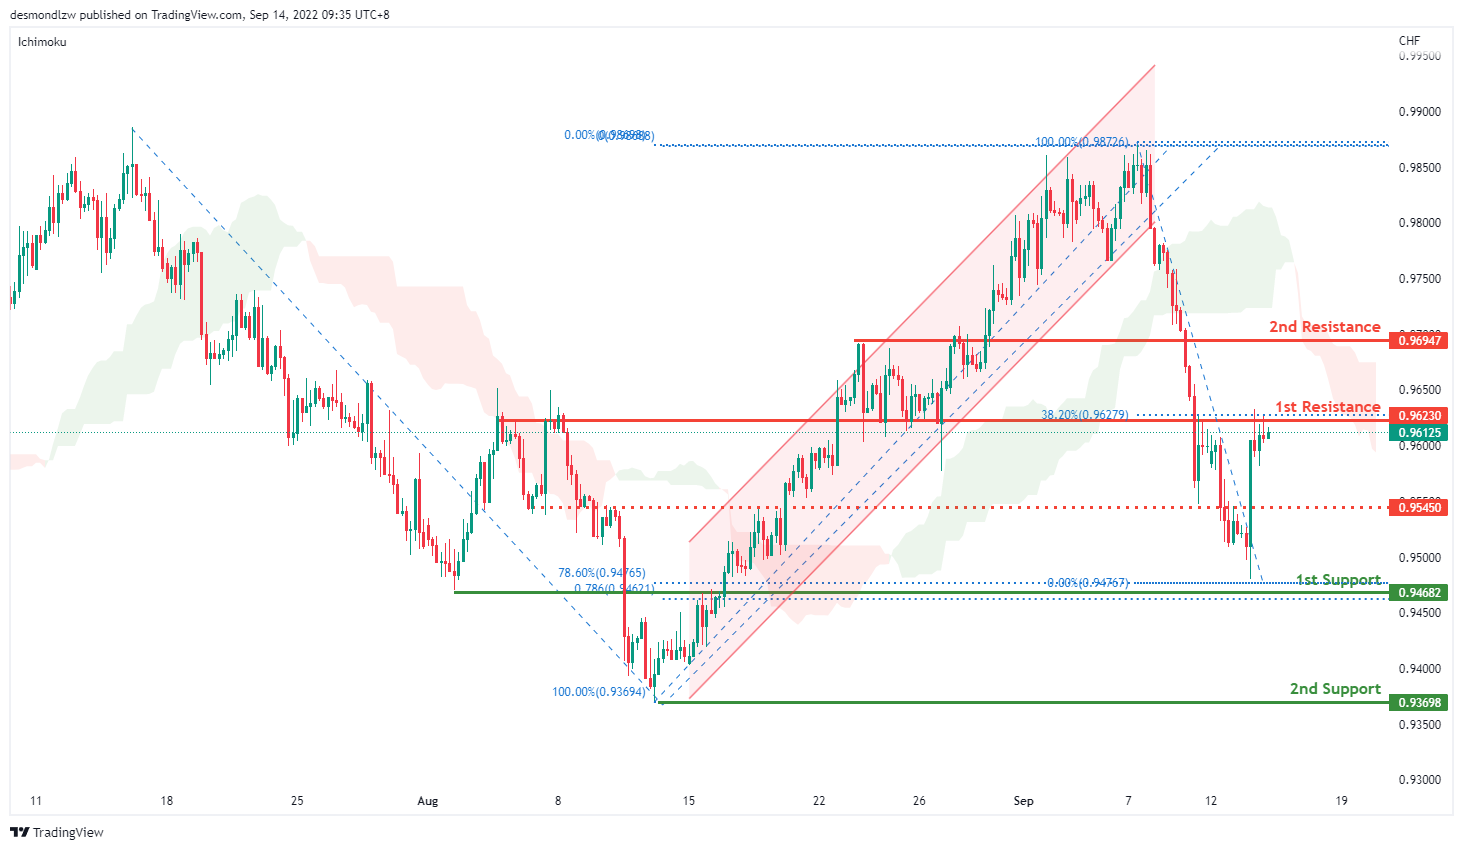
USD/CHF:
On the H4, prices have broken the ascending channel and we are currently bearish bias. Price is testing the first resistance at 0.9623 where the overlapping resistance and 50% retracement sit. If it breaks this level, it might test the second resistance at 0.9694 where the 38.2% retracement sits. Alternatively, price could pull back to test the first support at 0.9468 where the 78.6% retracement sit and then second support at 0.9369 where the previous swing low sits
Areas of consideration
- H4 1st support at 0.9468
- H4 1st resistance at 0.9623
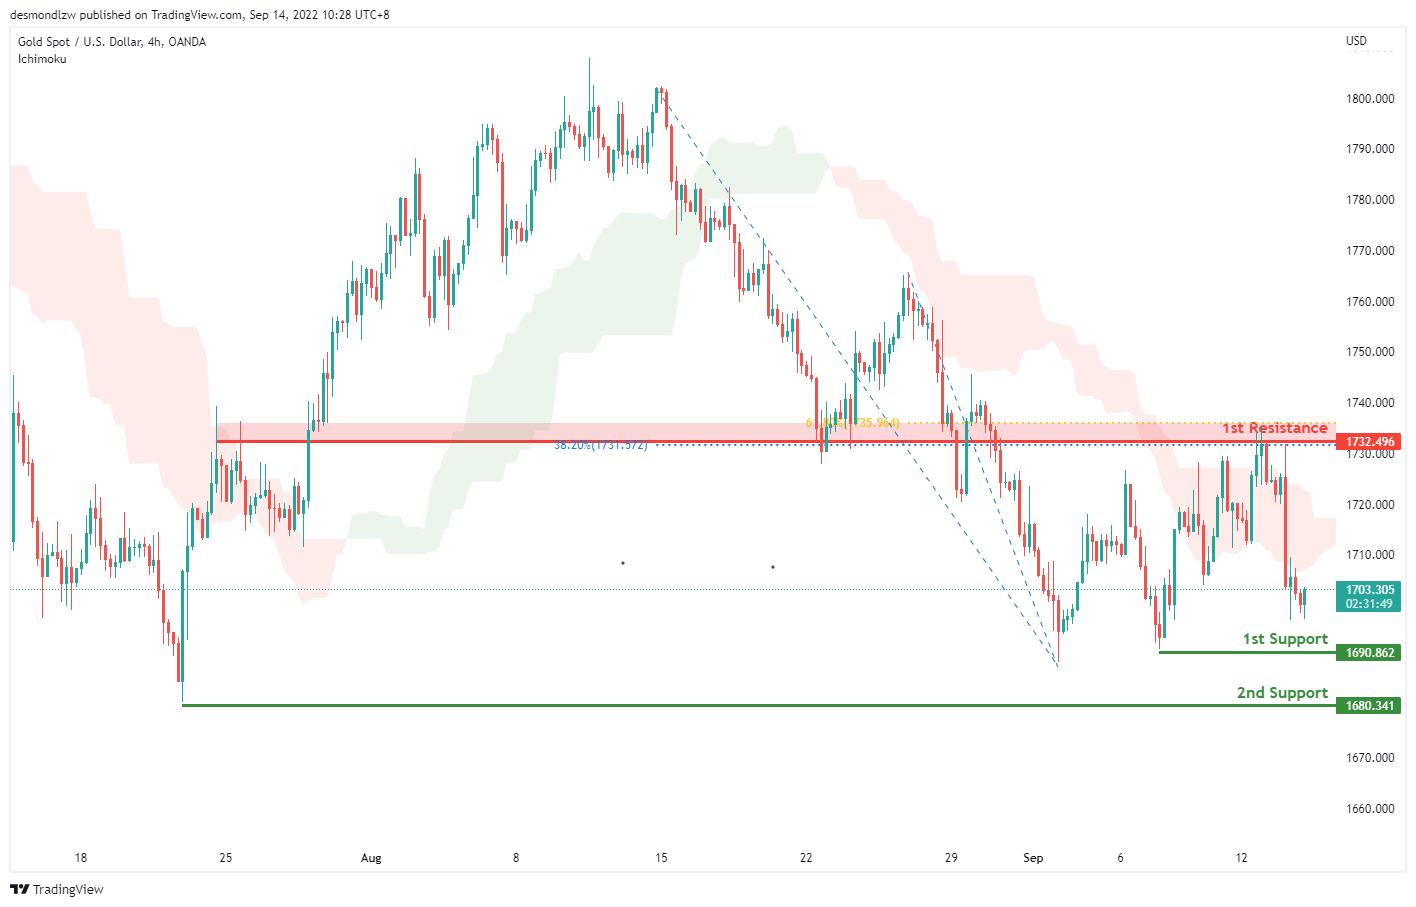
XAU/USD (GOLD):
On the H4, with the price dropping from the 1st resistance and below ichimoku cloud, we have a bearish bias that the price may drop to the 1st support at 1690.862, which is in line with the swing low to the 2nd support at 1680.341, where the previous significant swing low is. Alternatively, the price may rise to the 1st resistance at 1732.496, which is in line with the 61.8% and 38.2% fibonacci retracement and overlap resistance.
Areas of consideration:
- H4 time frame, 1st support at 1690.862
- H4 time frame, 2nd support at 1680.341
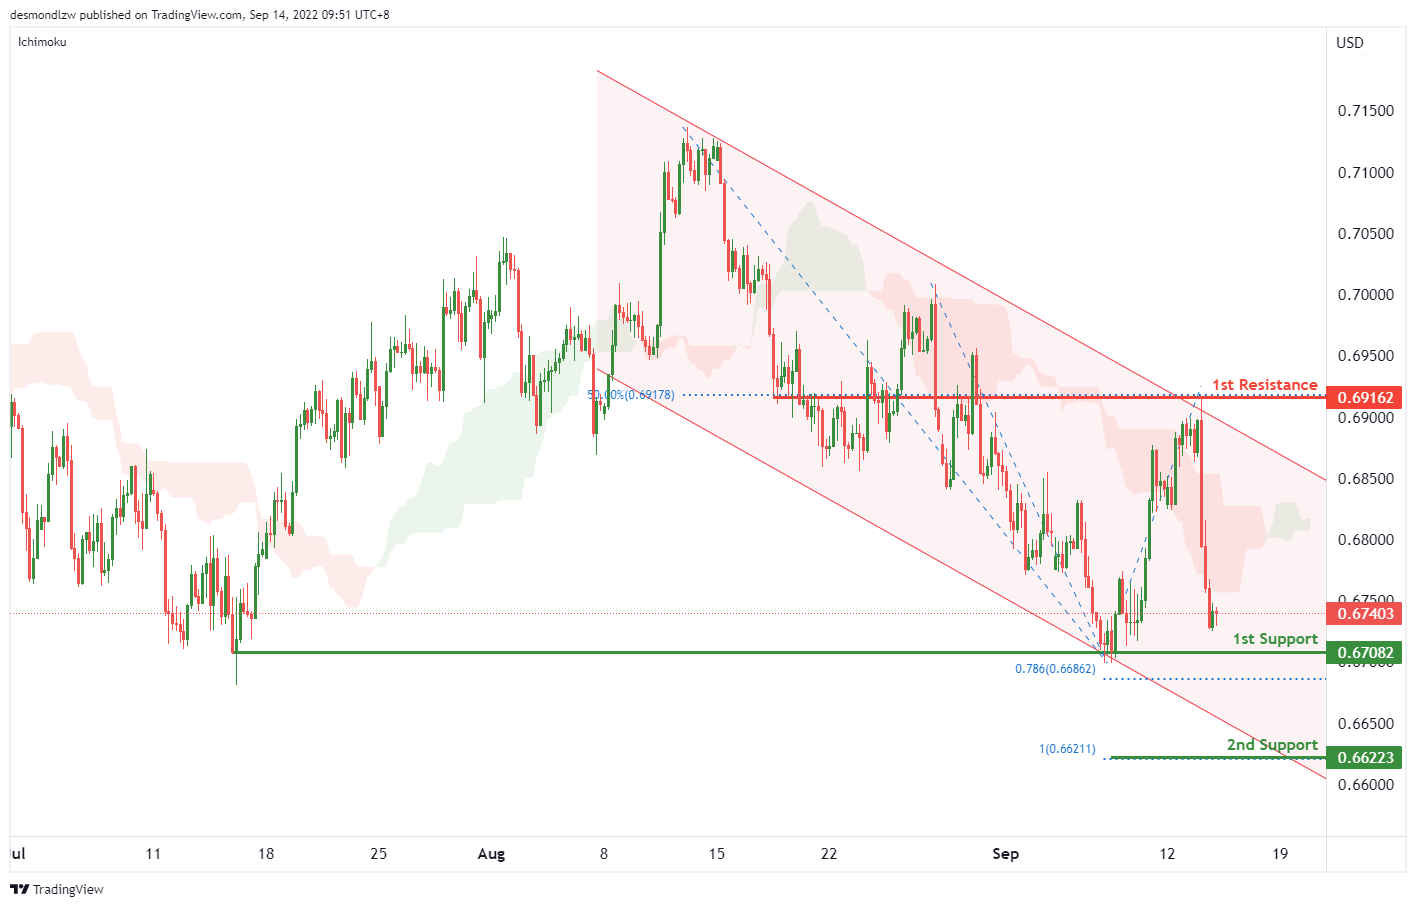
AUD/USD:
On the H4, with the price moving within the descending channel and below ichimoku cloud, we have a bearish bias that the price may drop to the 1st support at 0.67082, which is in line with the previous swing lows and 78.6% fibonacci projection. If the 1st support level is broken, the 2nd support could be at 0.6623, where the 100% fibonacci projection is. Al;ternatively, the price may rise to the 1st resistance at 0.69162, which is in line with the 50% fibonacci retracement and swing high.
Areas of consideration
- H4 1st support at 0.67082
- H4 2nd support at 0.6623
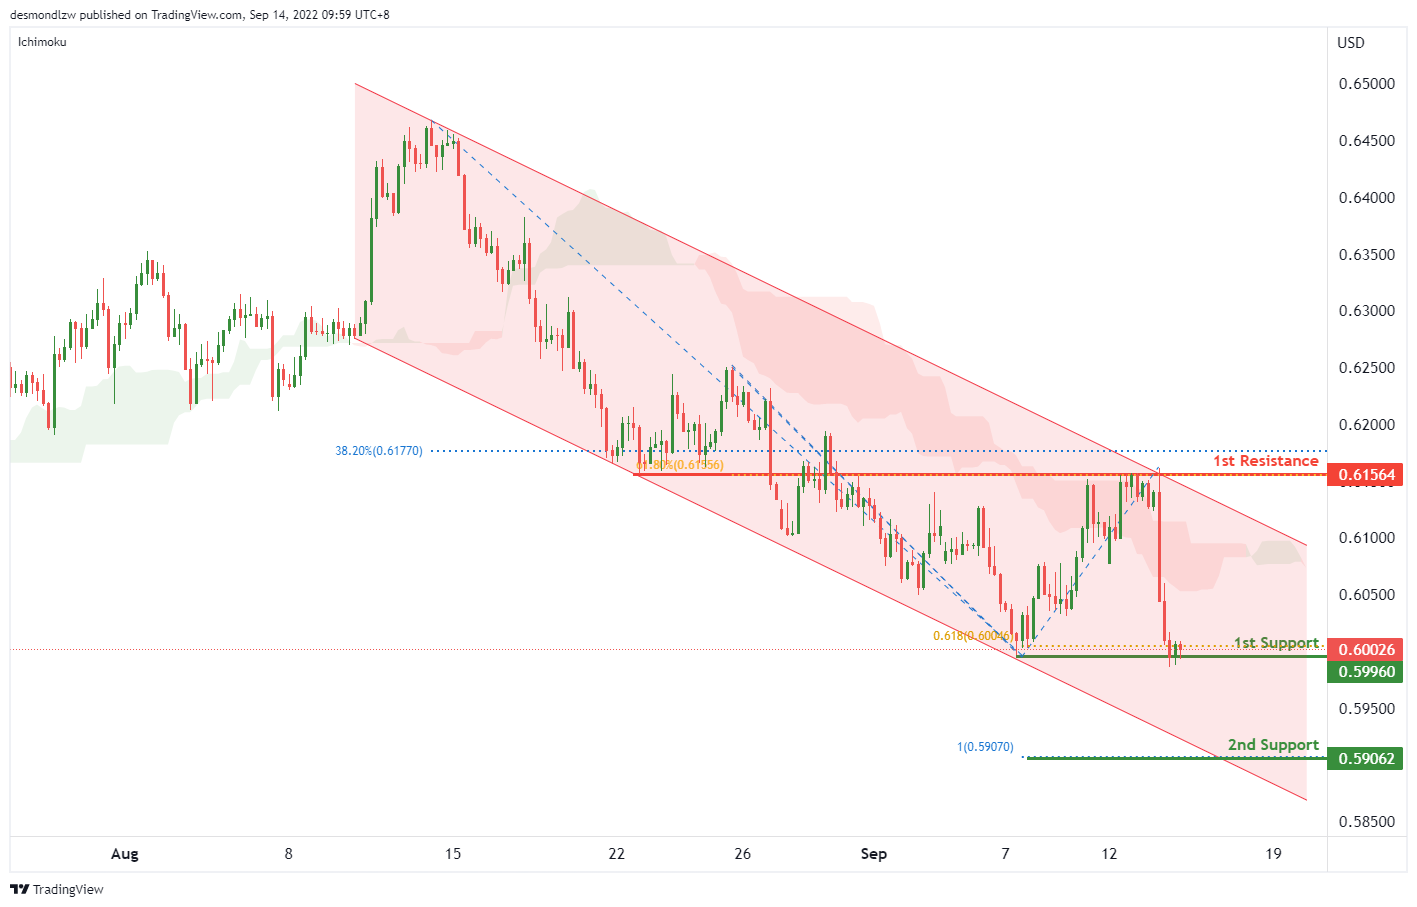
NZD/USD:
On the H4, with the price moving within the descending channel and below ichimoku cloud, we have a bearish bias that the price may drop from the 1st support at 0.59960, which is in line with the swing low and 61.8% fibonacci projection to the 2nd support at 0.59062, where the 100% fibonacci projection is. Alternatively, the price may rise to the 1st resistance at 0.61564, which is in line with the overlap resistance, 61.8% fibonacci retracement and 38.2% fibonacci retracement.
Areas of consideration:
- H4 time frame, 1st support at 0.59960
- H4 time frame, 2nd support at 0.59062
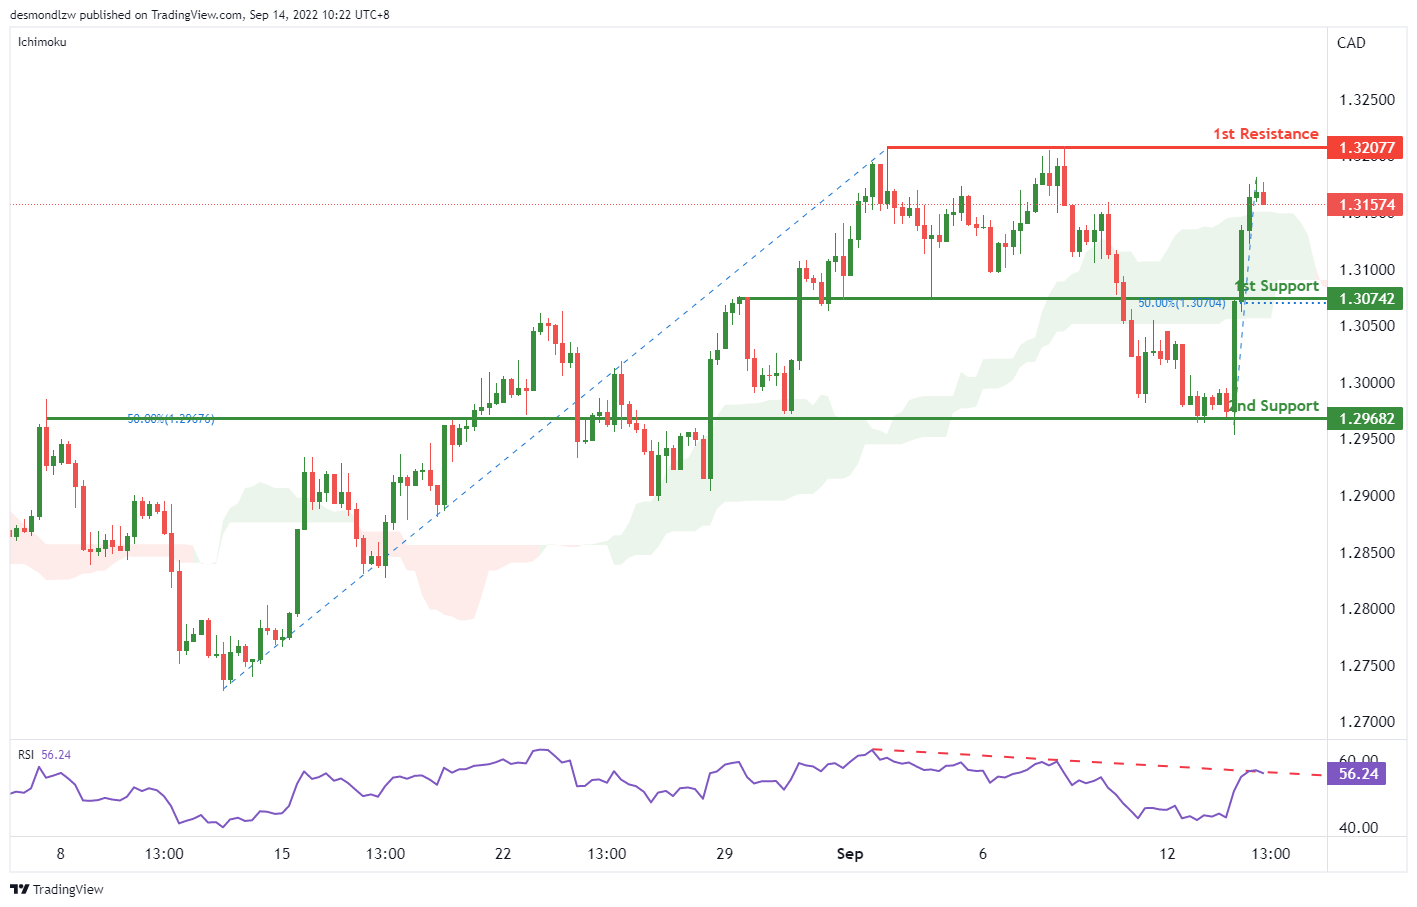
USD/CAD:
On the H4, the price is rising from the 2nd support and breaking the ichimoku cloud, if the price continues rising, the next resistance level could be at 1.32077, which is in line with the previous swing high. Alternatively, as the RSI is testing the descending trendline, the price may pull back and drop to the 1st support at 1.30742, which is in line with the 50% fibonacci retracement and overlap support. If the 1st support is broken, the next support level could be at 1.29682, where the 50% fibonacci retracement and overlap support are.
Areas of consideration:
- H4 time frame, 1st resistance at 1.30277
- H4 time frame, 1st support at 1.30742
OIL:
On the H4, with price below ichimoku and breaking the ascending trendline, we have a bearish bias that the price may drop to the 1st support at 93.239, where the overlap resistance and 38.2% fibonacci retracement are. If the price can break this resistance level, the next support level could be at 88.332, which is in line with the swing low. Alternatively, the price may rise to the 1st resistance at 98.753, which is in line with the 61.8% fibonacci retracement and overlap resistance. Take note the intermediate resistance could be at 96.188, which is in line with the 78.6% fibonacci retracement.
Areas of consideration:
- H4 time frame, 1st resistance at 98.753
- H4 time frame, 1st support at 93.235

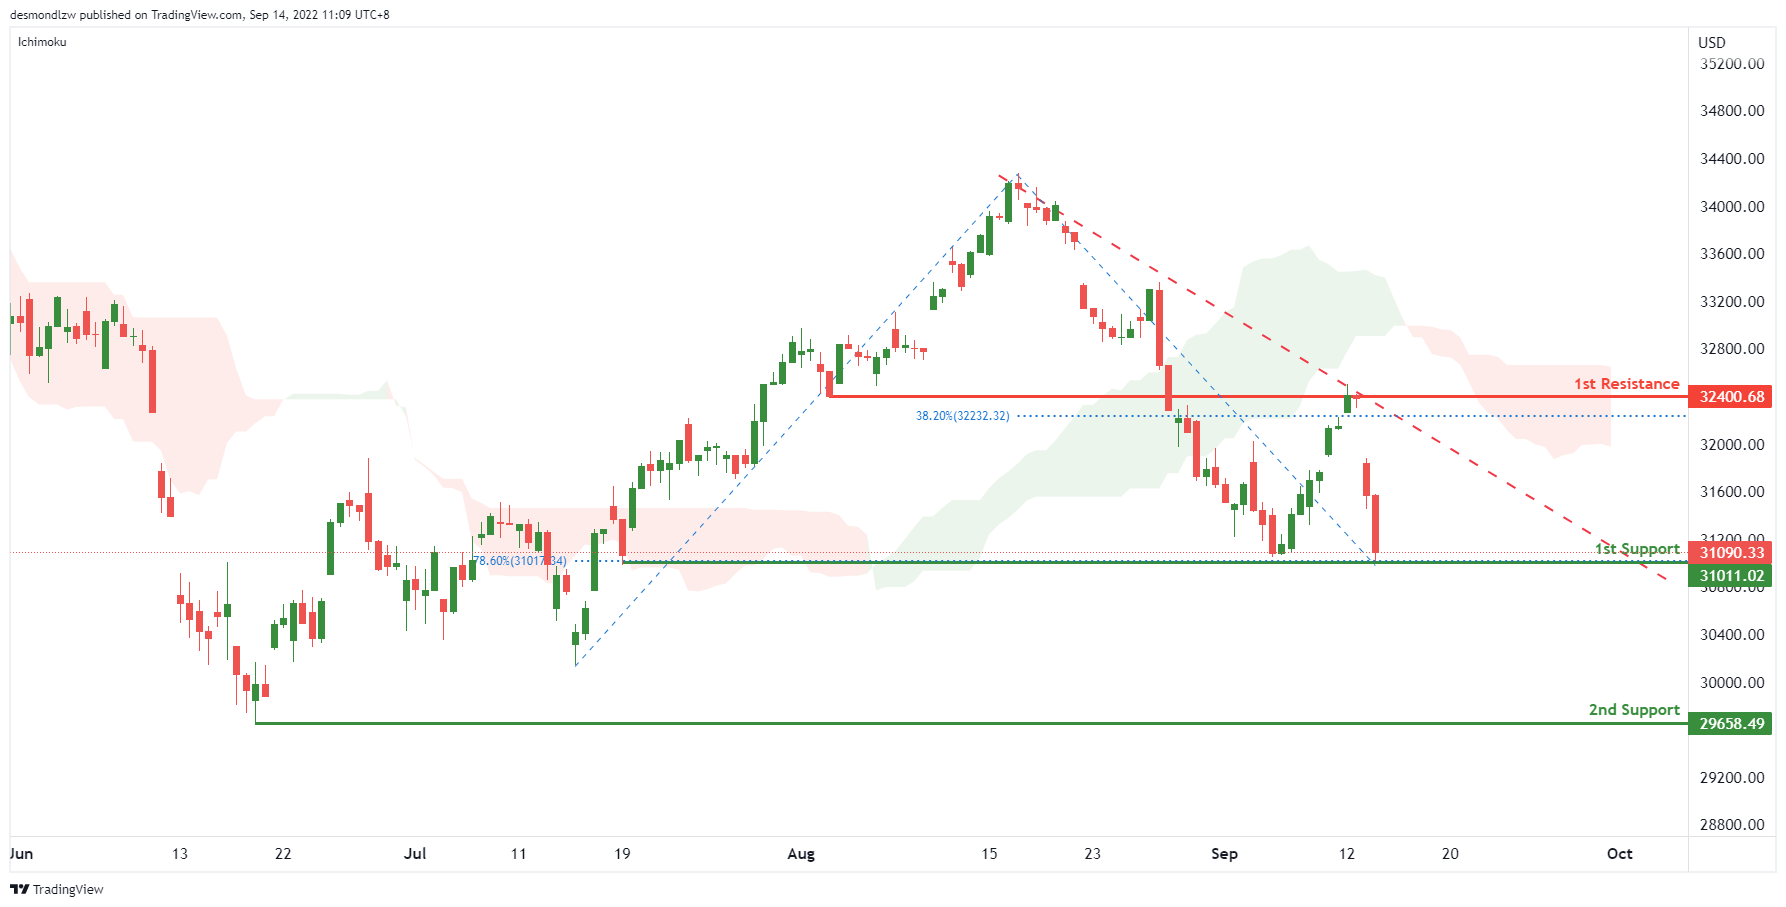
Dow Jones Industrial Average:
On the H4, with price moving within the descending trendline and below ichimoku cloud, we have a bearish bias that the price may drop to the 1st support at 31011.02, where the pullback support and 78.6% fibonacci retracement are . If the 1st support is broken, the 2nd support could be at 29658.49, which is in line with the swing low. Alternatively, the price may break the descending trendline and rise to the 1st resistance at 32400.68, which is in line with the overlap resistance and 38.2% fibonacci retracement.
Areas of consideration:
- H4 time frame, 1st support at 31011.02
- H4 time frame, 2nd support at 29658.49
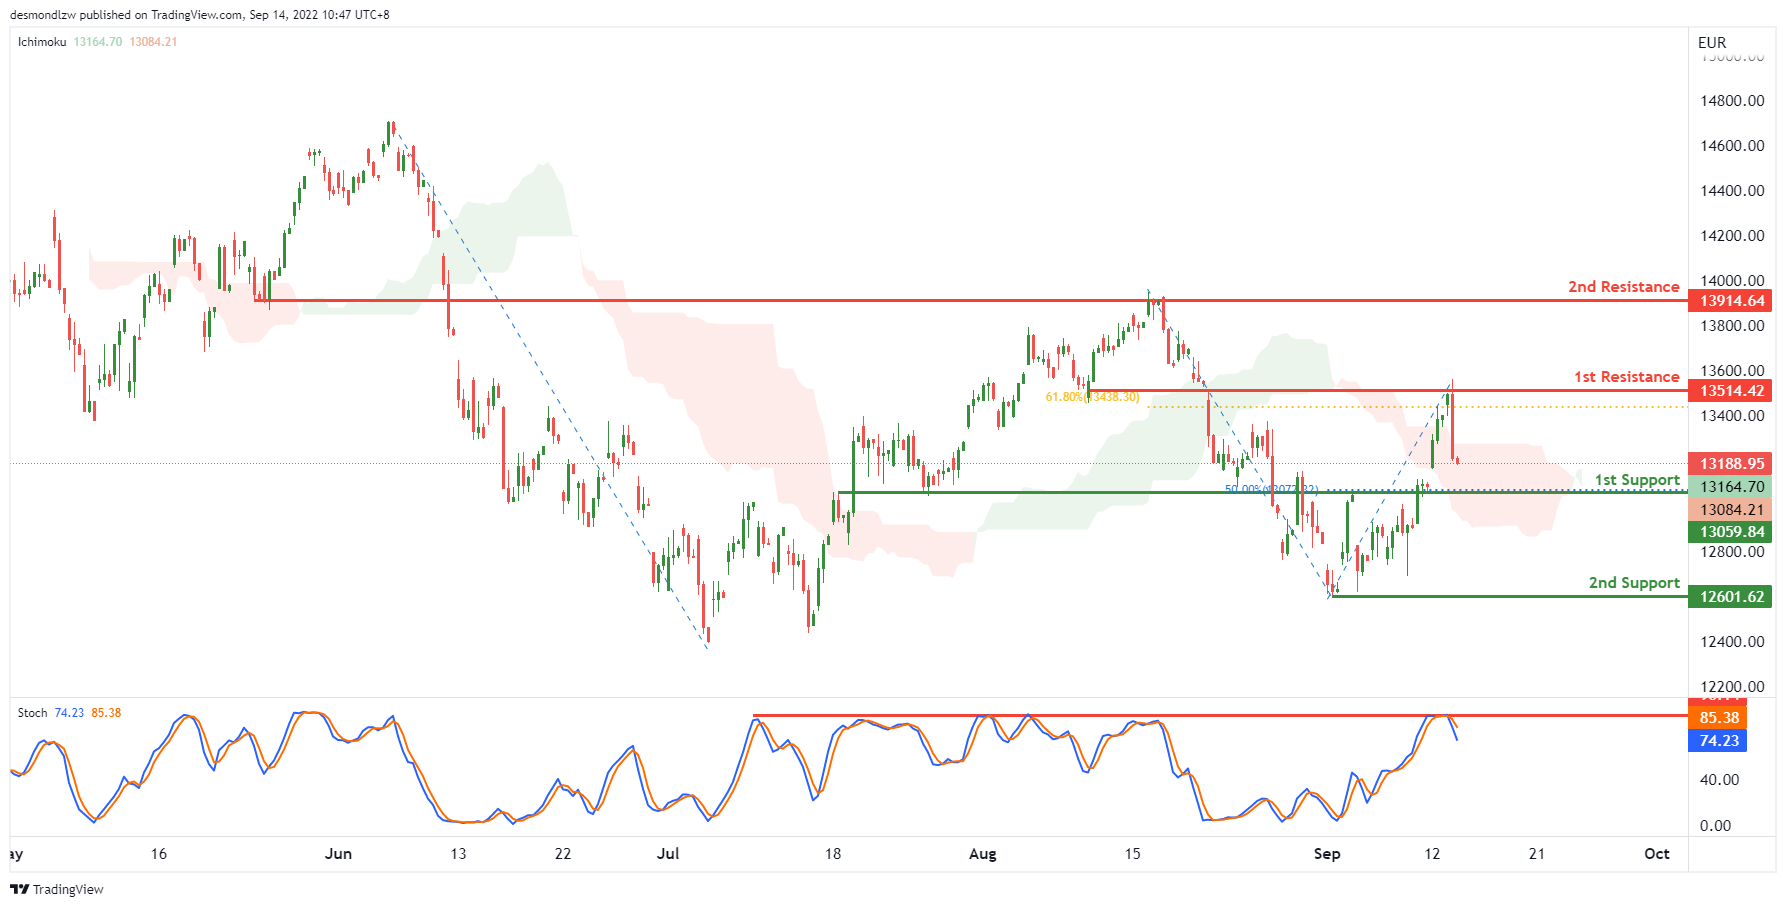
DAX:
On the H4, with the stoch is pulling back from the resistance at 85.38, and price is breaking the ichimoku cloud, we have a bearish bias that the price may drop to the 1st support at 13059.84, which is in line with the 50% fibonacci retracement and overlap support. If the 1st support is broken, the next support could be at 12601.62, which is in line with the swing low. Alternatively, the price may rise to the 1st resistance at 13514.42, which is in line with the overlap resistance and 61.8% fibonacci retracement.
Areas of consideration:
- H4 time frame, 1st support at 13059.84
- H4 time frame, 2nd support at 12601.62
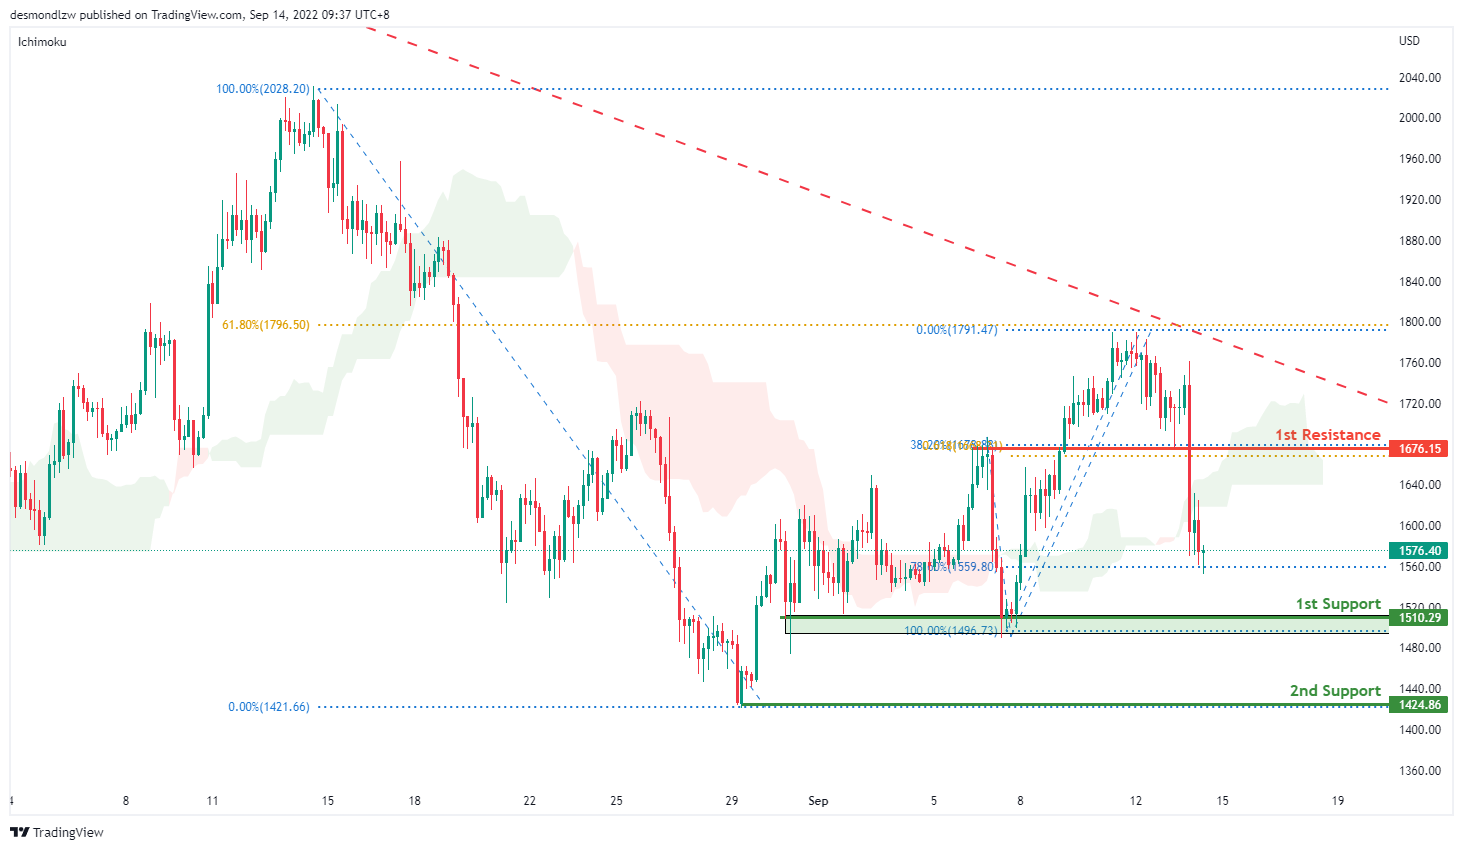
ETHUSD:
On the H4, price look like it has pulled back slightly hence we are currently bearish bias. Price look like it’s moving toward the first support at 1510.29 where the 100% projection sits. If bearish momentum continues it should bring price to the second support at 1424.86 where the previous swing low sits. Alternatively price could bounce back to test the first resistance at 1676.15 where the 38.2% retracement at 61.8% projection sits
Areas of consideration:
- H4 time frame, 1st resistance of 1676.15
- H4 time frame, 1st support at 1510.29
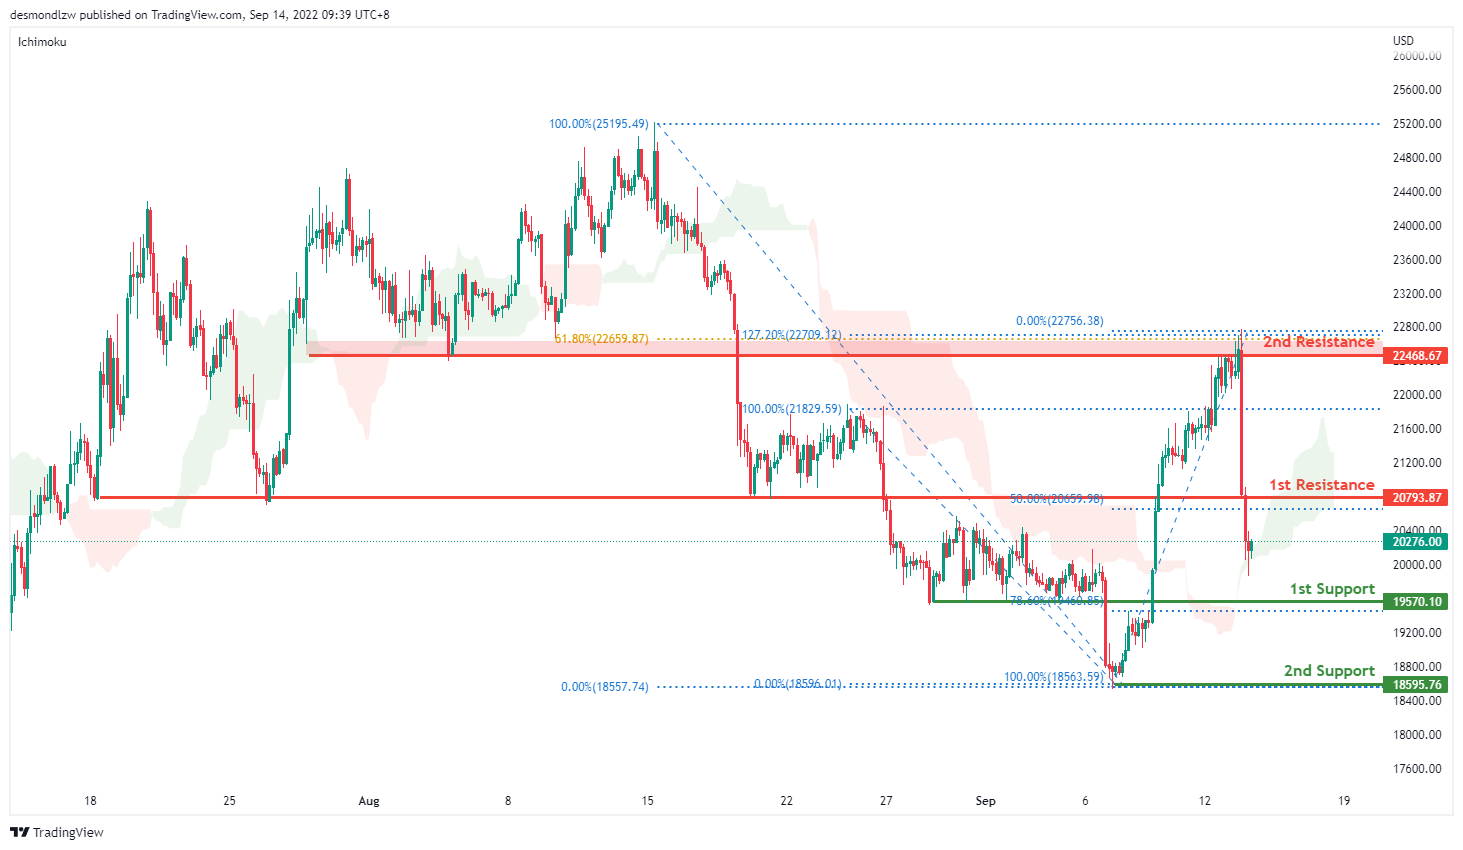
BTCUSD:
On the H4, price is moving in a bearish momentum hence we are bearish. Price is moving toward the first support at 19570.10 where the 78.6% retracement sits. If bearish momentum continues, it should bring price to the second support 18595.76 where the previous swing low sits. Alternatively, price could pull back to test the first resistance at 20793.87 where the 50% retracement and previous swing low sits then the second resistance at 22468.67 where the 61.8% retracement and 127.2% extension sits
Areas of consideration:
- H4 time frame, 1st resistance of 20793.87
- H4 time frame, 1st support at 19570.10
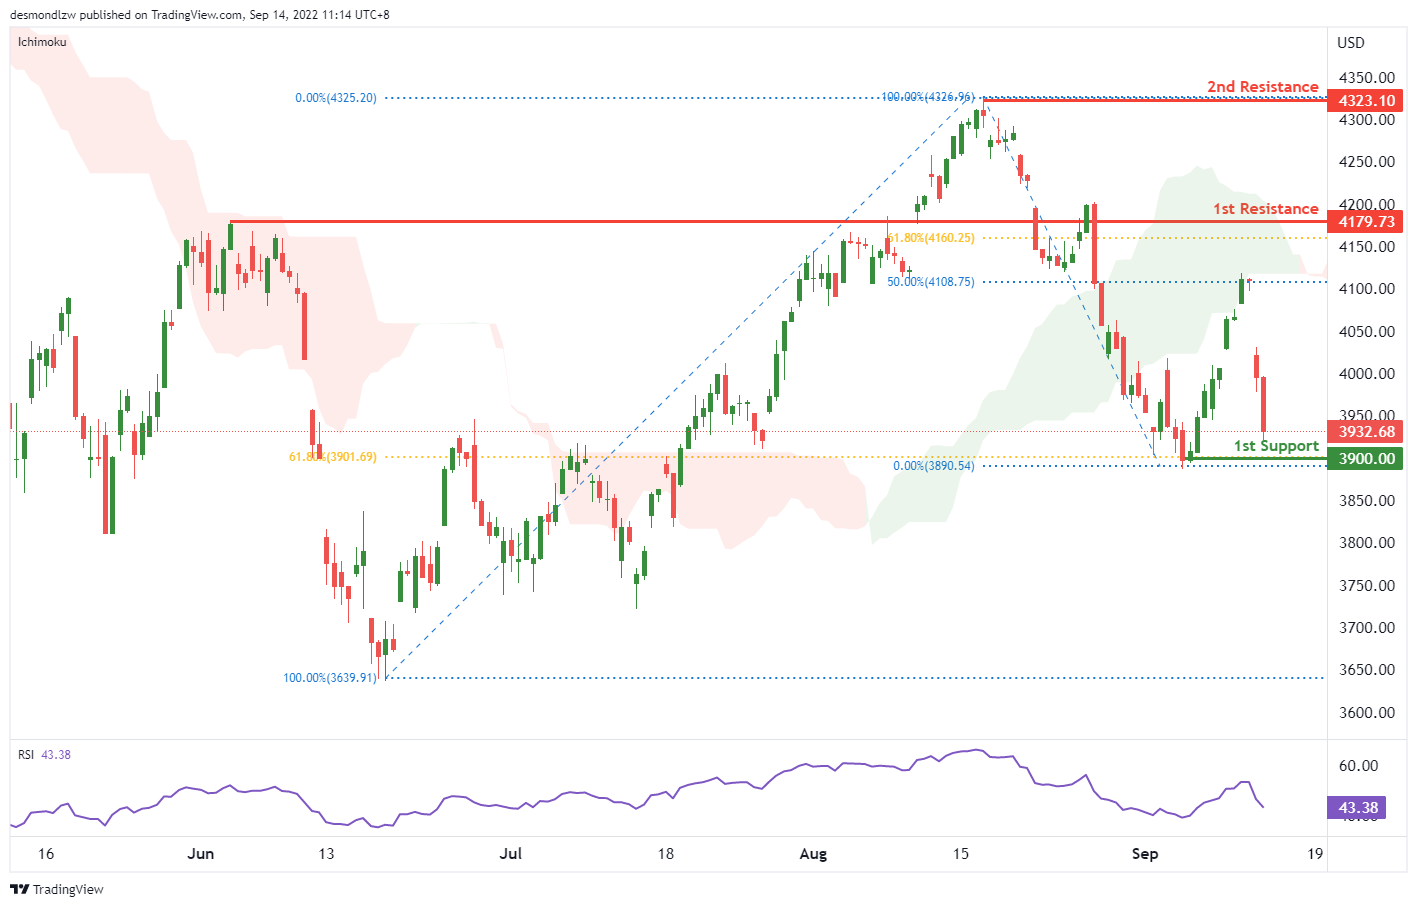
S&P 500:
On the H4, price reversed from the 4100 price area forming a bearish channel, with price falling towards the 1st support of 3900. With our bearish bias still valid, as price trades below the ichimoku indicator, look for price to test the pullback support and the 61.8% fibonacci retracement. If price breaks below the support level, price could fall towards the 2nd support of 3648.55 where swing low is. As price falls towards the 2nd support, it could find some brief consolidation at the 78.6% fibonacci retracement pullback support area.
Areas of consideration:
- H4 time frame, 1st support at 3900
- H4 time frame, 2nd support at 3648.55


