
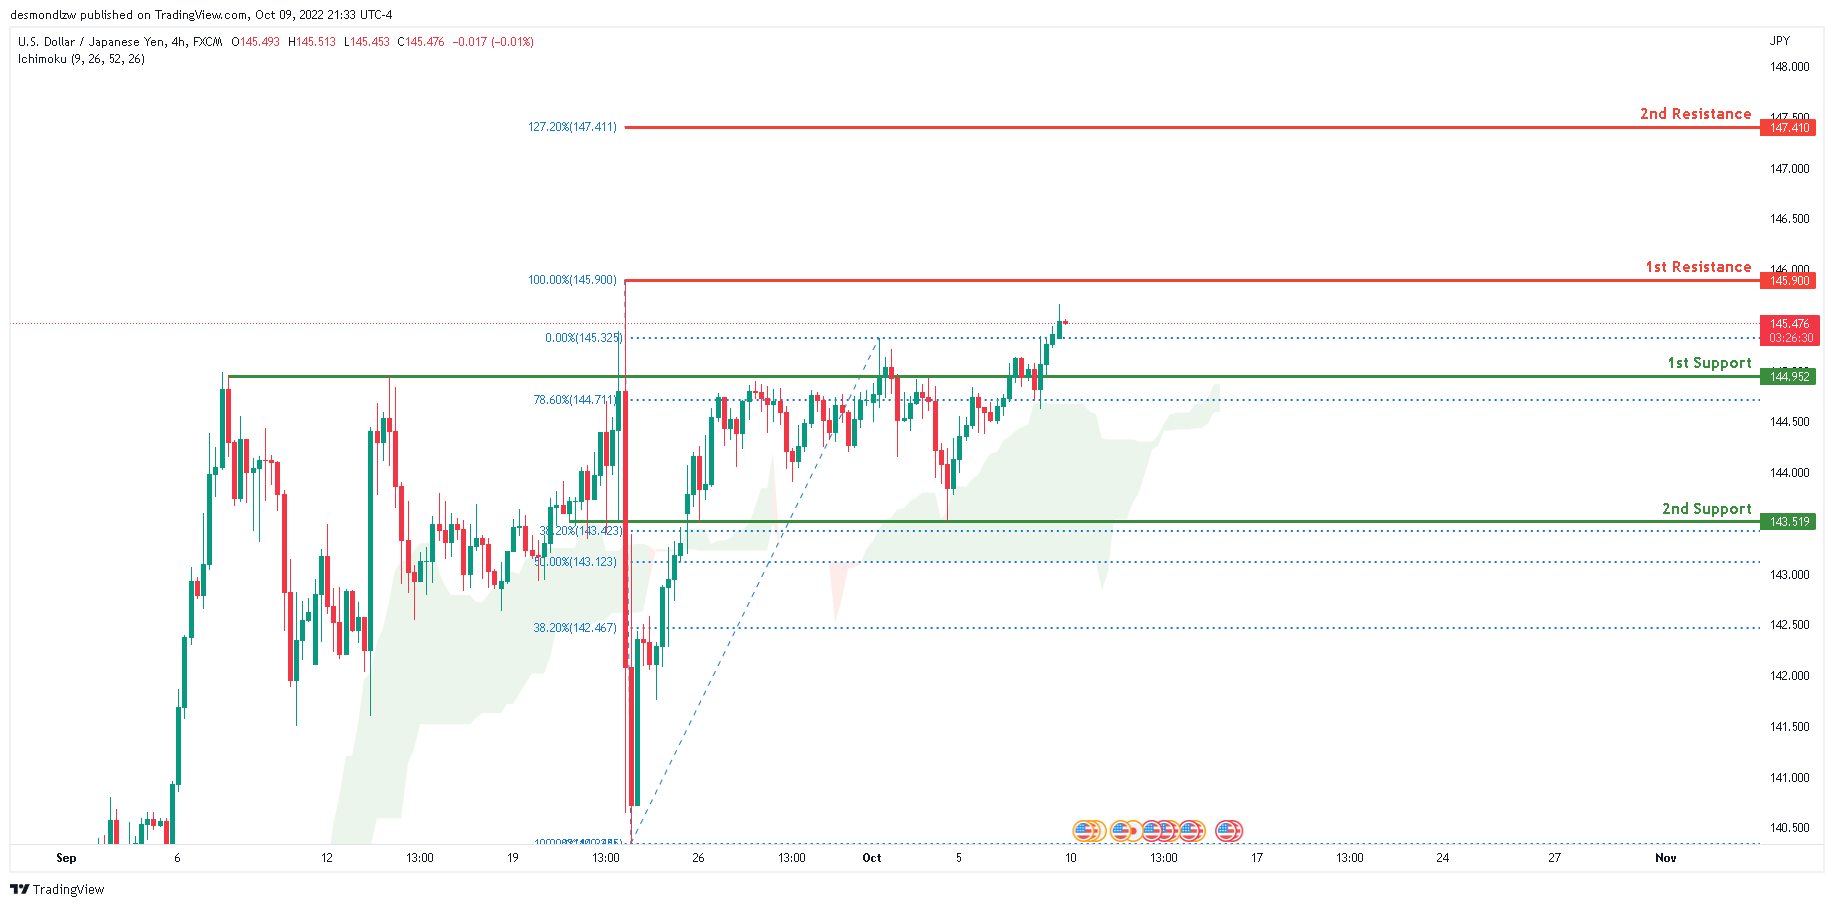
USD/JPY:
Price is in a bullish trend on the H4 chart. To add to this bias, the price is above the Ichimoku cloud, indicating a bullish trend. Price closed above the first support level at 144.952, which is also the key 145 level. Price is expected to go towards the first resistance level around 145.900, where the 100% Fibonacci line is placed.
Areas of consideration:
- H4 time frame, 1st resistance at 145.900
- H4 time frame, 1st support at 144.952
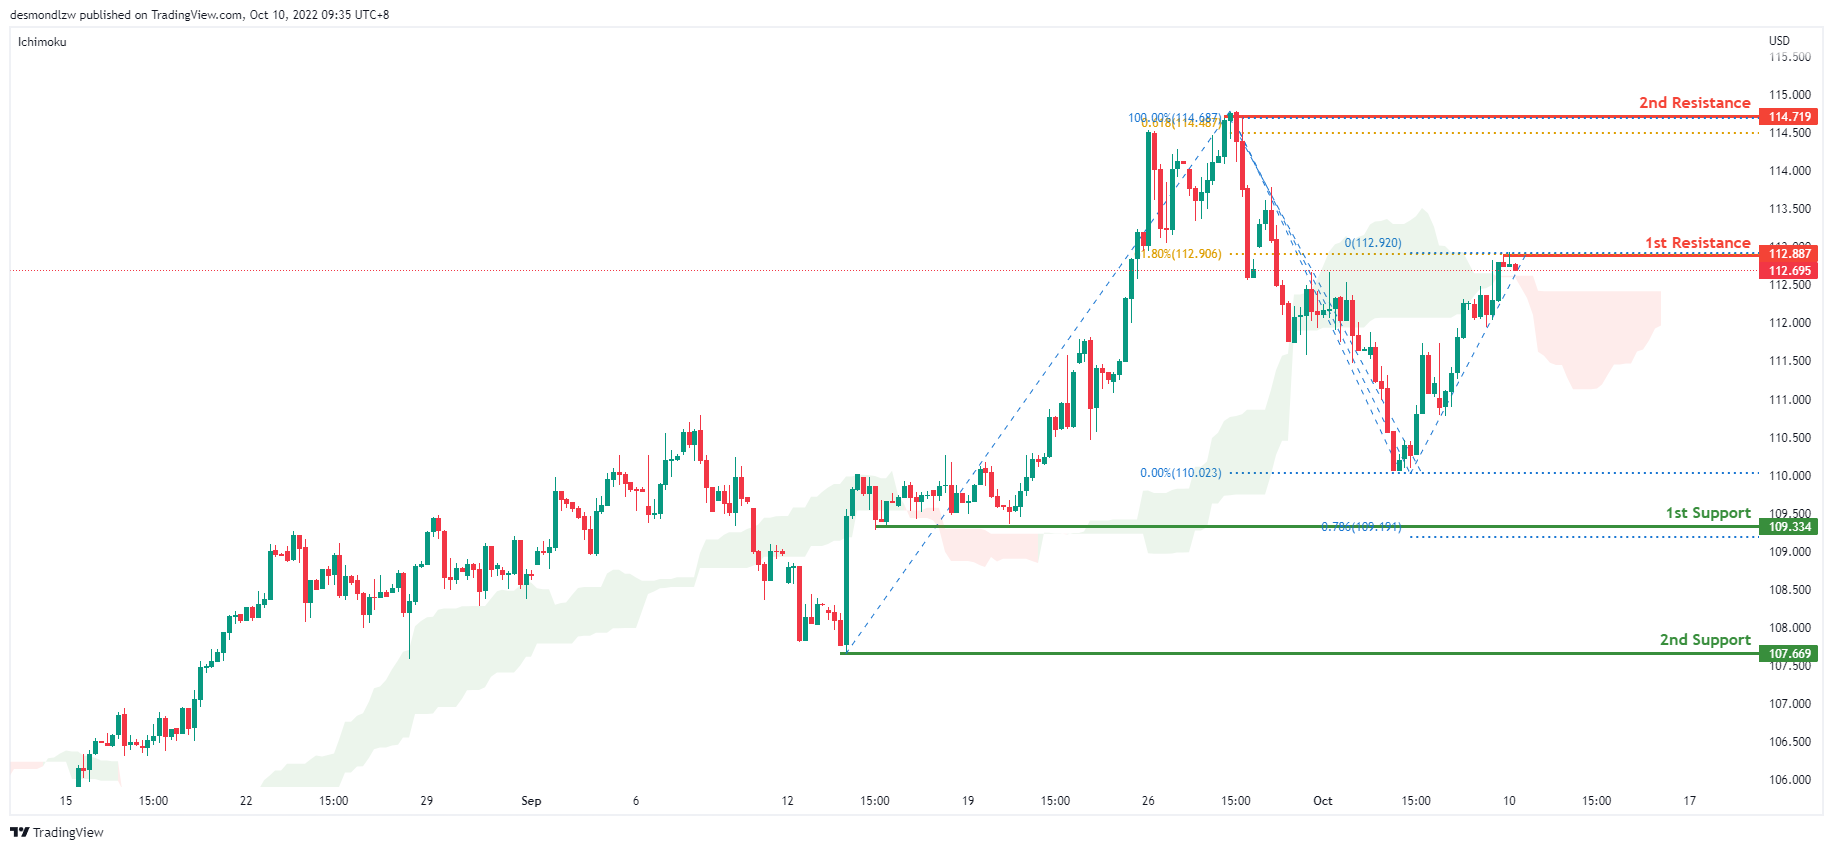
DXY:
On the H4 chart, prices are moving in an ascending trend signalling slight bullish momentum. It is currently testing the first resistance at 112.887 where the 61.8% retracement sits. If it breaks this level, price will move to the second resistance at 114.719 where the previous swing high sits. Alternatively, prices could test the first support at 109.334 where the 78.6% projection sits and if it breaks this level, bearish momentum will bring price to secdon support at 107.669
Areas of consideration:
- H4 time frame, 1st resistance at 112.887
- H4 time frame, 1st support at 109.334
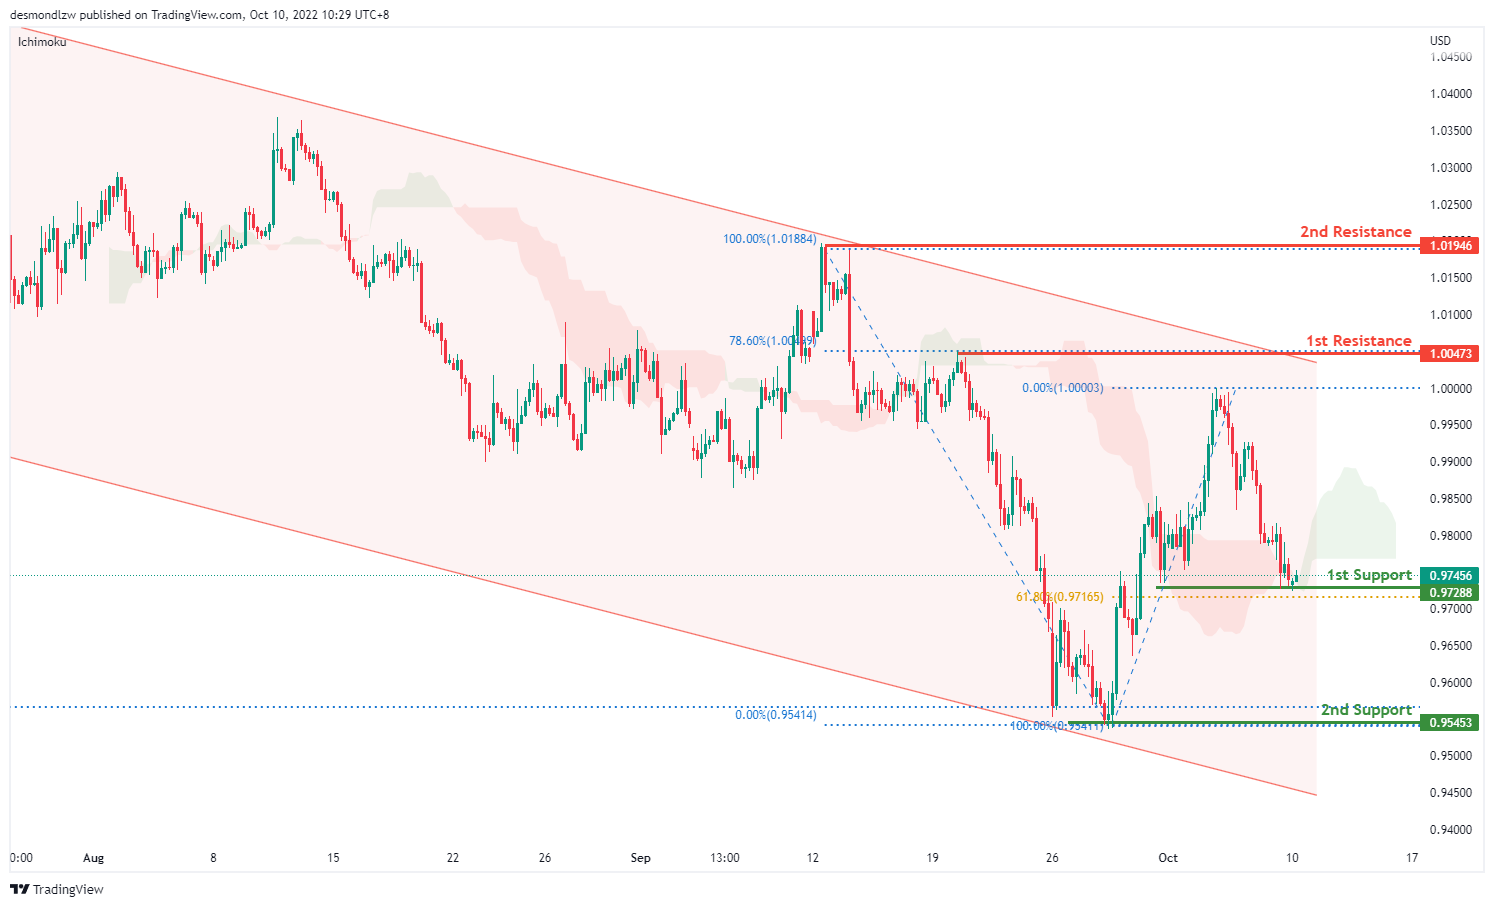
EUR/USD:
On the H4, price is moving within the descending trendline in a descending manner, with the price moving below ichimoku cloud,- we are bearish biased. Price is testing the first support at 0.9728 where the 61.8% retracement sits. If it breaks this level, bearish momentum will bring price to the second support at 0.9545 where the swing low and 161.8% extension sit. Alternatively, price may test the first resistance at 1.0047 where the 78.6% retracement sits. If price breaks this level, it may test the second resistance at 1.0194, where the previous swing high sits
Areas of consideration :
- H4 1st resistance at 1.0047
- H4 2nd resistance at 1.0194
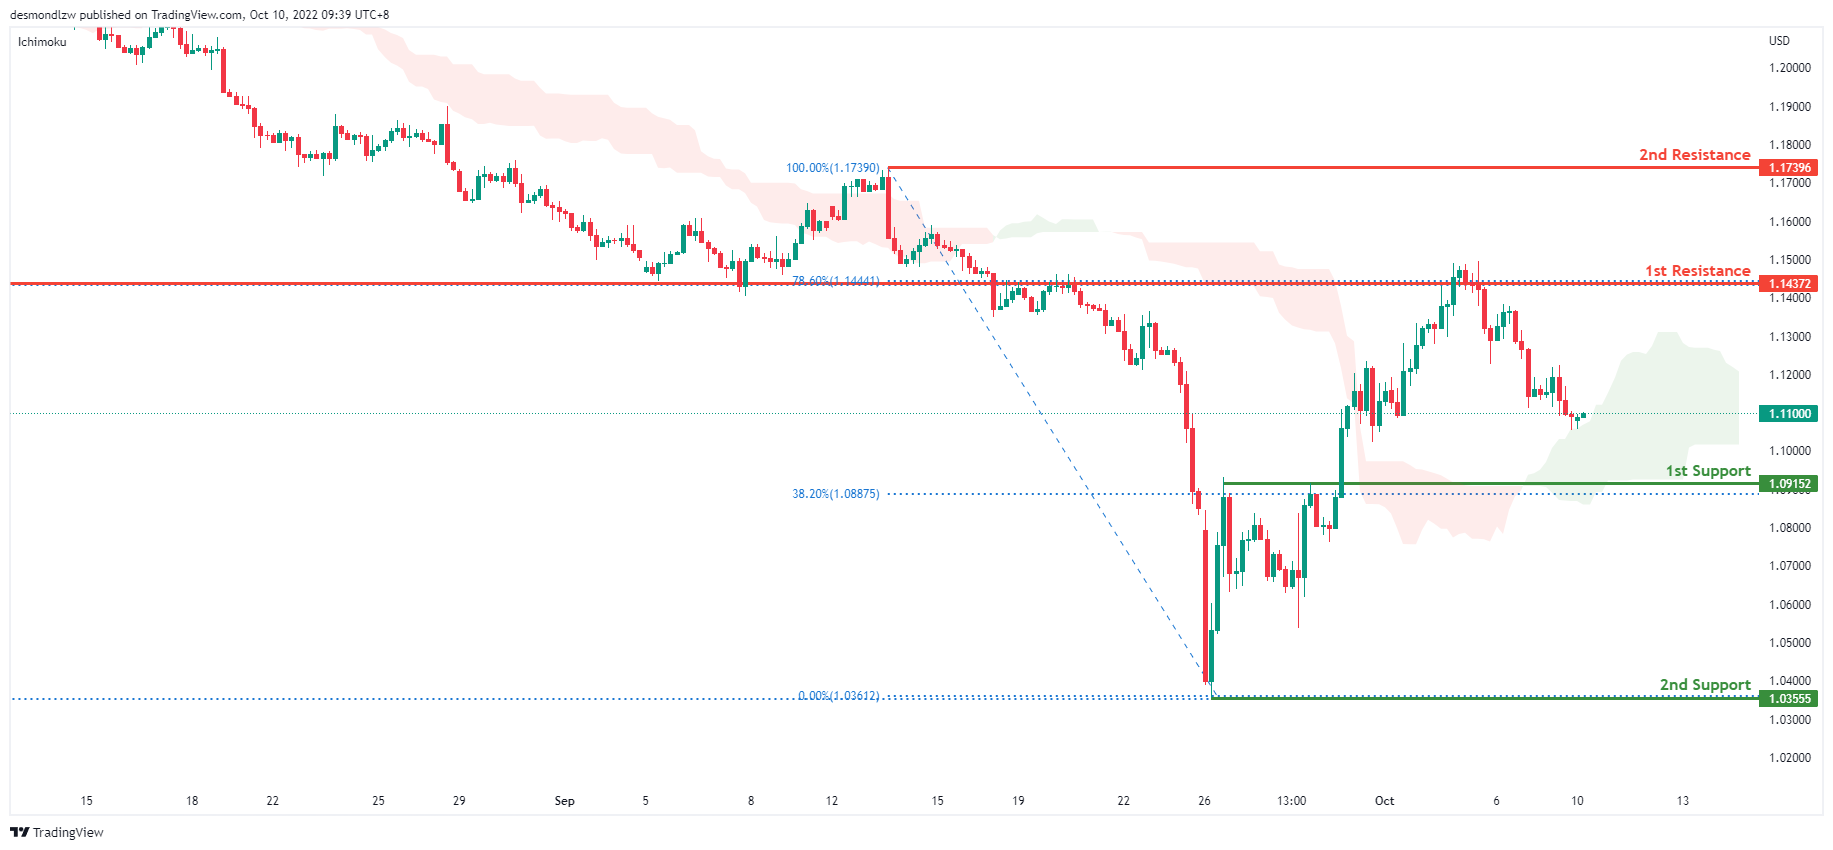
GBP/USD:
On the H4, price has rejected the first resistance and is moving in a descending trend hence we are bearish bias- price might break the ichimoku to test the first support at 1.0915 where the 38.2% retracement sits. If it breaks this level, bearish momentum will bring price to the second support at 1.0055 where the previous swing low sits. Alternatively price can test the first resistance at 1.1437 where the 78.6% retracement and overlap resistance sit. Subsequently the second resistance at 1.1739
Areas of consideration:
- H4 1st support at 1.0915
- H4 1st resistance at 1.1437
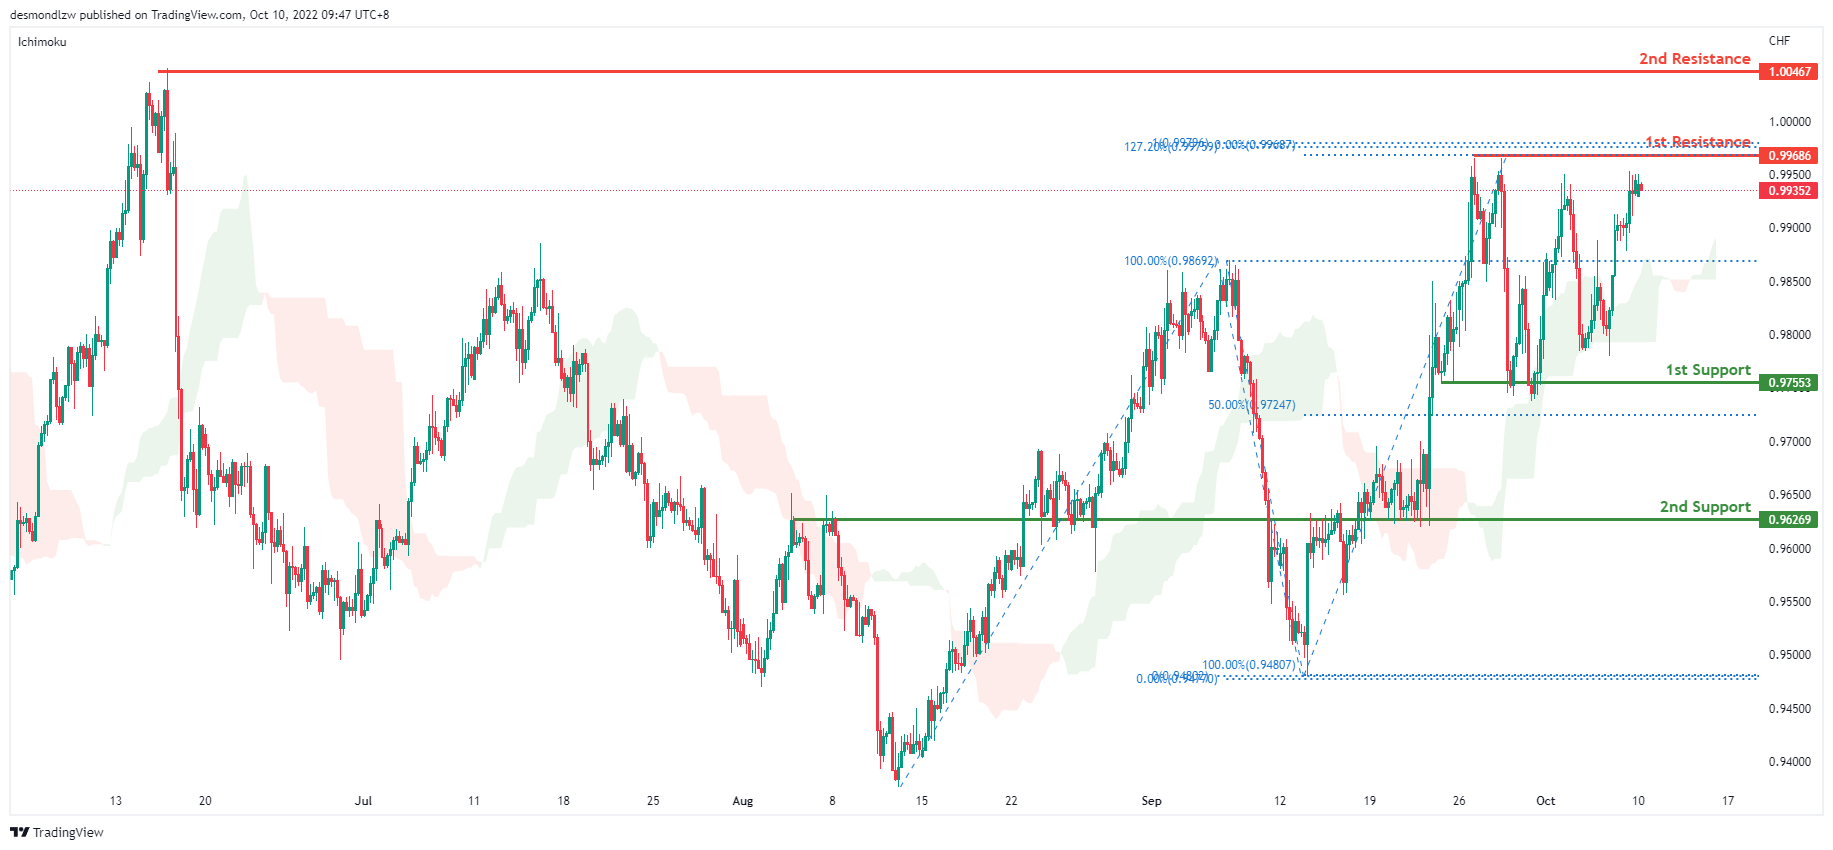
USD/CHF:
USDCHF is in a strong bullish trend on the H4 chart. Price is trading above the Ichimoku cloud signaling a bullish trend. Price look like its moving toward the first resistance 0.9968 where the 127.2% extension and previous swing high sit. If it breaks this level, bullish momentum will bring price to the second resistance at 1.0046 where the previous swing high sit. Alternatively price can test the first support at 0.9755 where the swing low sits then the second support at 0.9626 where the overlap support sits
Areas of consideration
- H4 1st support at 0.9755
- H4 1st resistance at 0.9968
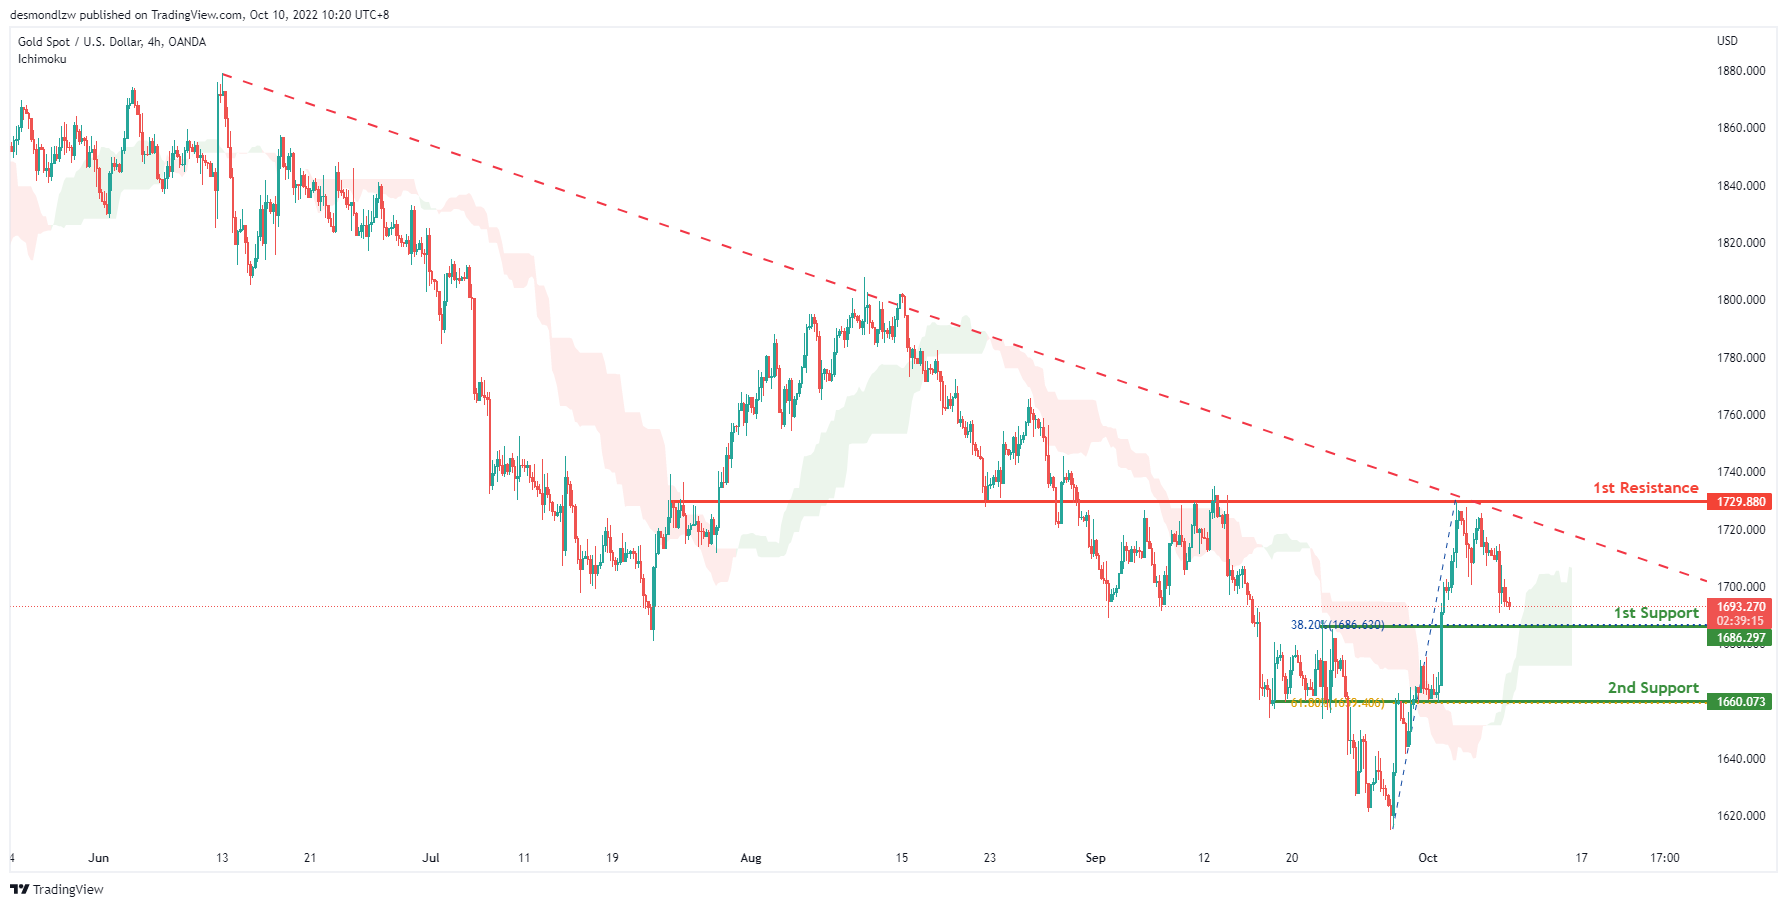
XAU/USD (GOLD):
On the H4, price is dropping from 1st resistance, as the price is below long term descending trendline, we can expect the price to test the 1st support at 1686.297, which is in line with the 38.2% fibonacci retracement and previous swing high. If the 1st support is broken, the 2nd support is at 1660.073, where the previous swing lows and 61.8% fibonacci retracement sits. Alternatively, as the price is above ichimoku cloud, we can expect the price to rise to the 1st resistance at 1729.880, where the overlap resistance is.
Areas of consideration:
- H4 time frame, 1st support at 1686.297
- H4 time frame, 2nd support at 1660.073
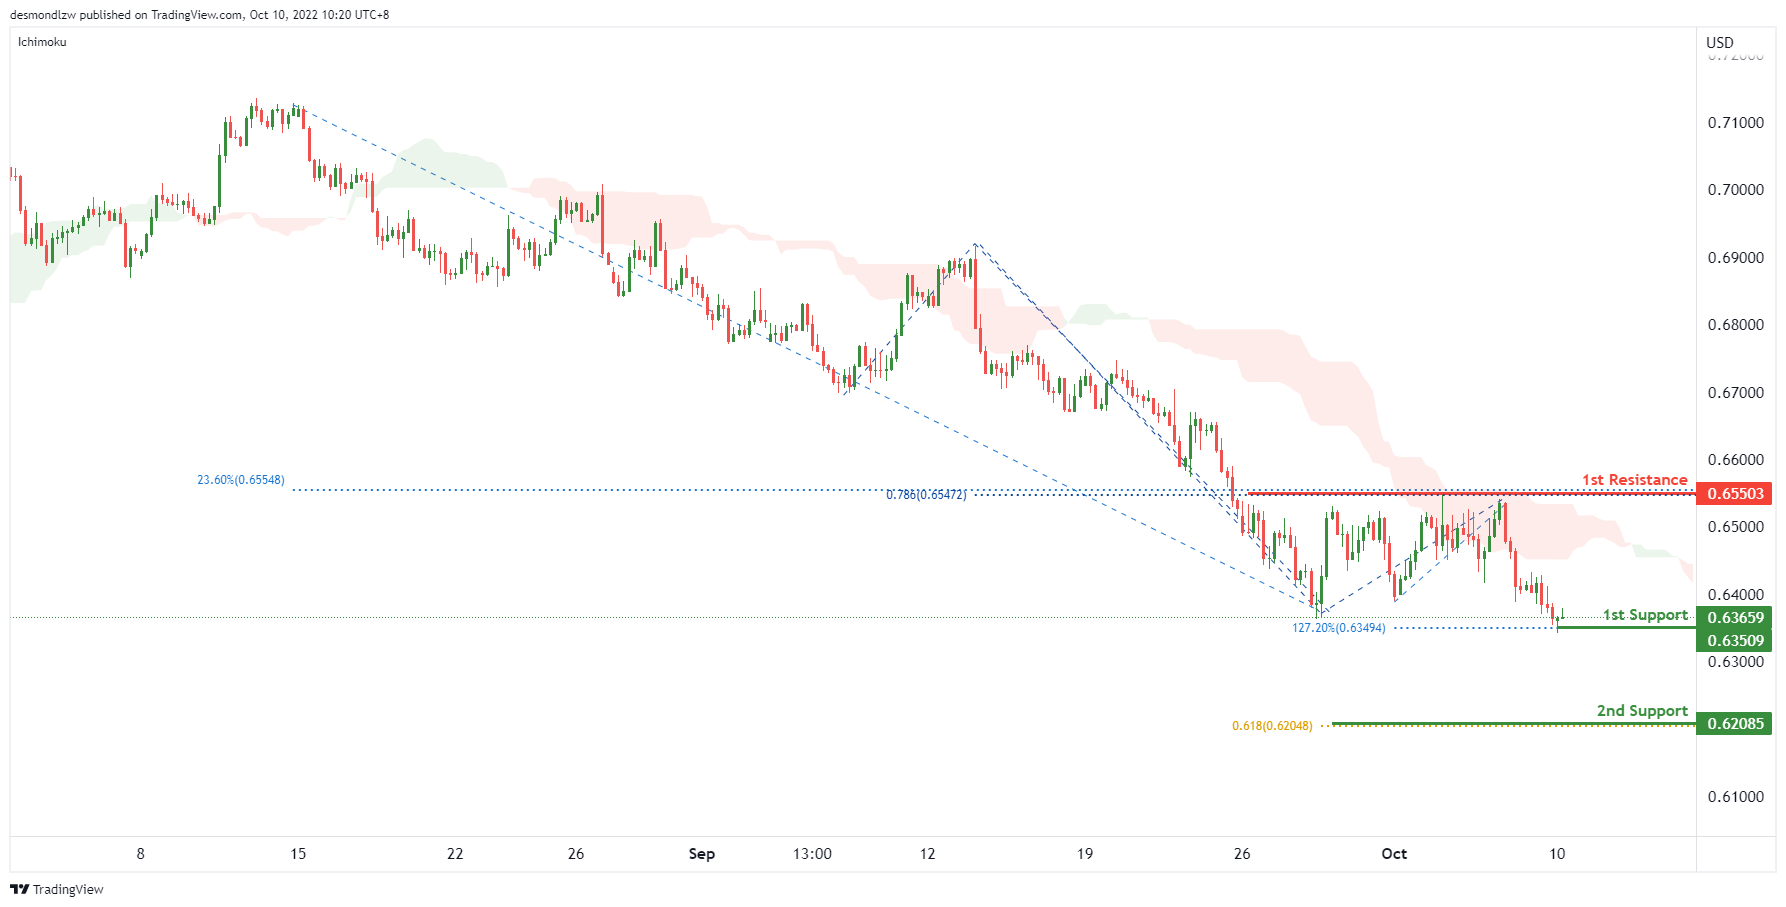
AUD/USD:
On the H4, the price is bouncing off from the 1st support at 0.63509, which is in line with the swing low and 127.2% fibonacci extension. The price may rise from the 1st support and test the 1st resistance at 0.65503, where the previous swing high, 23.6% fibonacci retracement and 78.6% fibonacci projection are. Alternatively, as the price is below ichimoku cloud, the price may break the 1st support and drop to the 2nd support at 0.62085, which is in line with the 61.8% fibonacci projection.
Areas of consideration
- H4, 1st support at 0.63509,
- H4, 1st resistance at 0.65503
NZD/USD:
On the H4, the price bounced off from the 1st support at 0.55942, which is in line with the swing lows. The price may rise to test the 1st resistance at 0.57384, which is in line with the previous swing highs and 61.8% fibonacci retracement. Alternatively, as the price is below ichimoku cloud, the price may break the 1st support and drop to the 2nd support at 0.55396, which is in line with the 127.2% fibonacci extension.
Areas of consideration:
- H4 time frame, 1st support at 0.55942
- H4 time frame, 1st resistance at 0.57384
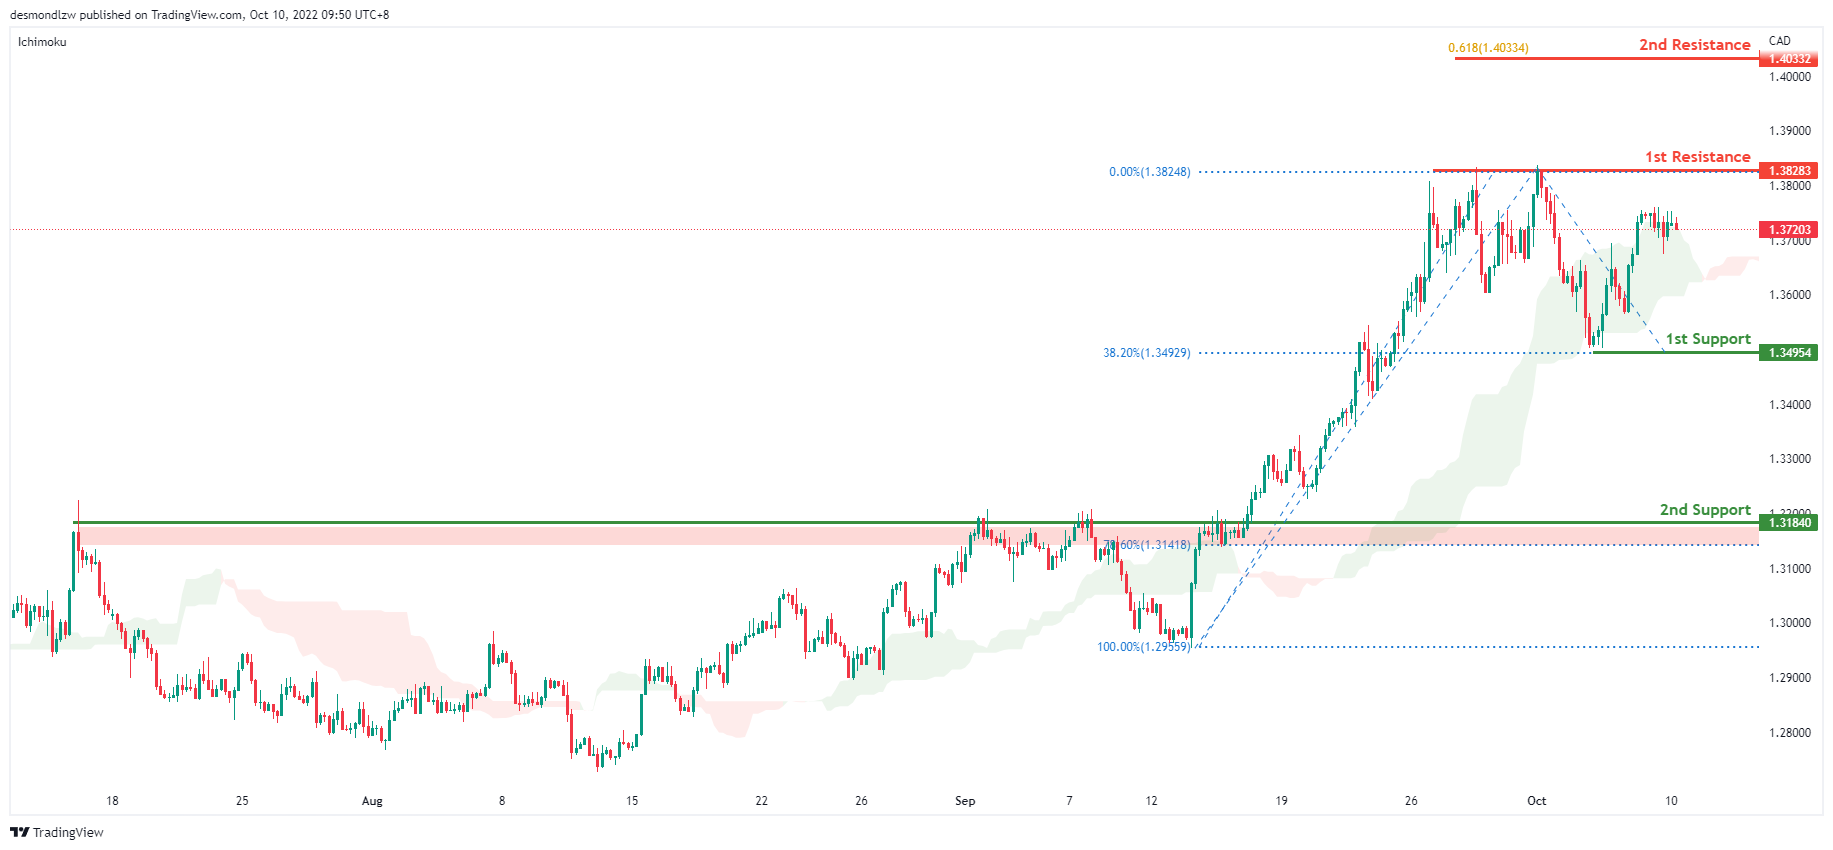
USD/CAD:
On the H4, the price trades higher near the 1st resistance of 1.3832 which is the previous swing high level. With the price trading above the ichimoku cloud, we have a short term bullish bias. The price could break the first resistance to test the second resistance at 1.4033 where the 61.8% projection sits. Alternatively it could fall to the 1st support at 1.3495 which is in line with the 38.2% retracement level and the previous swing low subsequently the second support at 1.3184 where the overlap support sits
Areas of consideration:
- H4 time frame, 1st resistance at 1.3828
- H4 time frame, 1st support at 1.3495
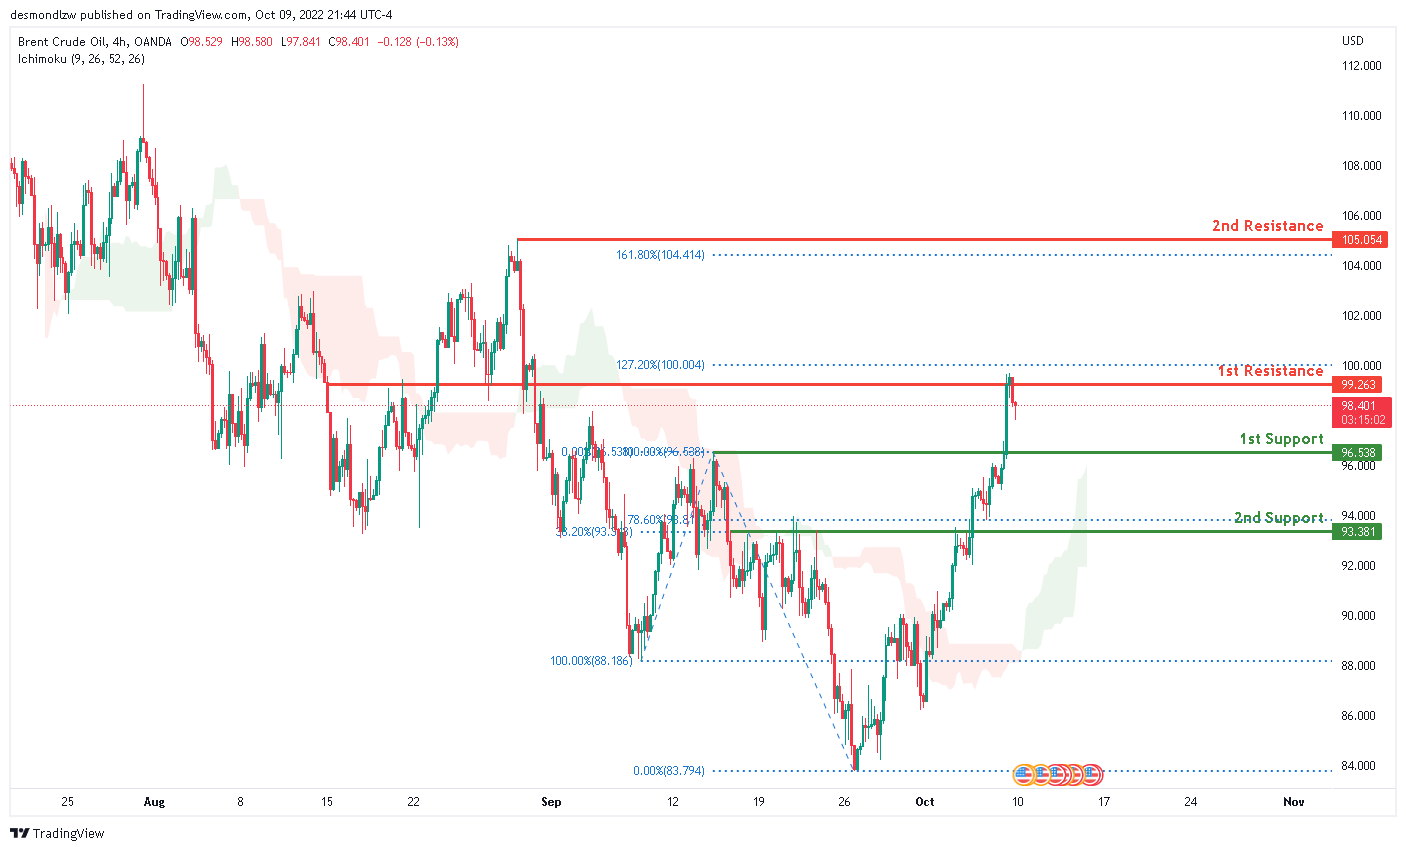
OIL:
Oil is in a bearish trend on the H4 chart. However, the price started to rise a week ago and is now above the Ichimoku cloud, indicating that the market has entered a medium-term bullish trend. Price has closed above the first support level at 96.538, which contains the 100% Fibonacci and 0% Fibonacci lines. Price has also struck the first resistance level at 99.263 (the 127.2% Fibonacci line) and reflected back downwards. If the bullish momentum continues, price will close above the first resistance and move toward the second resistance, which is positioned at 105.054, where the 161.8% Fibonacci line is located.
Areas of consideration:
- H4 time frame, 1st resistance at 99.263
- H4 time frame, 1st support at 96.538
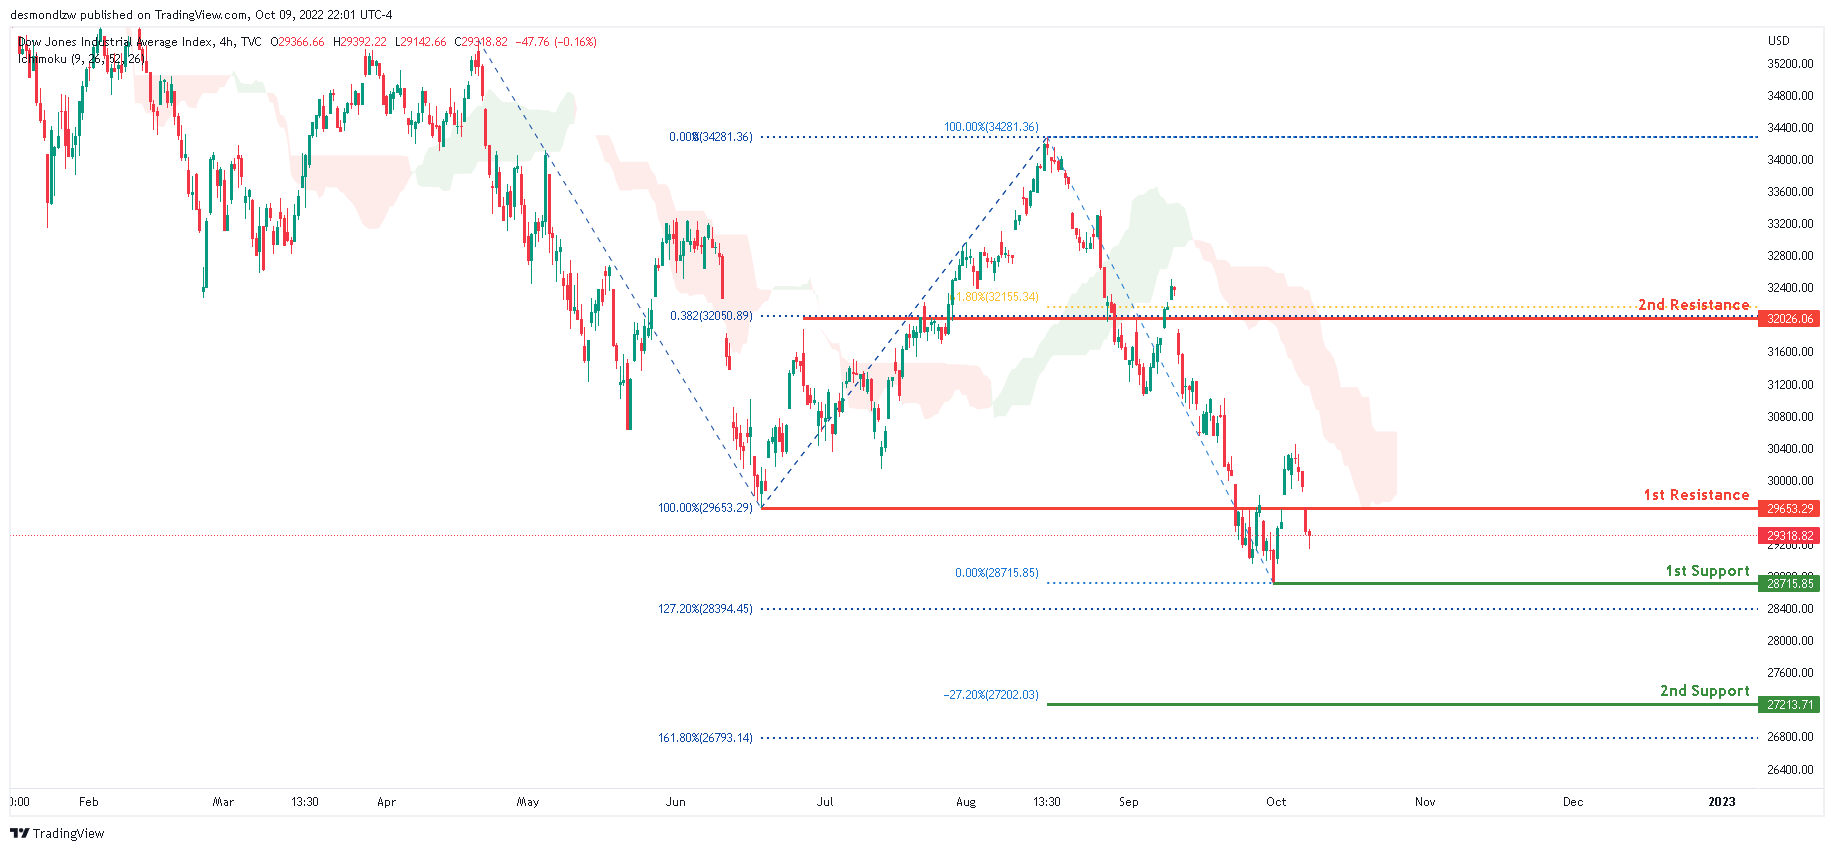
Dow Jones Industrial Average:
DJI is in a strong bearish trend on the H4 chart. To add to this bias, the price is below the Ichimoku cloud, indicating a bearish market. Price has closed below the first resistance level of 29653.29, which contains the 100% Fibonacci line and the last swing low. If the bearish momentum continues, price will move towards the first support level around 28715.85, which contains the 0% Fibonacci and 127.2% Fibonacci extension lines.
Areas of consideration:
- H4 time frame, 1st support at 28715.85
- H4 time frame, 1st resistance at 29653.29
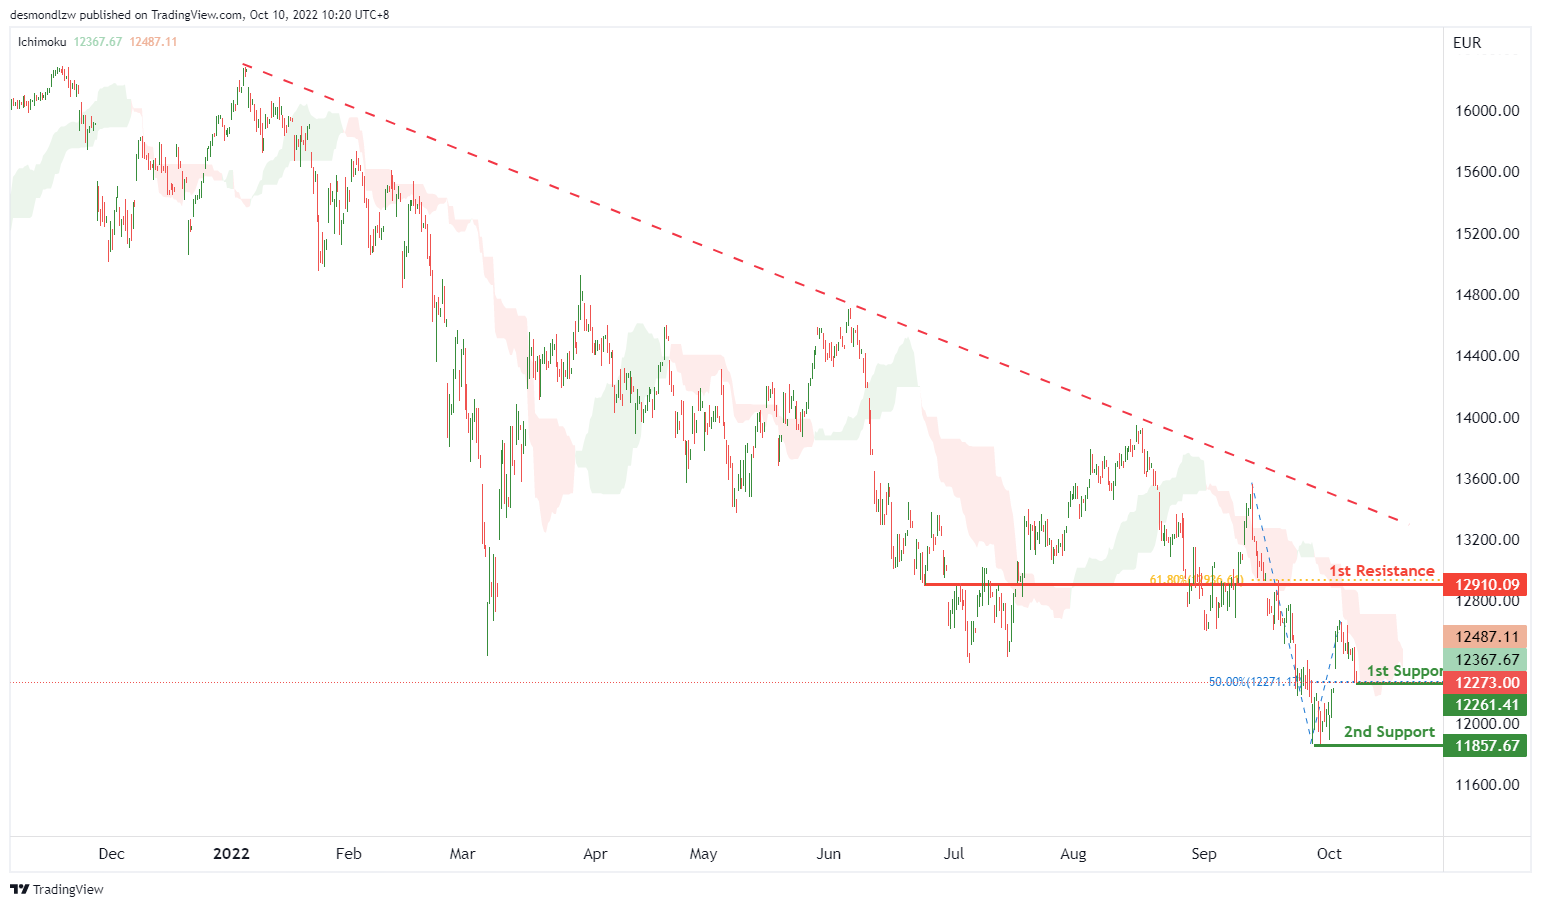
DAX:
On the H4, with the price moving below ichimoku cloud and long term descending trendline, we have a bearish bias that the price may break the 1st support at 12261.41, which is in line with the 50% fibonacci retracement. If the 1st support is broken, the 2nd support could be at 11857.67, which is in line with the swing low. Alternatively, the price may rise to the 1st resistance at 12910.09, which is in line with the 61.8% fibonacci retracement.
Areas of consideration:
- H4 time frame, 1st support at 12261.41
- H4 time frame, 2nd support at 11857.67
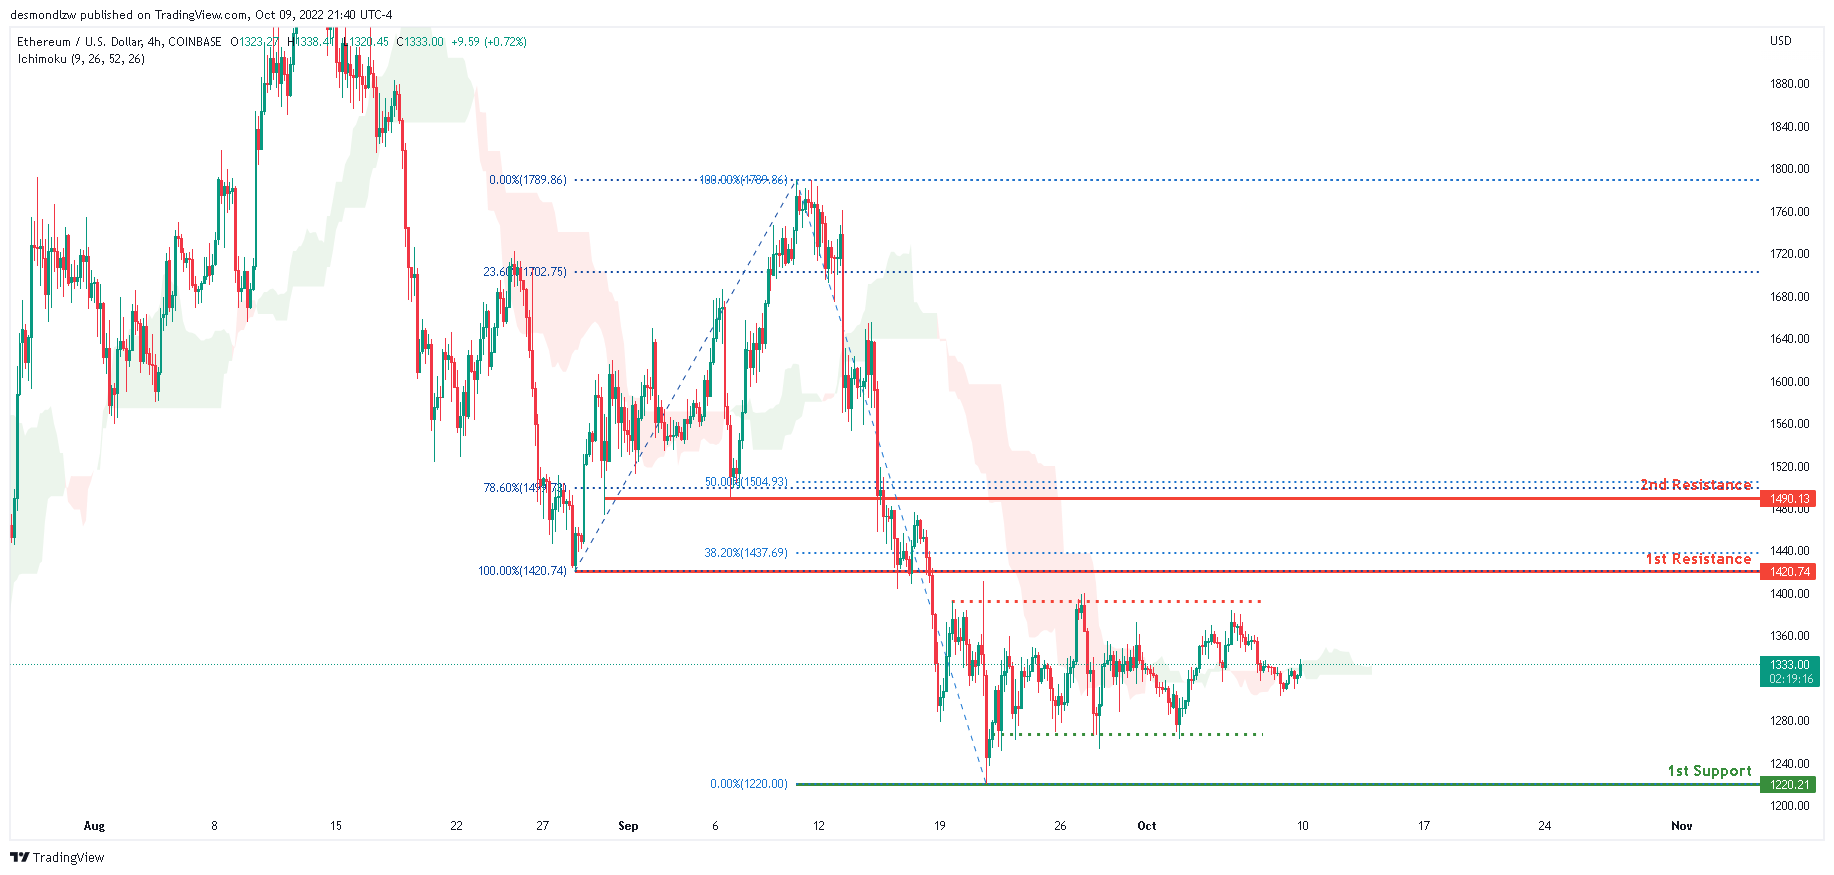
ETHUSD:
Price is in a bearish trend on the H4 chart. Price closed below the first resistance level at 1420.74, which is also the location of the 100% Fibonacci line and the prior swing low. For the previous four weeks, price has been consolidating between the first support, where the 0% Fibonacci line is placed, and the first resistance. Price is expected to remain consolidating between these levels, with no apparent indicators of direction.
Areas of consideration:
- H4 time frame, 1st resistance of 1420.74
- H4 time frame, 1st support at 1220.21
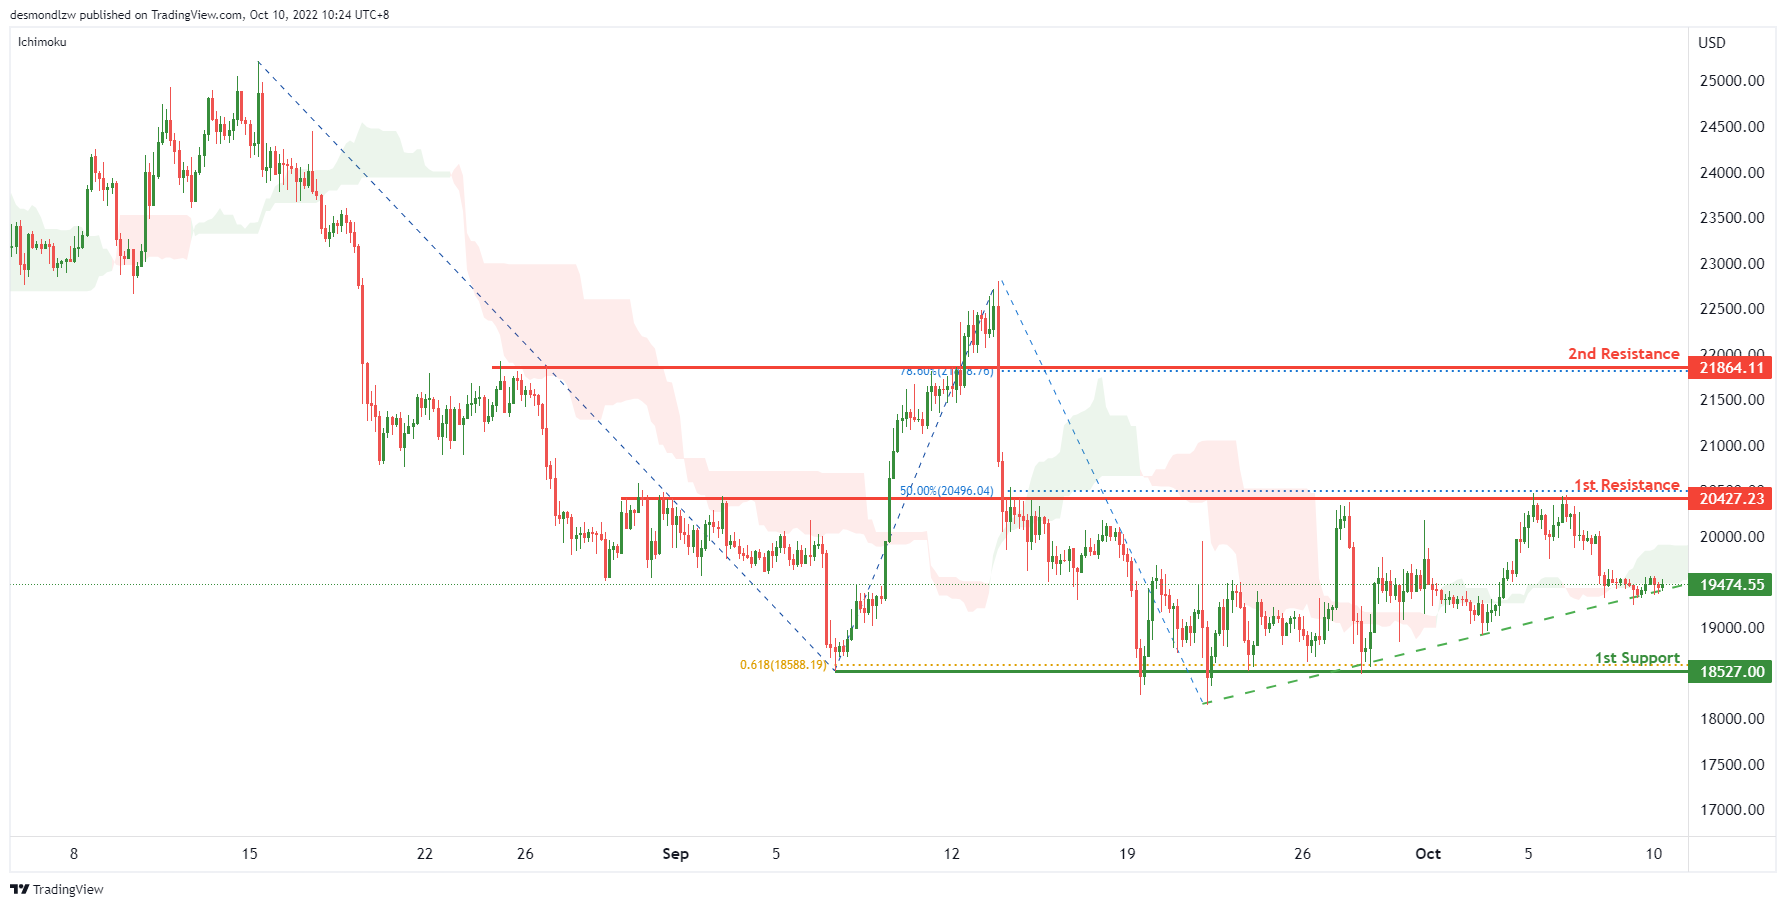
BTCUSD:
On the H4, price is showing a short term ascending trendline and crossing the ichimoku cloud, we can expect the price rise to test the 1st resistance at 20427.23, where the overlap resistance and 50% fibonacci retracement are. If the 1st resistance is broken, the next resistance could be at 21864.11, which is in line with the 78.6% fibonacci retracement. Alternatively, the price may pull back from the 1st resistance and drop to the 1st support at 18527, which is in line with the swing lows and 61.8% fibonacci projection.
Areas of consideration:
- H4 time frame, 1st resistance at 20427.23
- H4 time frame, 2nd resistance at 21864.11
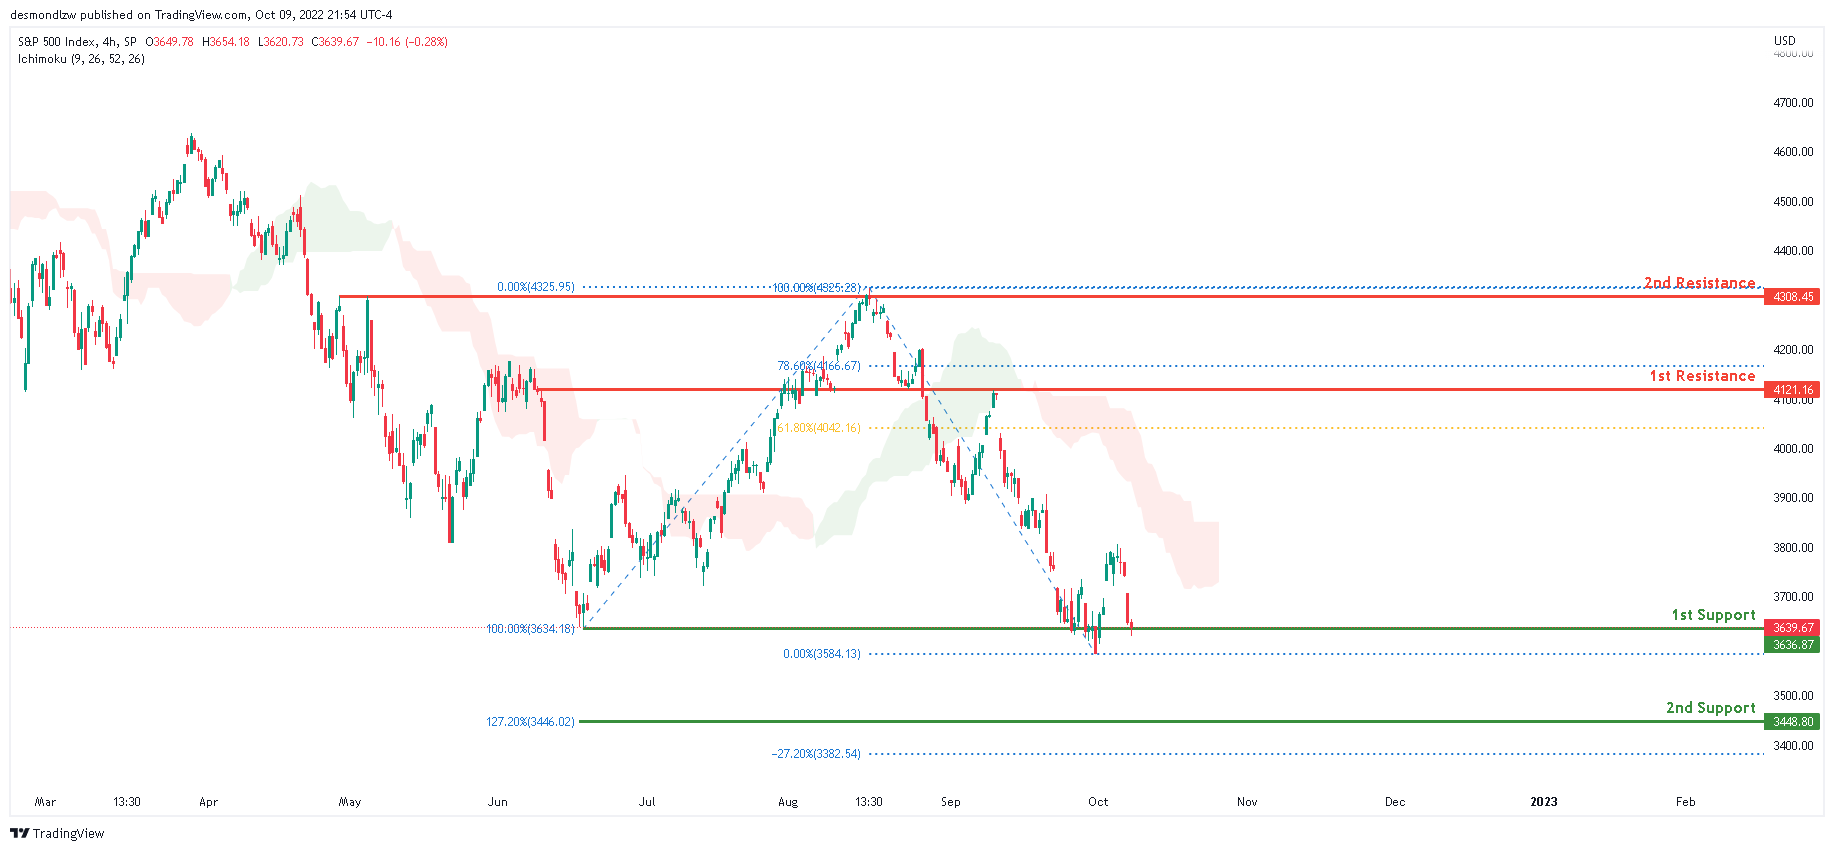
S&P 500:
The S&P500 is in a strong bearish trend on the H4 chart. In addition, the price is below the ichomoku cloud, indicating a bearish market. Price is currently resting along the first support at 3636.87, which is also the location of the 100% Fibonacci line and the last swing low. If the bearish momentum continues, price will fall below the first support and move towards the second support at 3448.80, which contains the 127.2% Fibonacci extension line and the -27.2% Fibonacci expansion line.
Areas of consideration:
- H4 time frame, 1st support at 3636.87
- H4 time frame, 2nd resistance at 3448.80


