
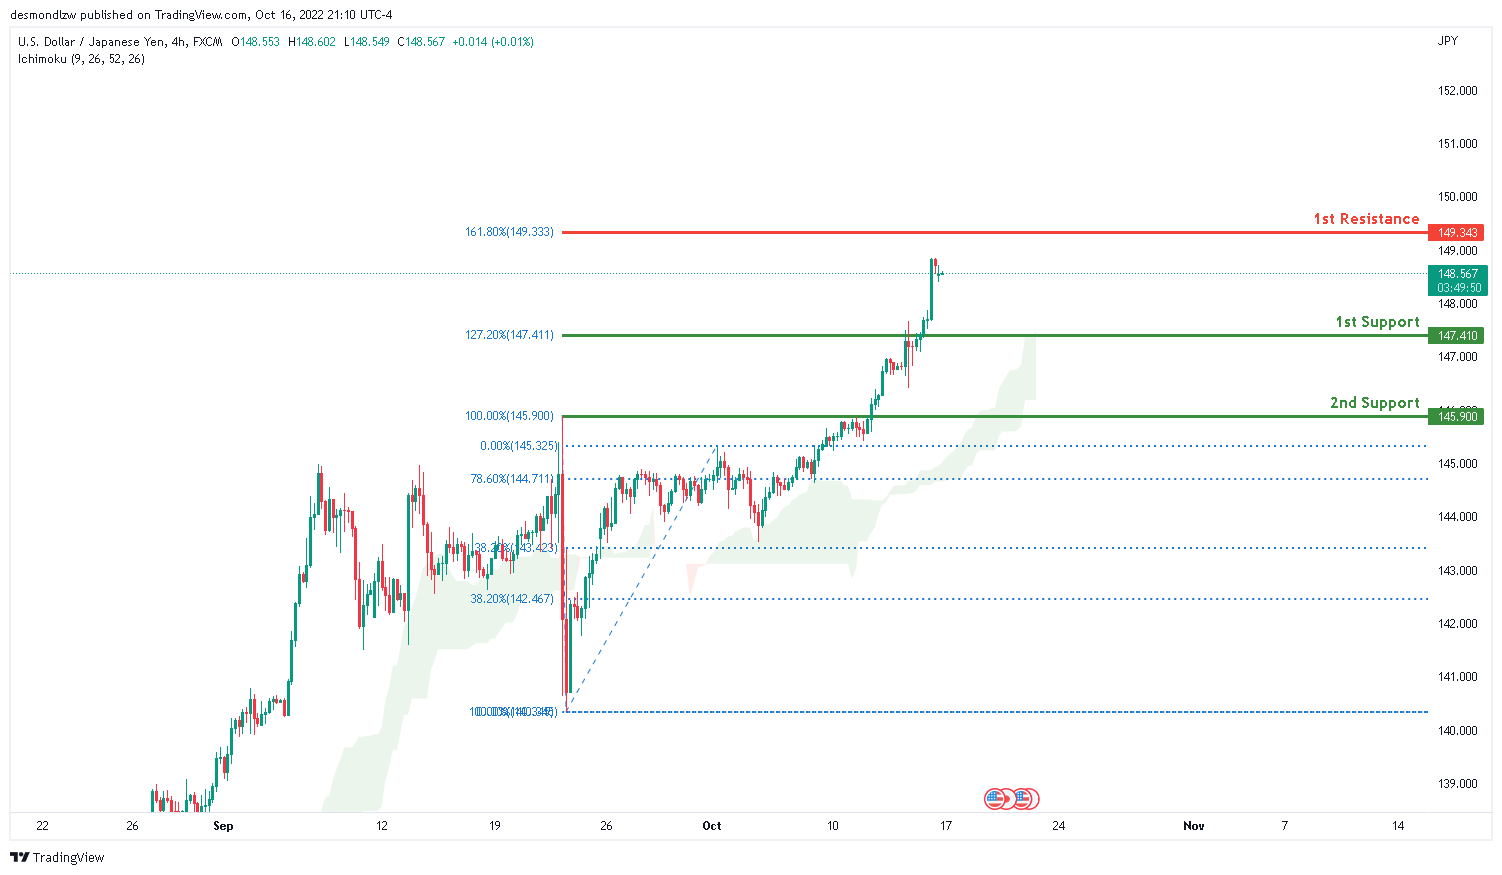
USD/JPY:
The current general bias for USDJPY on the H4 chart is bullish. To add to this bias, the price is currently trading above the Ichimoku cloud, indicating a bullish market. Price has maintained its strong bullish momentum and crossed the key level at 147.410, which contains the 127.2% Fibonacci extension line where the 1st support lies. If this strong bullish momentum continues, expect price to continue towards the 1st resistance at 149.313 where the 161.8% Fibonacci extension is located.
Areas of consideration:
- H4 time frame, 1st resistance at 147.410
- H4 time frame, 1st support at 145.900
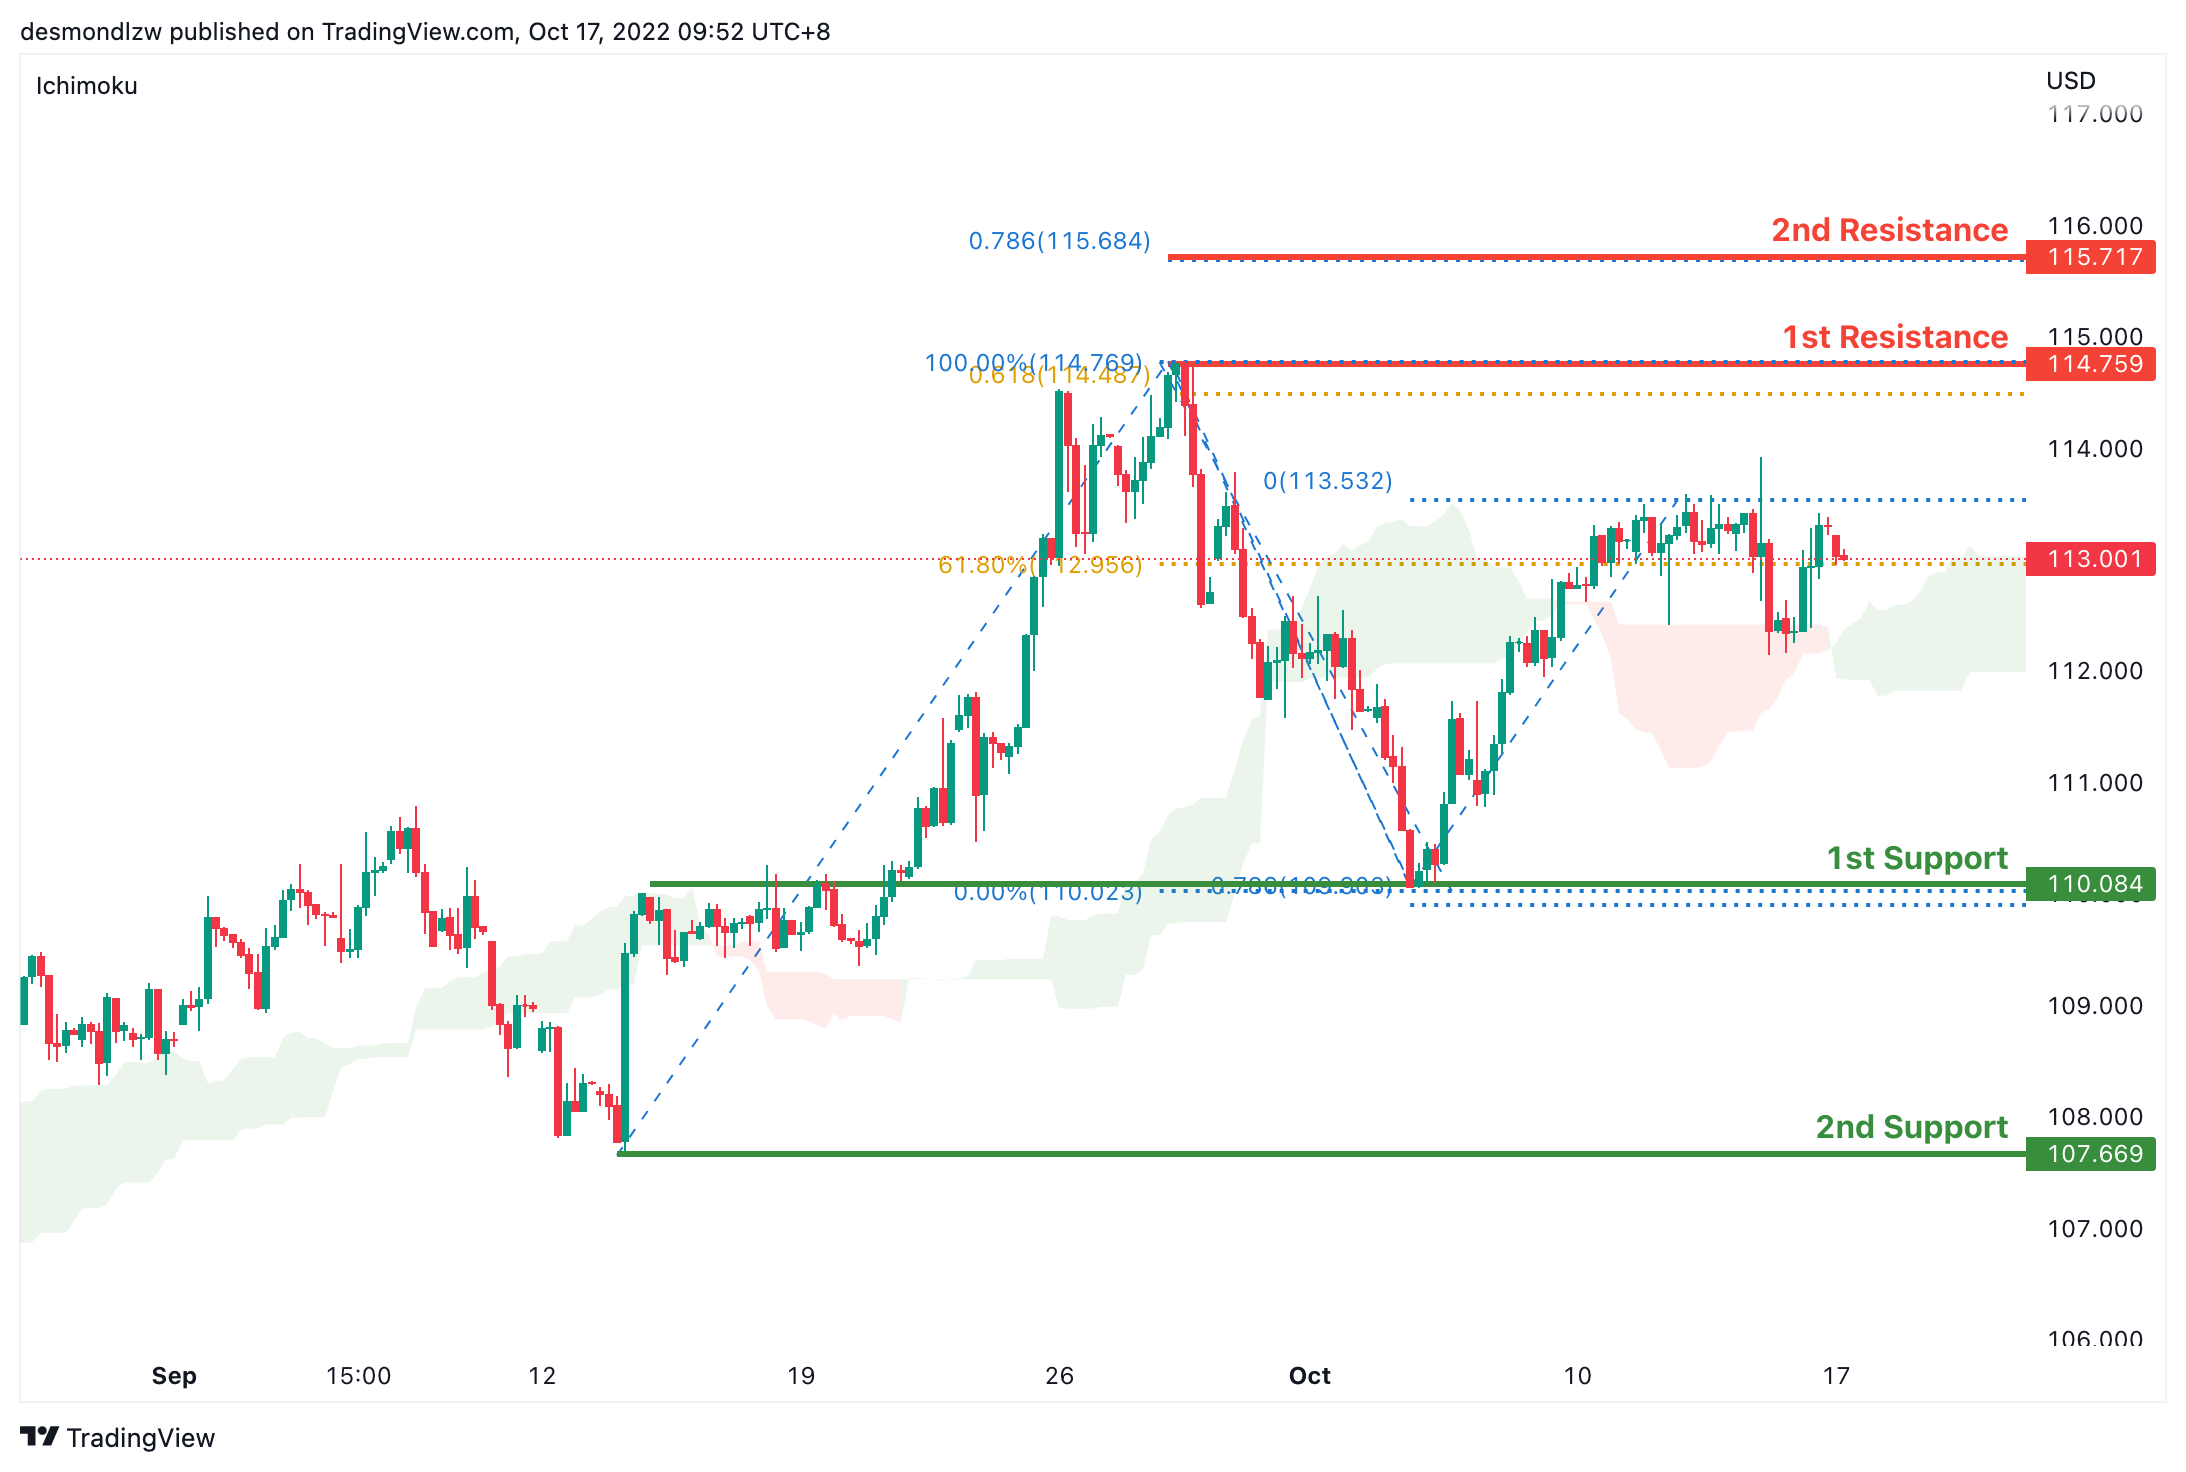
DXY:
On the H4 chart, prices are moving in an ascending trend signalling an overall bullish momentum. Prices are moving towards the first first resistance at 114.759 where the previous swing high sits. If bullish momentum continues it will bring price to 115.717 where the 78.6% projection. Alternatively it could move to the first support at 110.084 where the swing low sits. if it breaks this level, bearish momentum will bring price to second support at 107.669.
Areas of consideration:
- H4 time frame, 1st resistance at 114.759
- H4 time frame, 1st support at 110.084
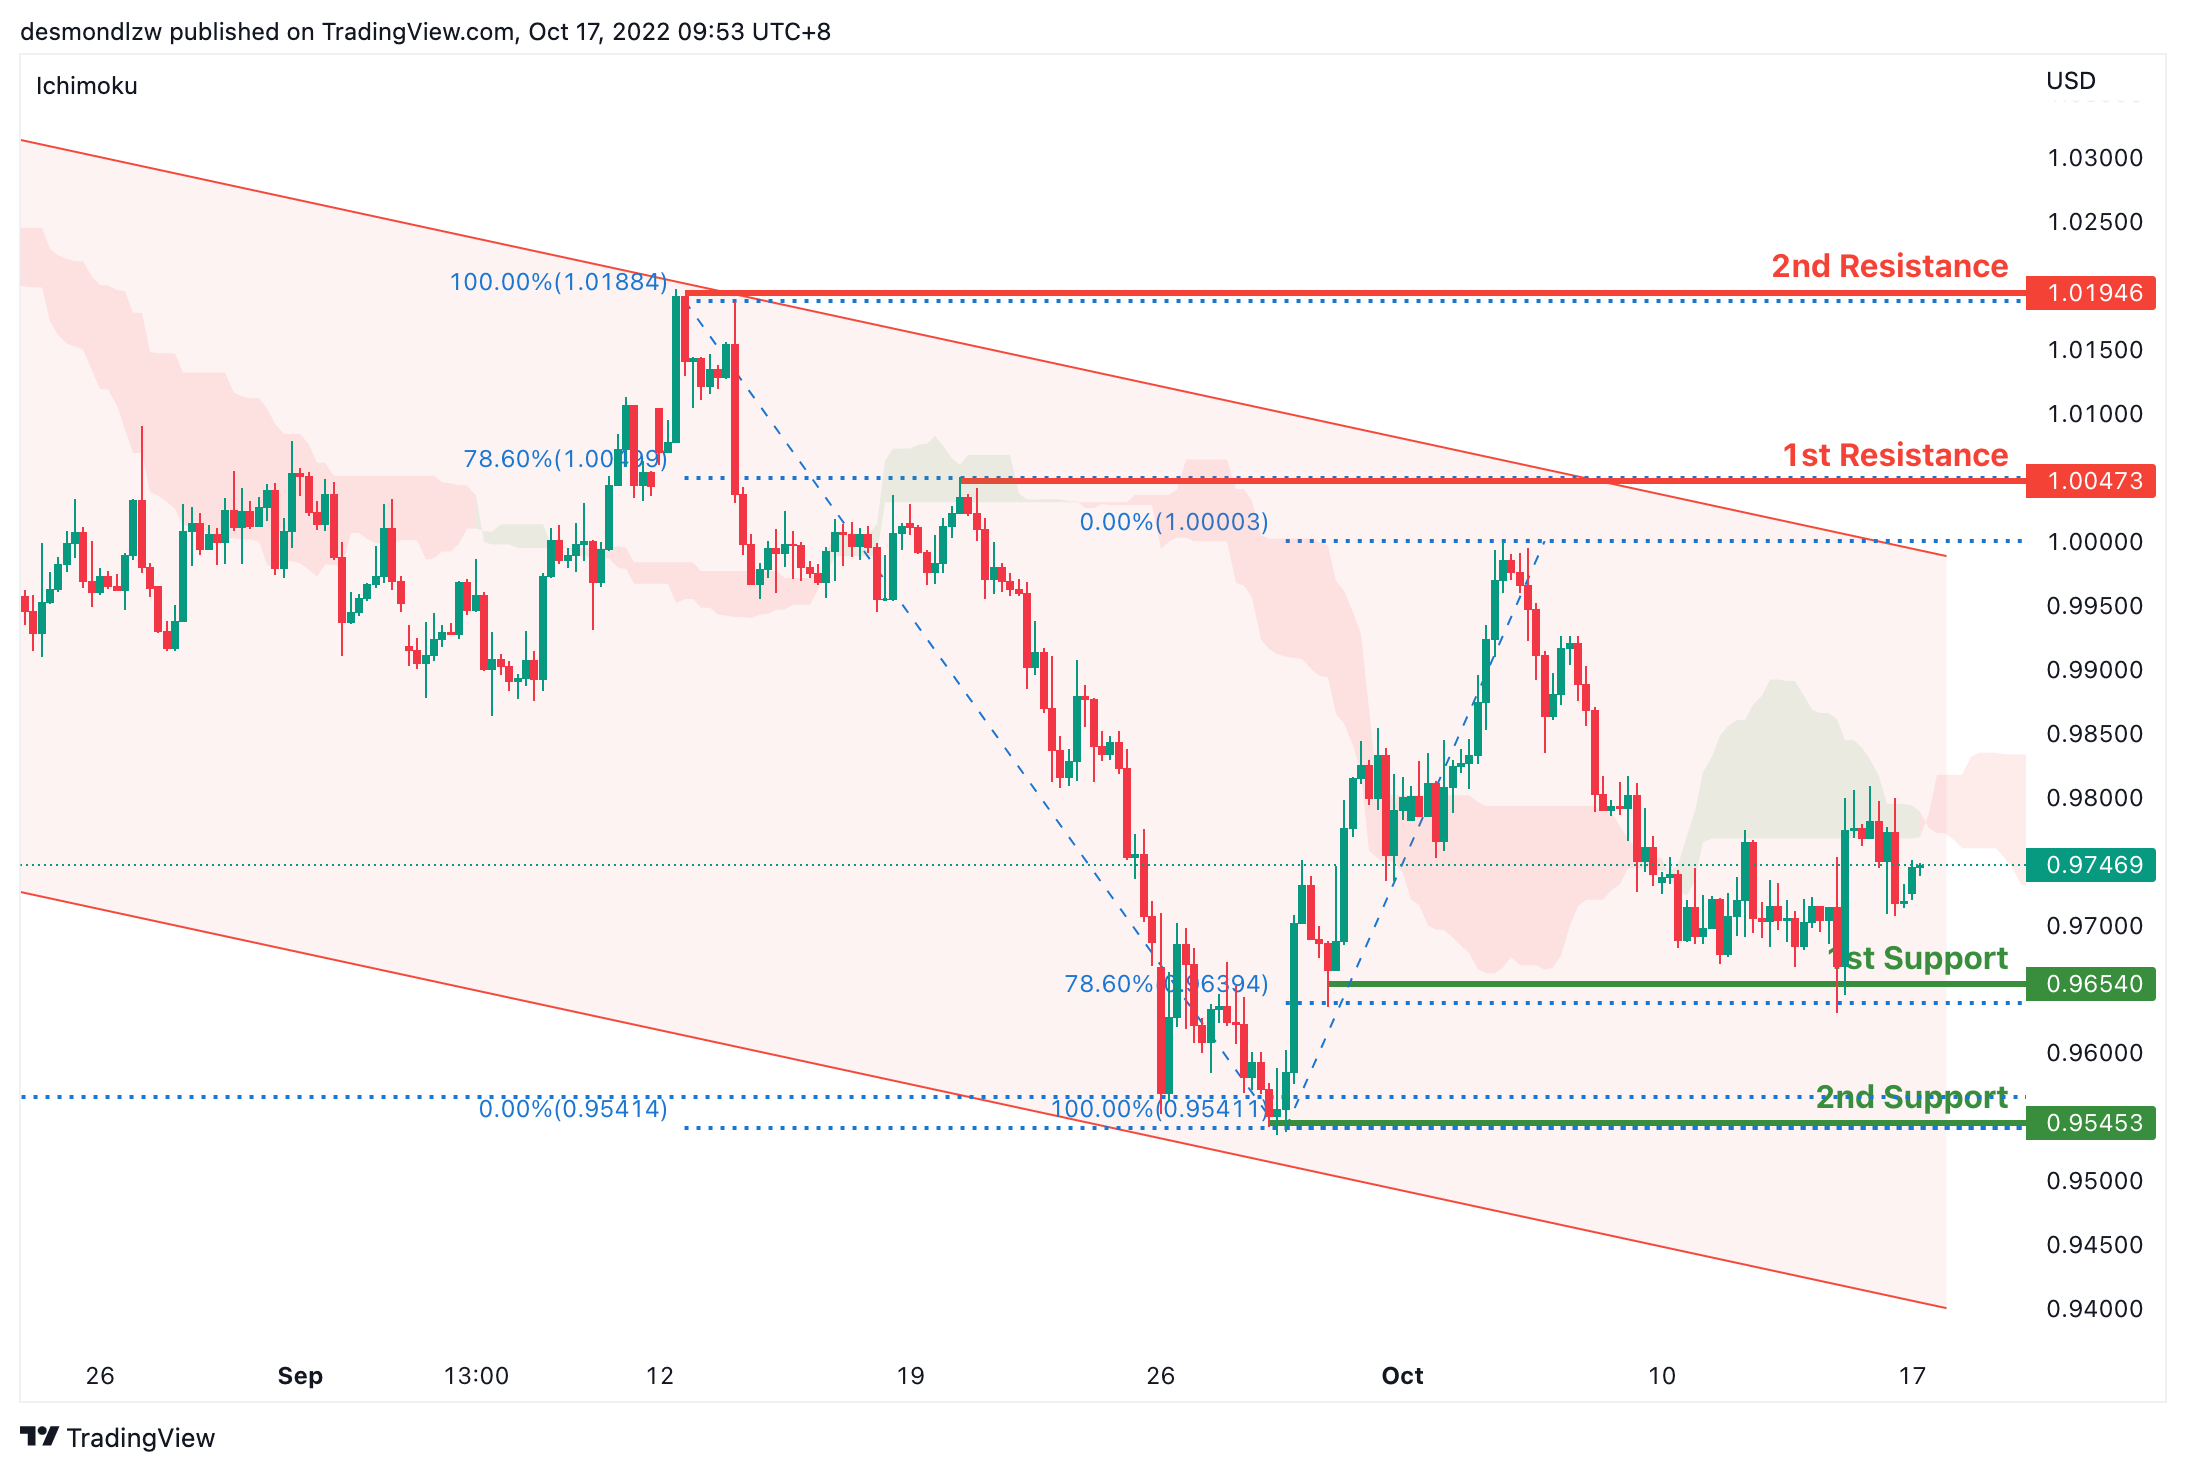
EUR/USD:
On the H4, price is moving within the descending trendline in a descending manner, with the price moving below ichimoku cloud- we are still overall bearish biassed. Although price has bounced off the first support at 0.9695 where the 61.8% retracement sits, it could still break this level and bring price to second support at 0.9545 where the swing low and 161.8% extension sit. Alternatively, price may test the first resistance at 1.0047 where the 78.6% retracement sits. If price breaks this level, it may test the second resistance at 1.0194, where the previous swing high sits
Areas of consideration :
- H4 1st resistance at 1.0047
- H4 2nd resistance at 1.0194
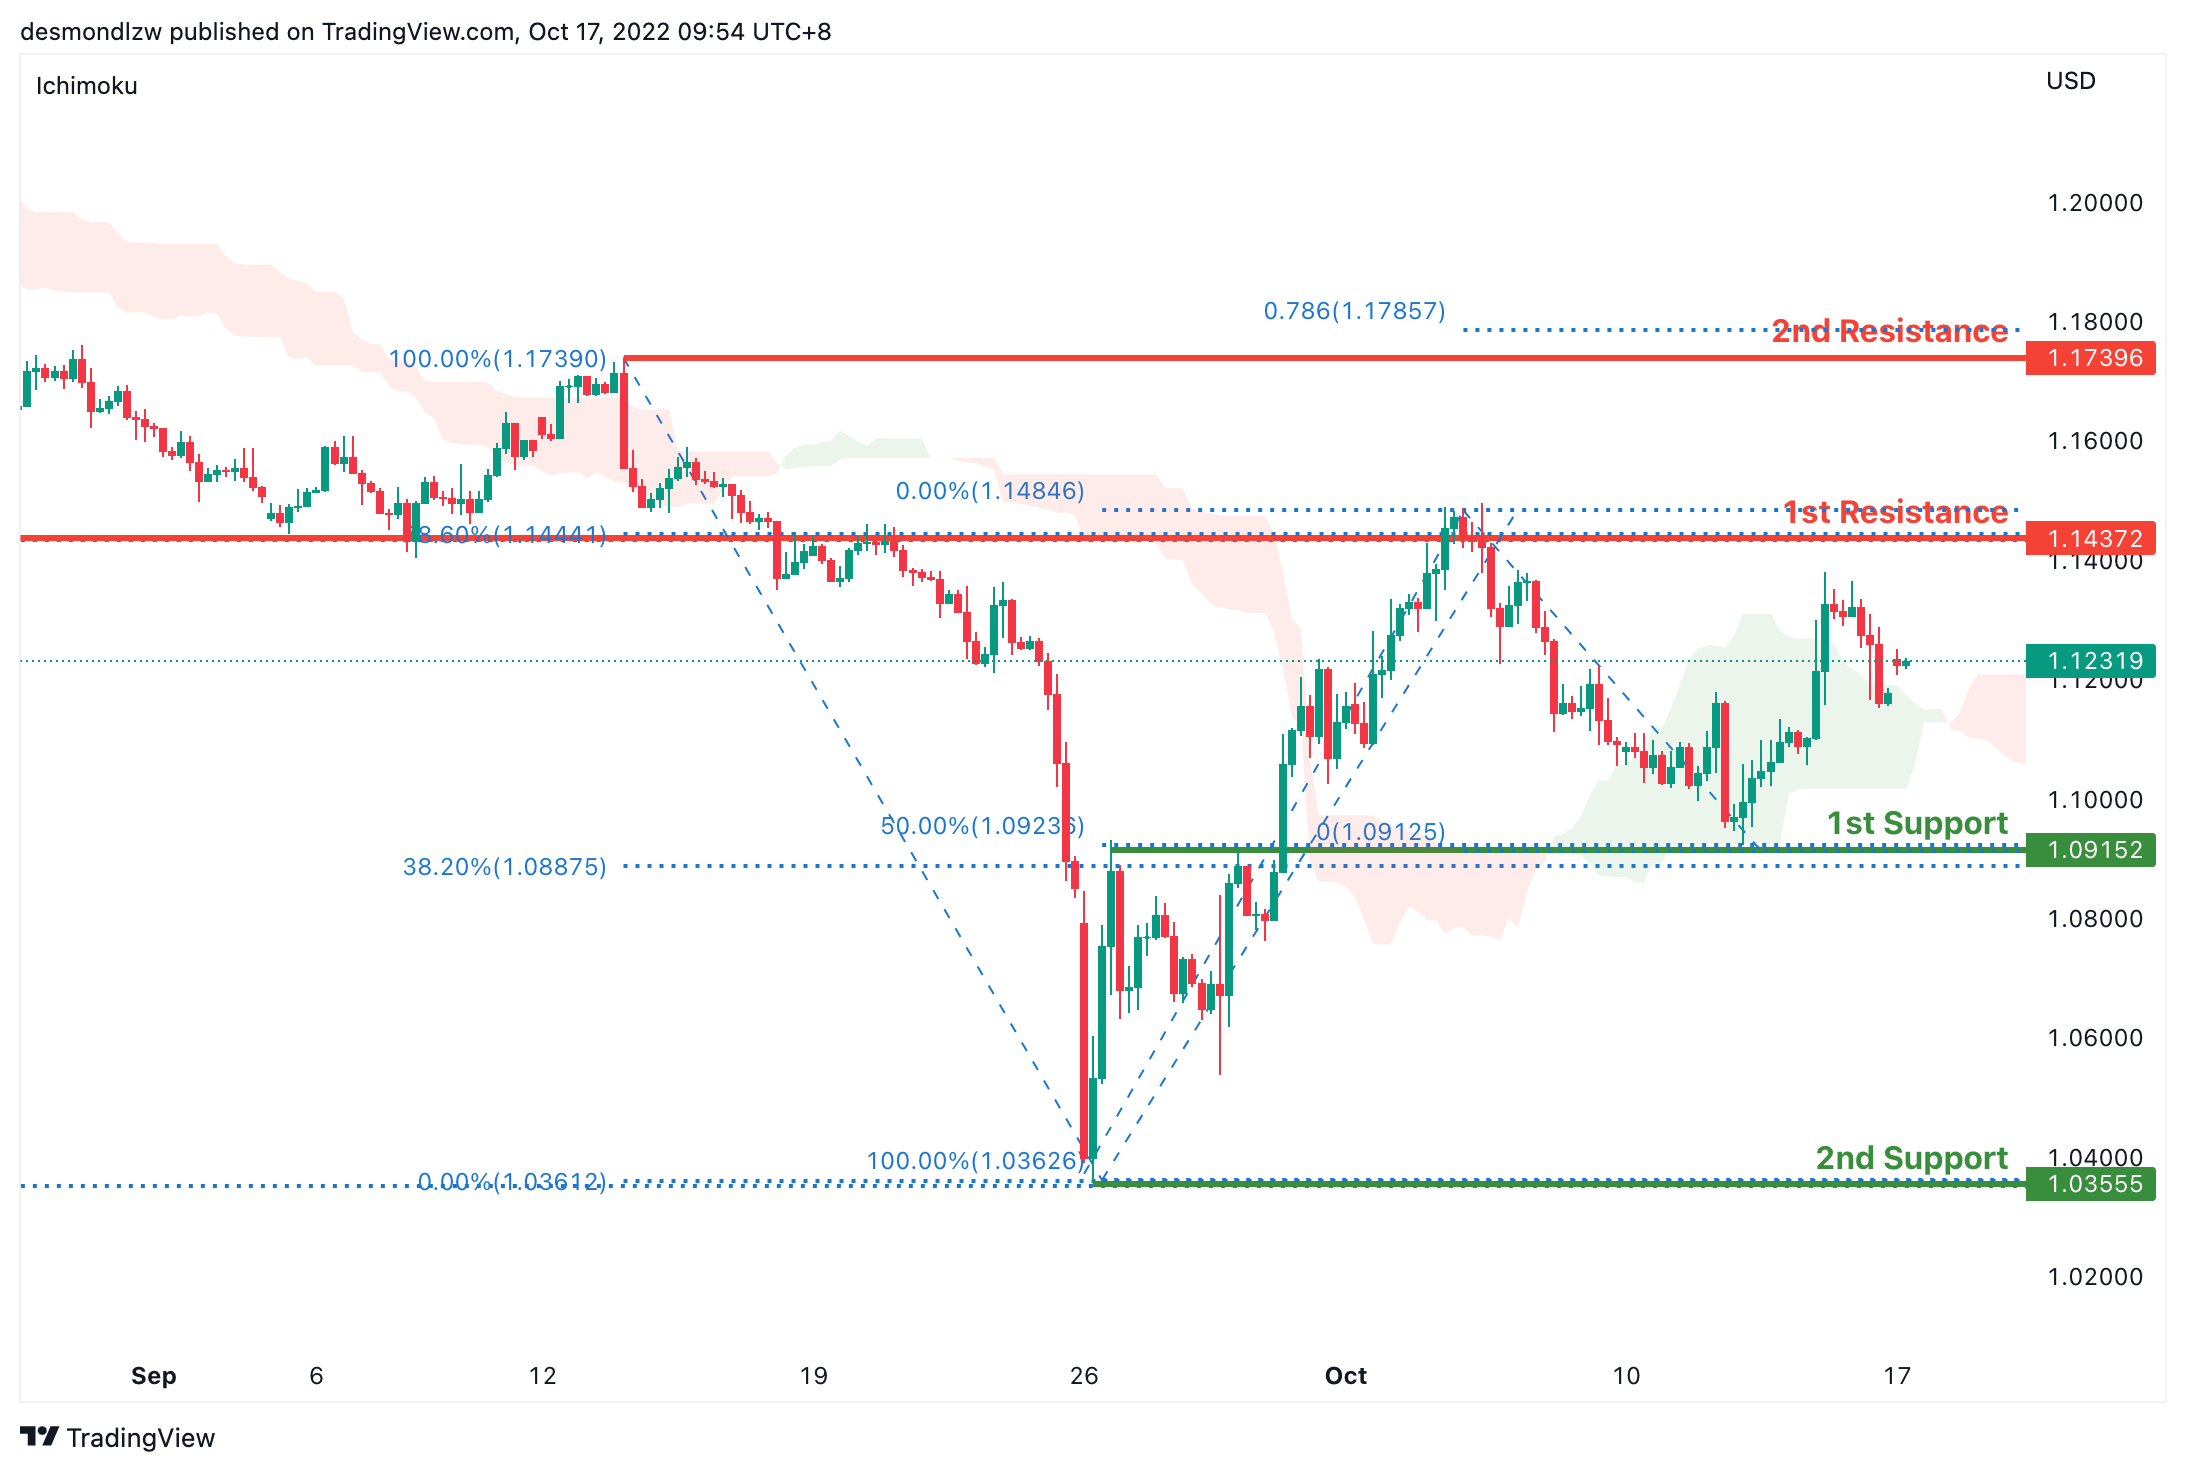
GBP/USD:
On the H4, price has rejected the first support and is moving in an ascending trend hence we are slightly bullish bias- if price breaks the first support at 1.0915 where the 50% retracement sits, bearish momentum will bring price to the second support at 1.0355 where the previous swing low sits. Alternatively price can test the first resistance at 1.1437 where the 78.6% retracement and overlap resistance sit. Subsequently the second resistance at 1.1739
Areas of consideration:
- H4 1st support at 1.0915
- H4 1st resistance at 1.1437
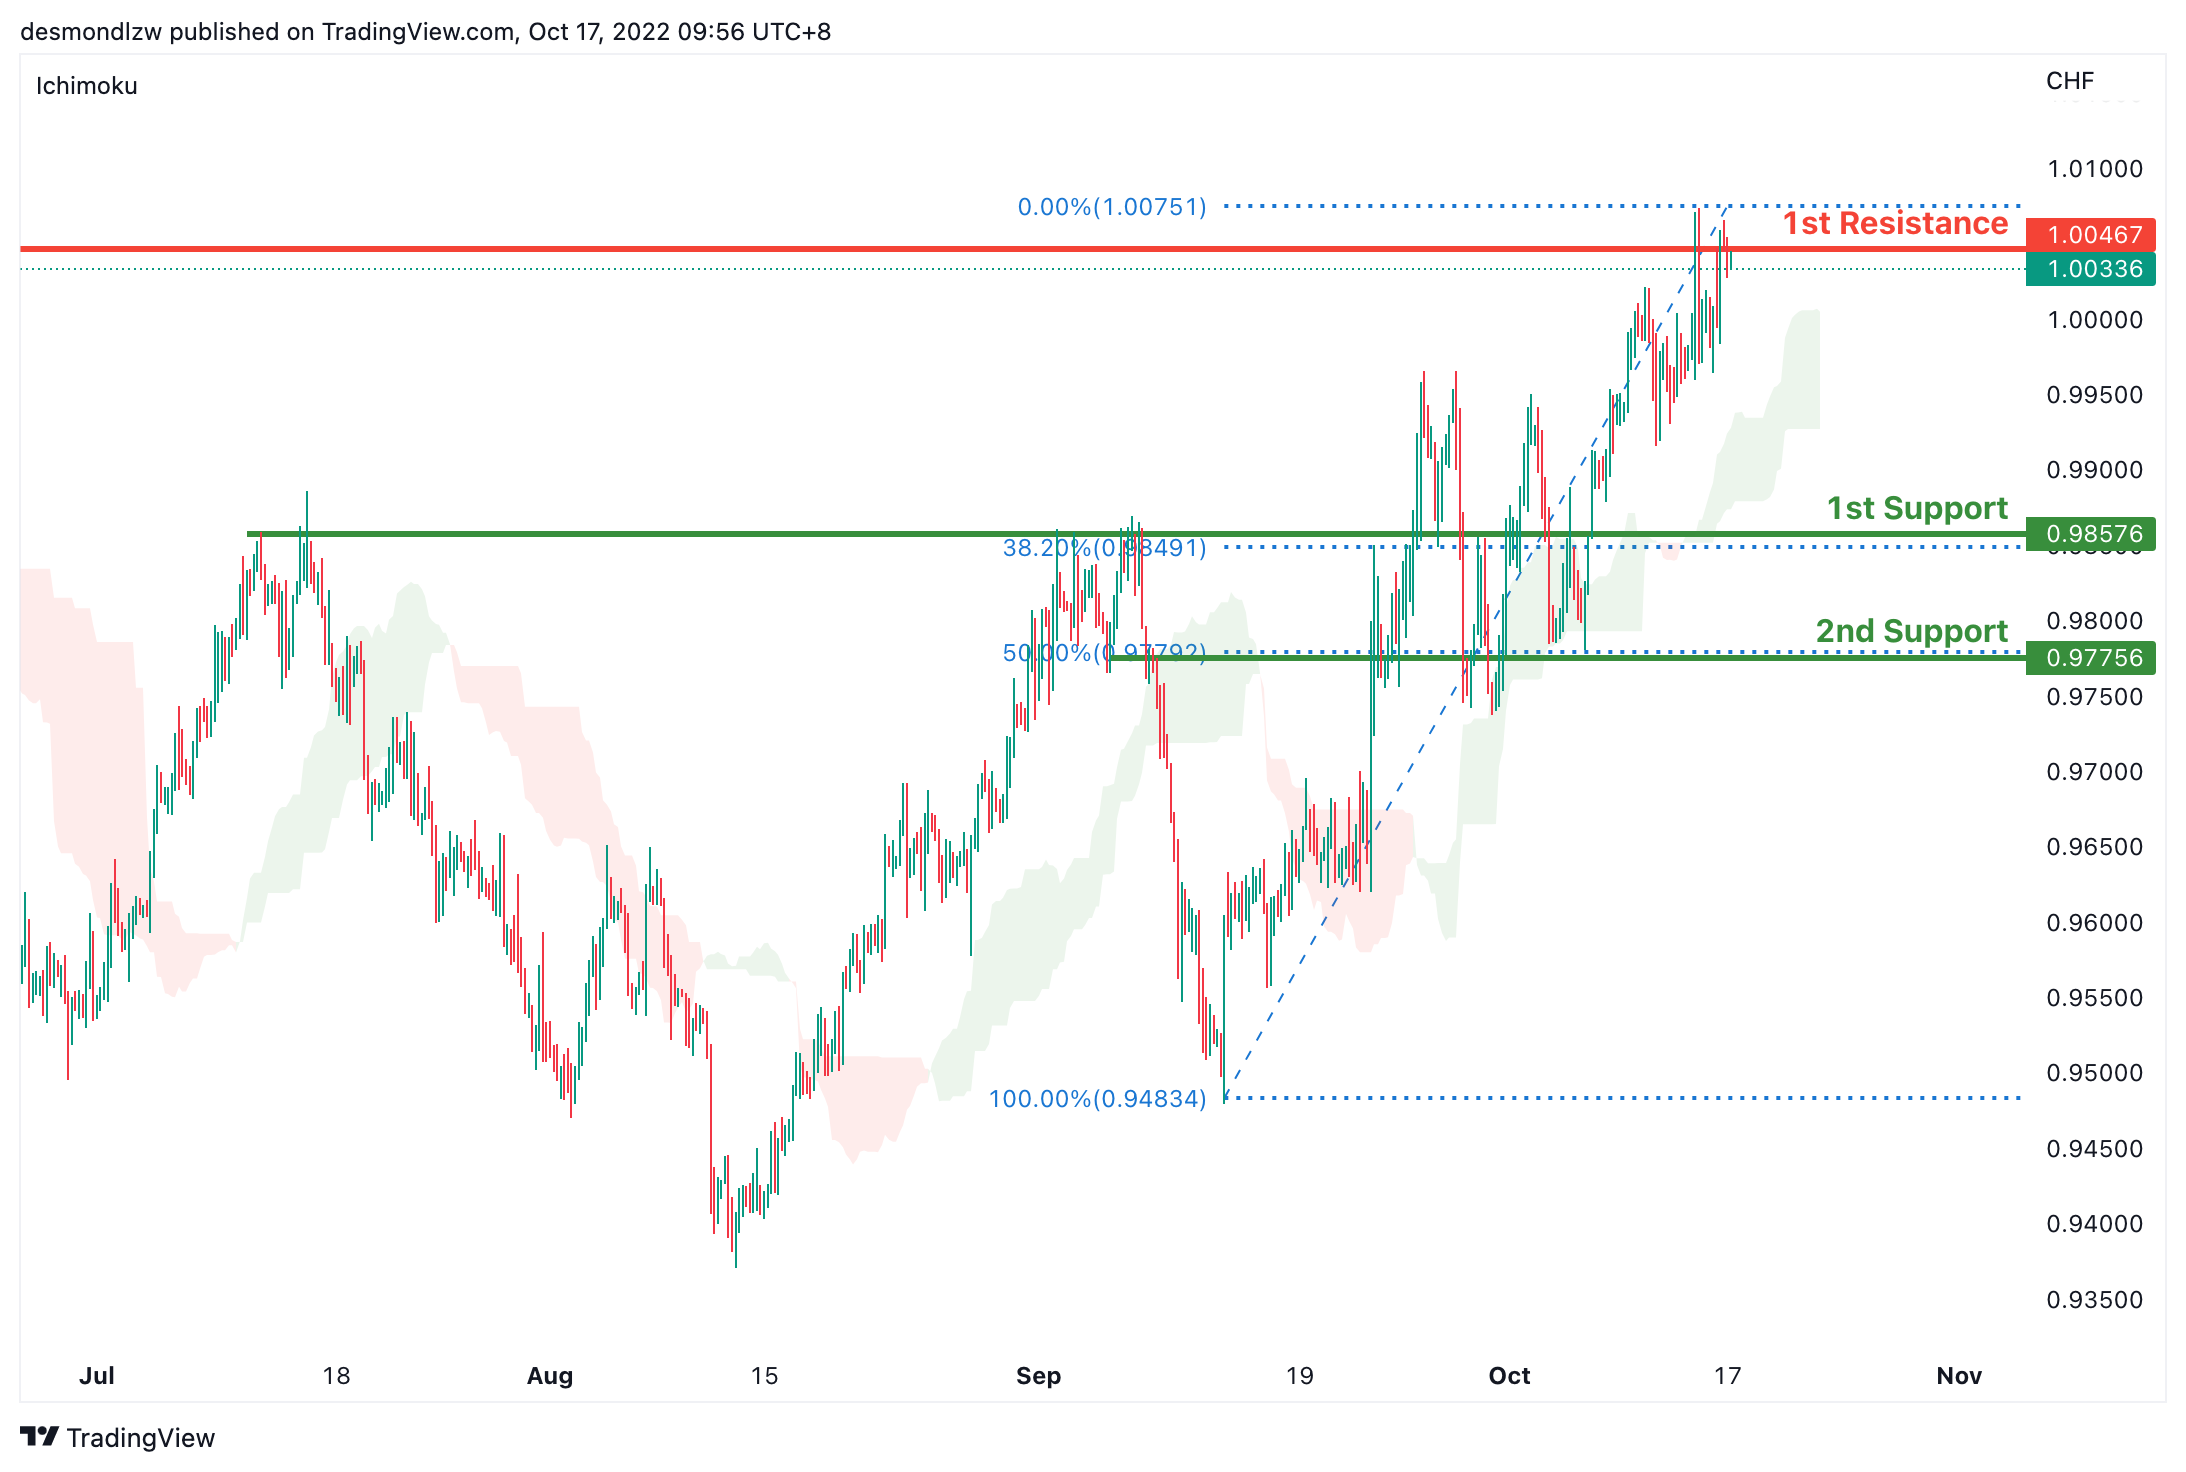
USD/CHF:
USDCHF is in a strong bullish trend on the H4 chart. Price is trading above the Ichimoku cloud signalling a bullish trend. Price has tested the first resistance at 1.0046 where the previous swing high sits and it’s pulling back slightly. If bearish momentum continues, price can test the first support at 0.9868 where the overlap support and 23.6% retracement sits then the second support at 0.9757 where the 50% retracement sits
Areas of consideration
- H4 1st support at 0.9868
- H4 1st resistance at 1.0046
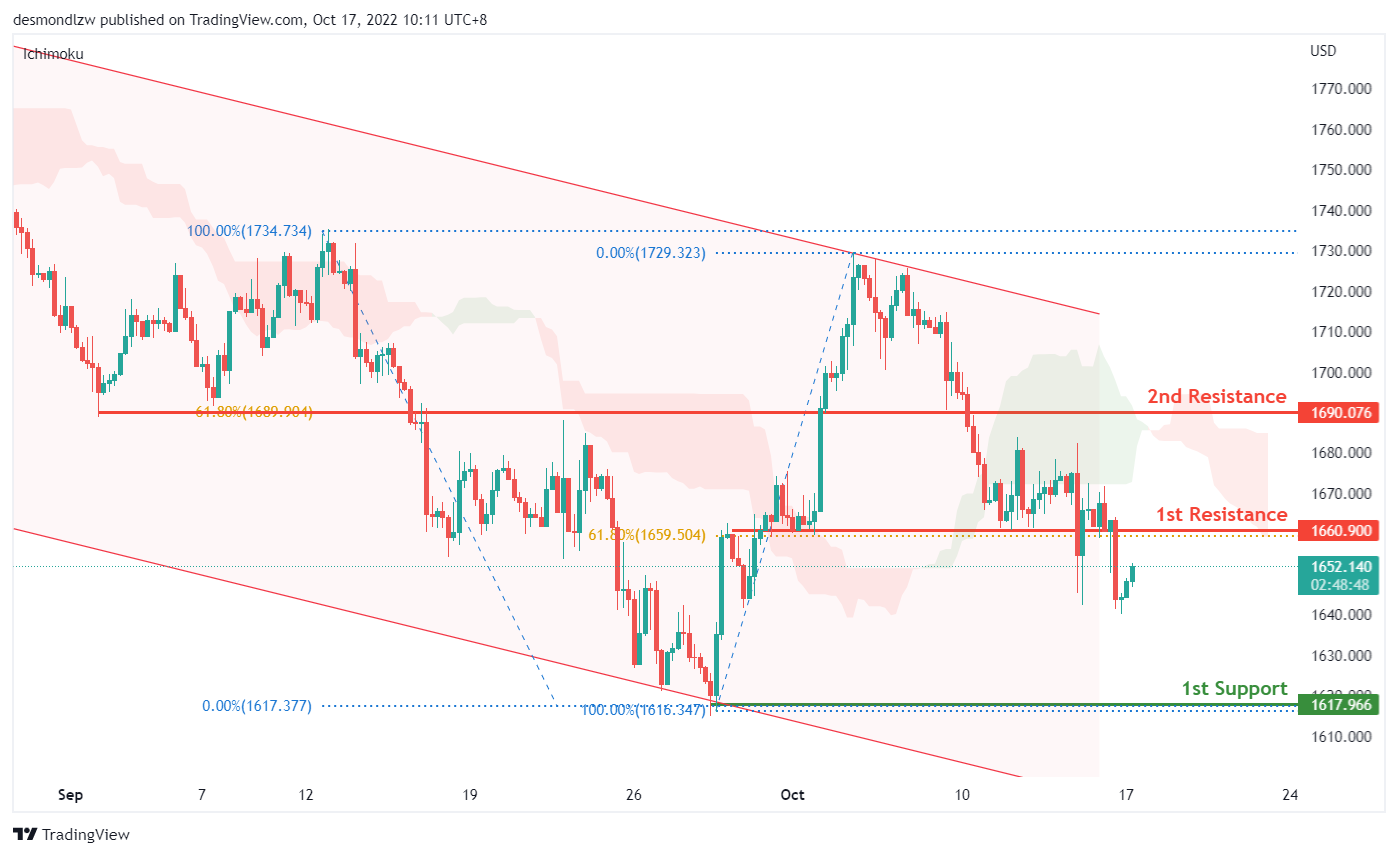
XAU/USD (GOLD):
On the H4, after the significant rise, the price is showing a pullback trend now, the 1st resistance is still held at 1660.90 which is in line with the 61.8% fibonacci retracement and overlap support. As the price is within the descending channel, we could expect the price to reverse from the 1st resistance to drop to the 1st support 1617.96, where the previous swing low is. Alternatively, the price may break through the first resistance and rise to test the 2nd resistance at 1690, where the 61.8% fibonacci retracement and overlap support is.
Areas of consideration:
- H4 time frame, 1st support at 1617.96
- H4 time frame, 1st resistance at 1660.90
- H4 time frame, 2nd resistance at 1690
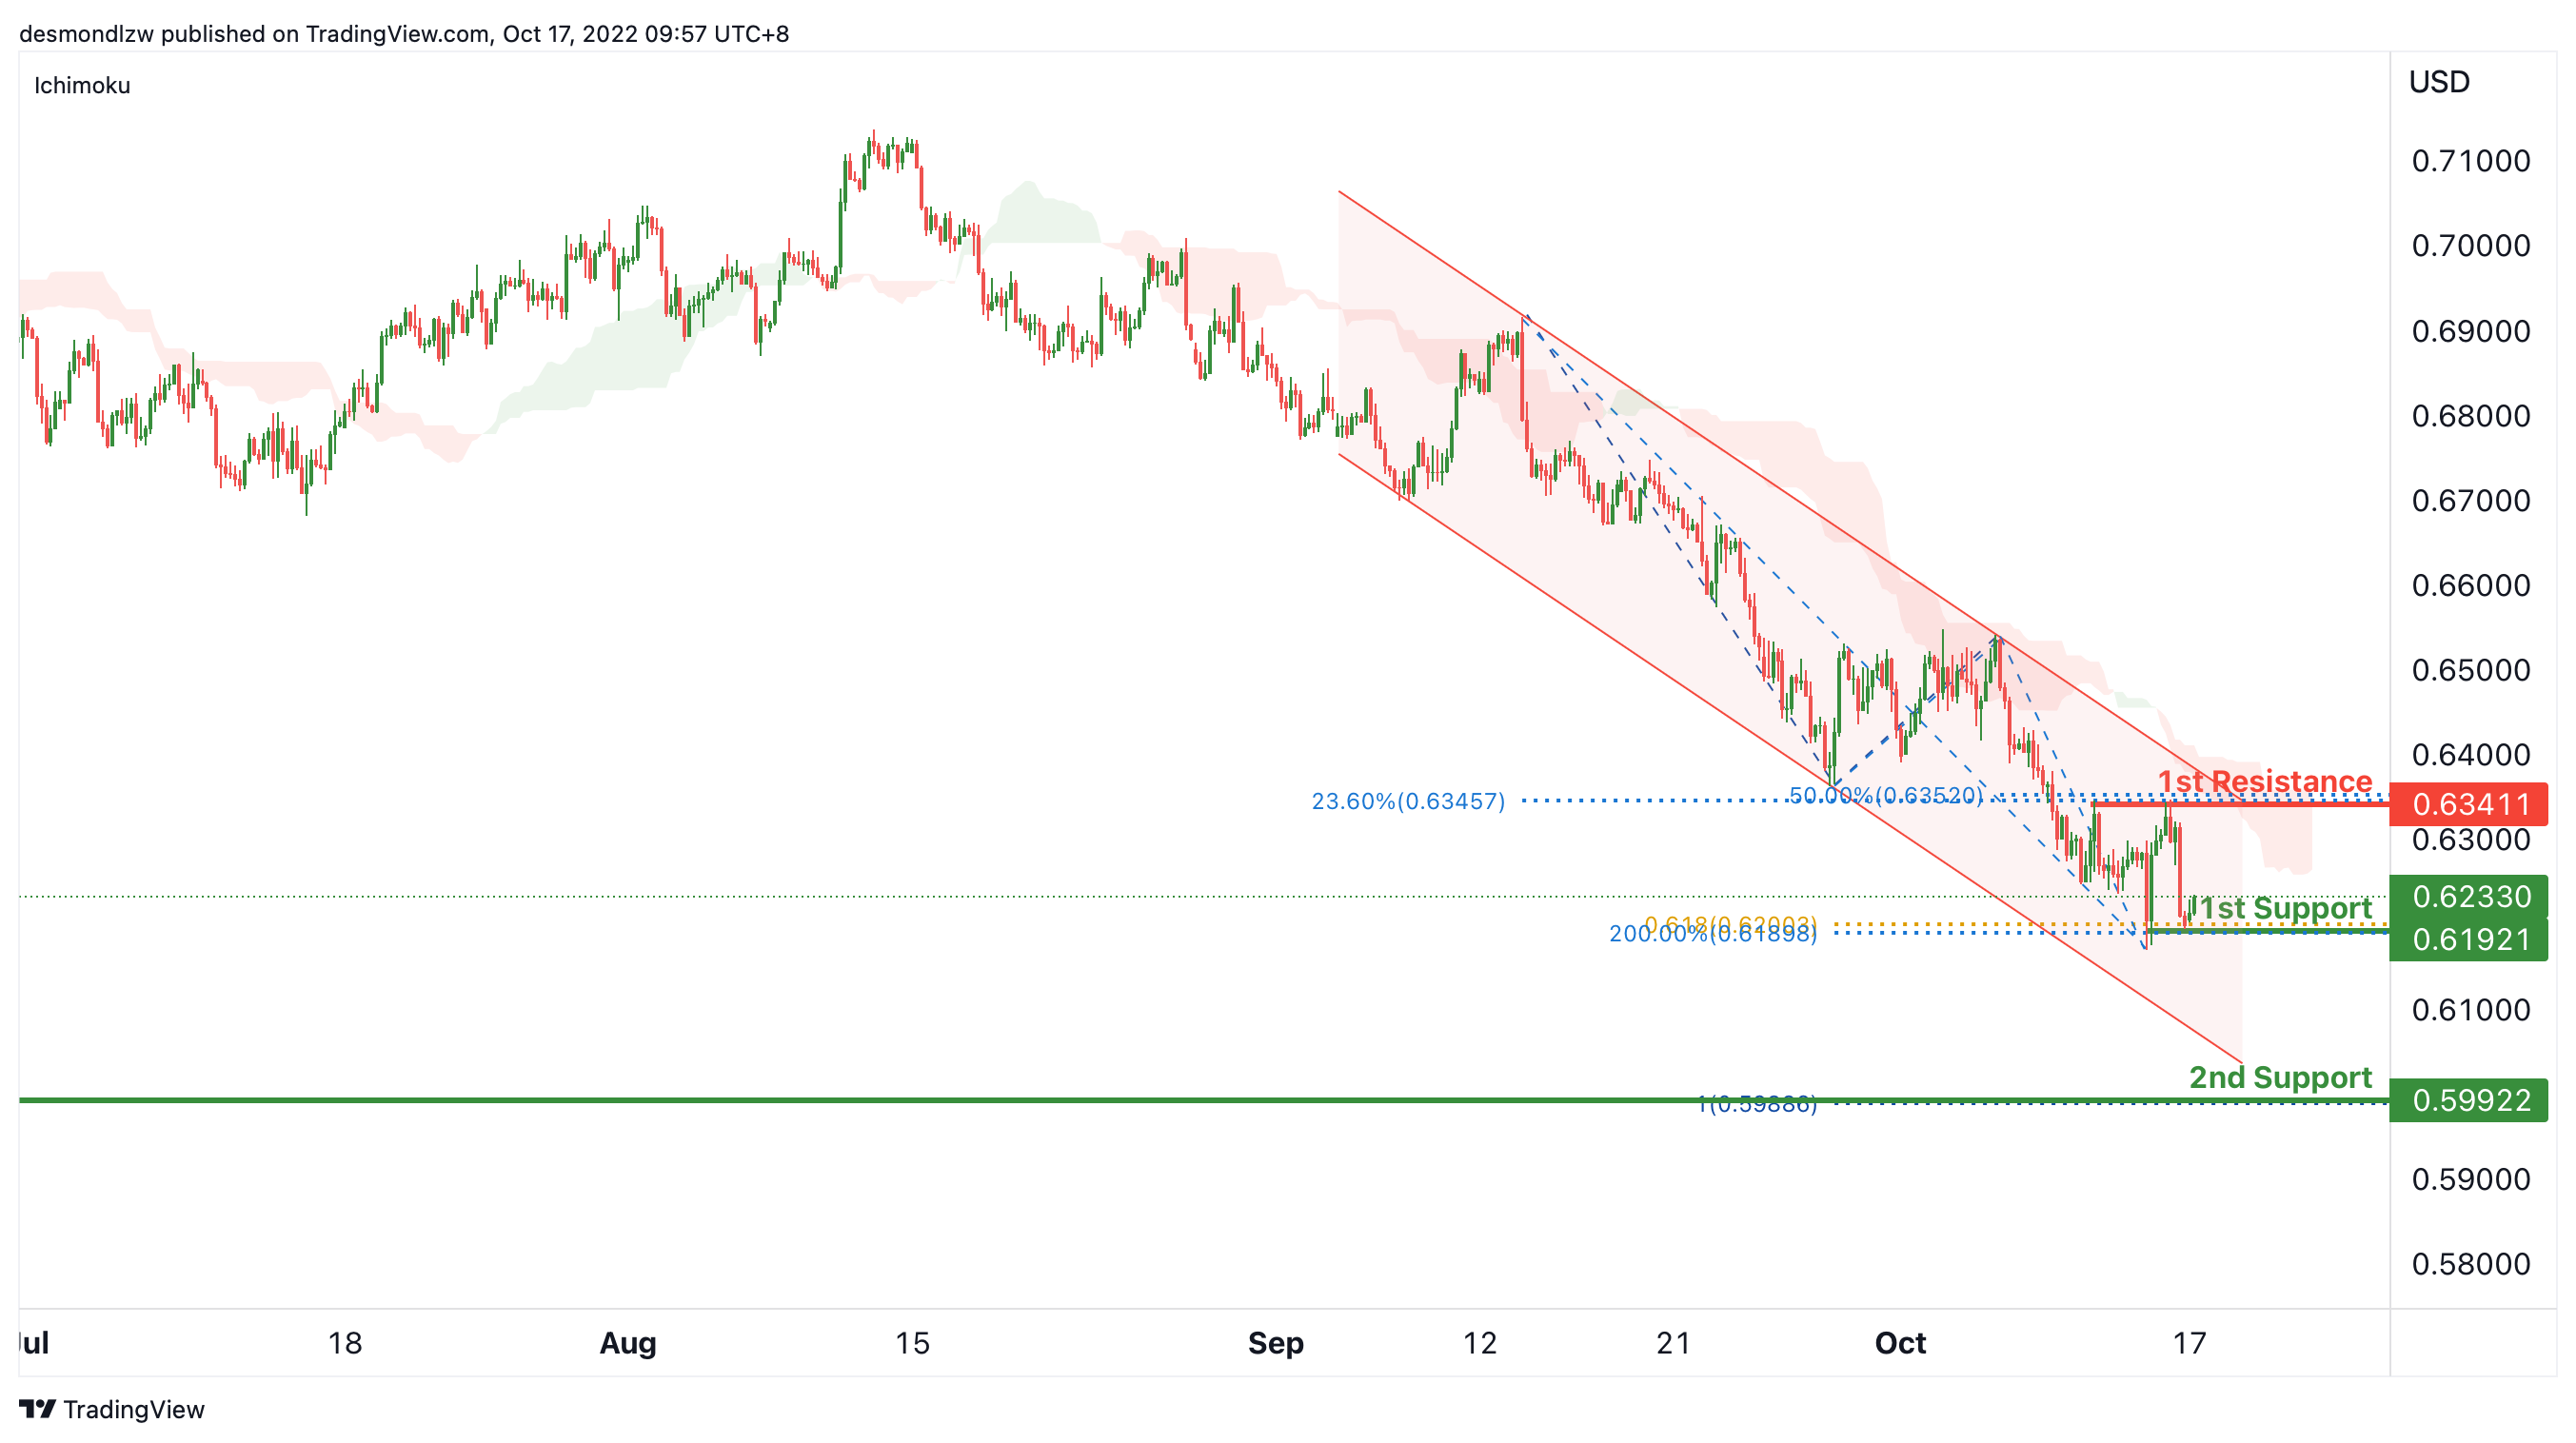
AUD/USD:
On the H4, the price is below the descending channel and ichimoku cloud, we are looking for the price drop to the 1st support at 0.61921, which is in line with the 61.8% fibonacci projection and swing low support. If the 1st support is broken, the 2nd support could be at 0.59922, where the 100% fibonacci projection and previous swing low are. Alternatively, the price may rise to retest the 1st resistance at 0.63411, which is in line with the 23.6% fibonacci retracement and 50% fibonacci retracement.
Areas of consideration
- H4, 1st support at 0.62085
- H4, 2nd support at 0.59922
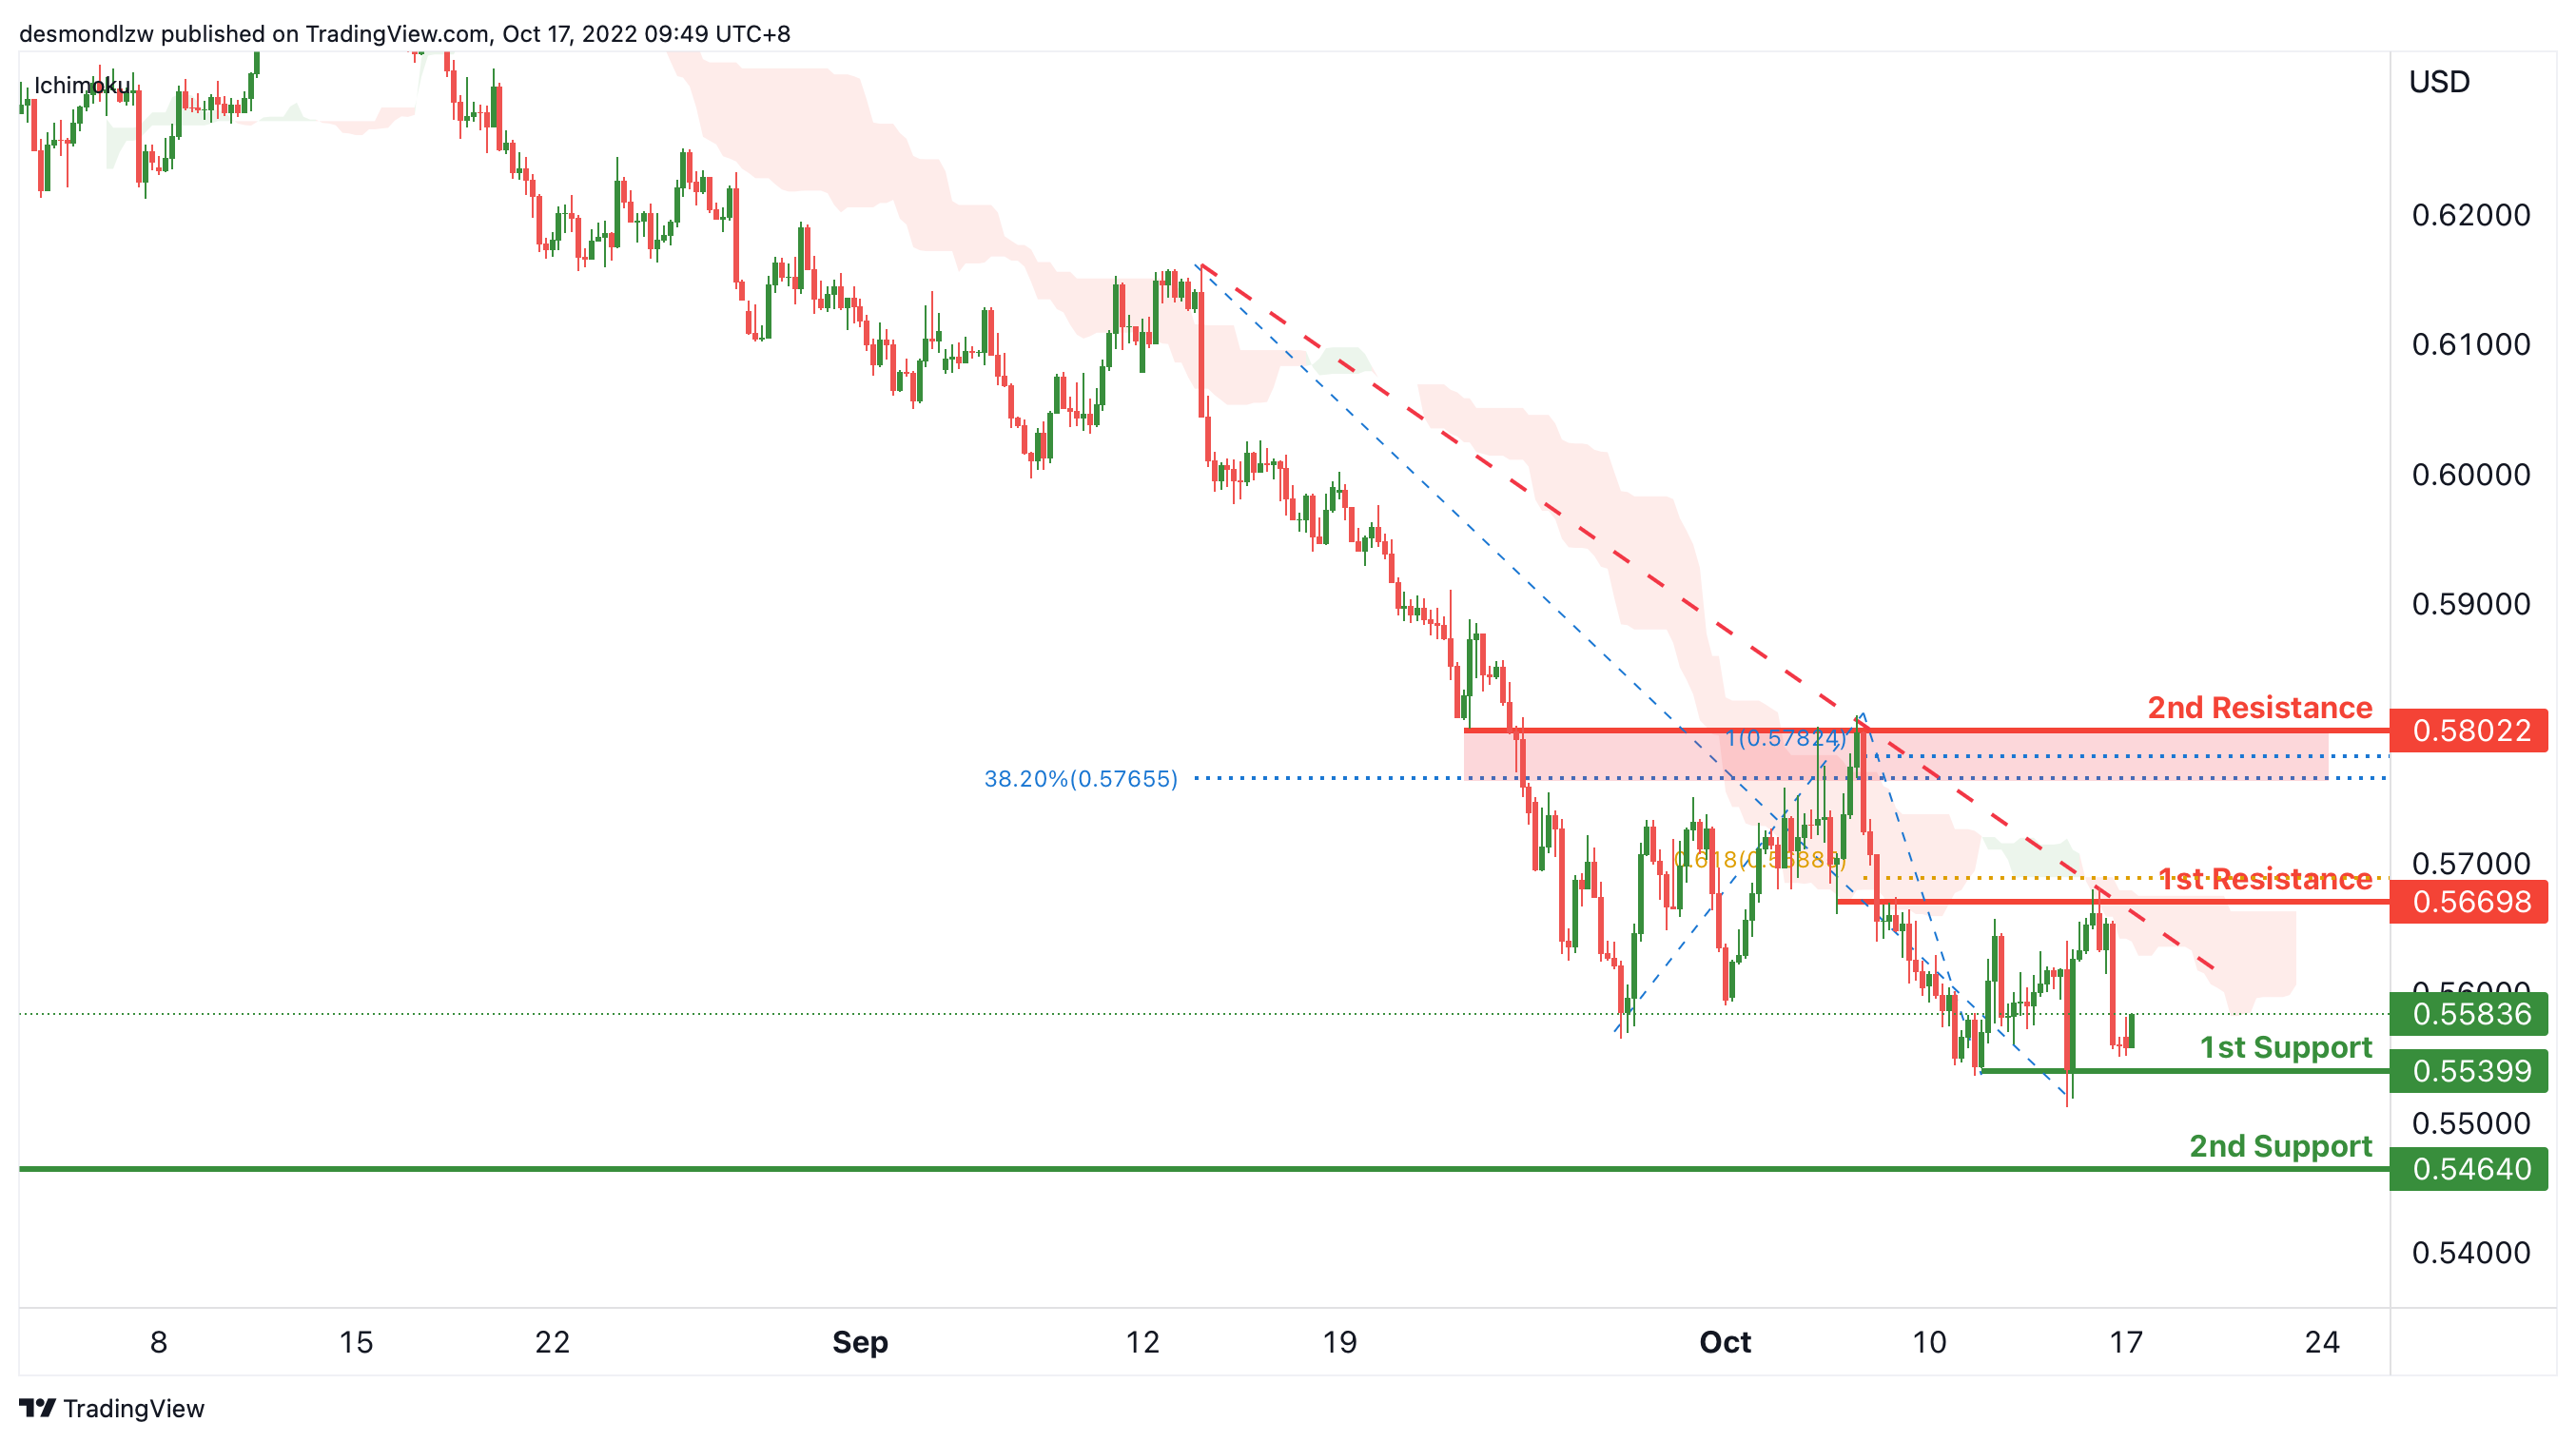
NZD/USD:
On the H4, the price is below ichimoku cloud and descending trendline, we have a bearish bias that the price may drop to the 1st support at 0.55399, which is in line with the swing low support. If the 1st support is broken, the 2nd support could be at 0.54640, where the previous swing low is. Alternatively, the price may rise to the 1st resistance at 0.56698, which is in line with the overlap resistance and 61.8% fibonacci projection. If the 1st resistance is broken, the 2nd resistance could be at 0.58022, where the previous swing high, 100% fibonacci projection and 38.2% fibonacci retracement are.
Areas of consideration:
- H4 time frame, 1st support at 0.5539
- H4 time frame, 2nd support at 0.54640
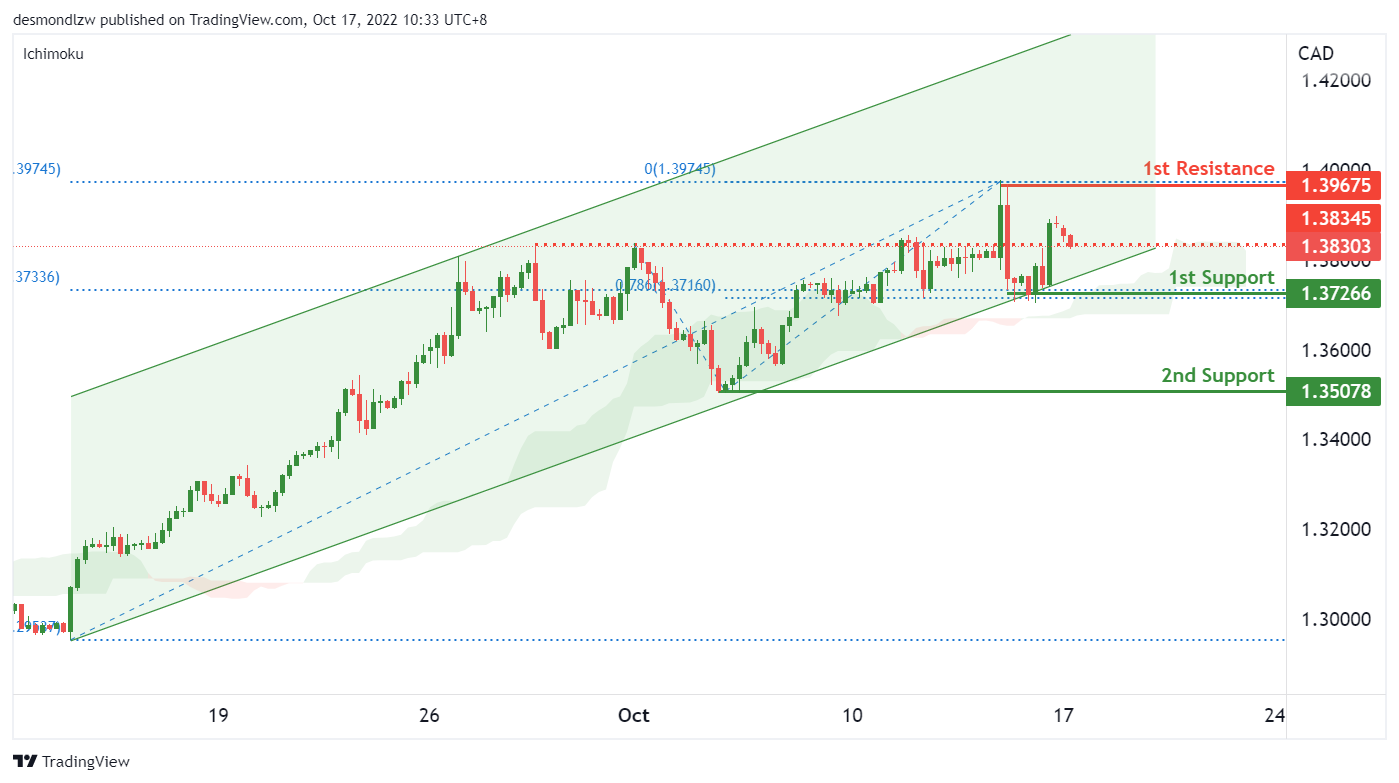
USD/CAD:
On the H4, the price trades at the risk level of 1.38 which is the previous swing high and overlap resistance level. With the price trading above the ichimoku cloud and within the bullish channel, we continue to have a short term bullish bias. The price could fall to the 1st support which is in line with the 23.6% fibonacci retracement and 78.6% fibonacci extension level before trading higher to the 1st resistance and previous swing high.
Areas of consideration:
- H4 time frame, 1st resistance at 1.3967
- H4 time frame, 1st support at 1.3726
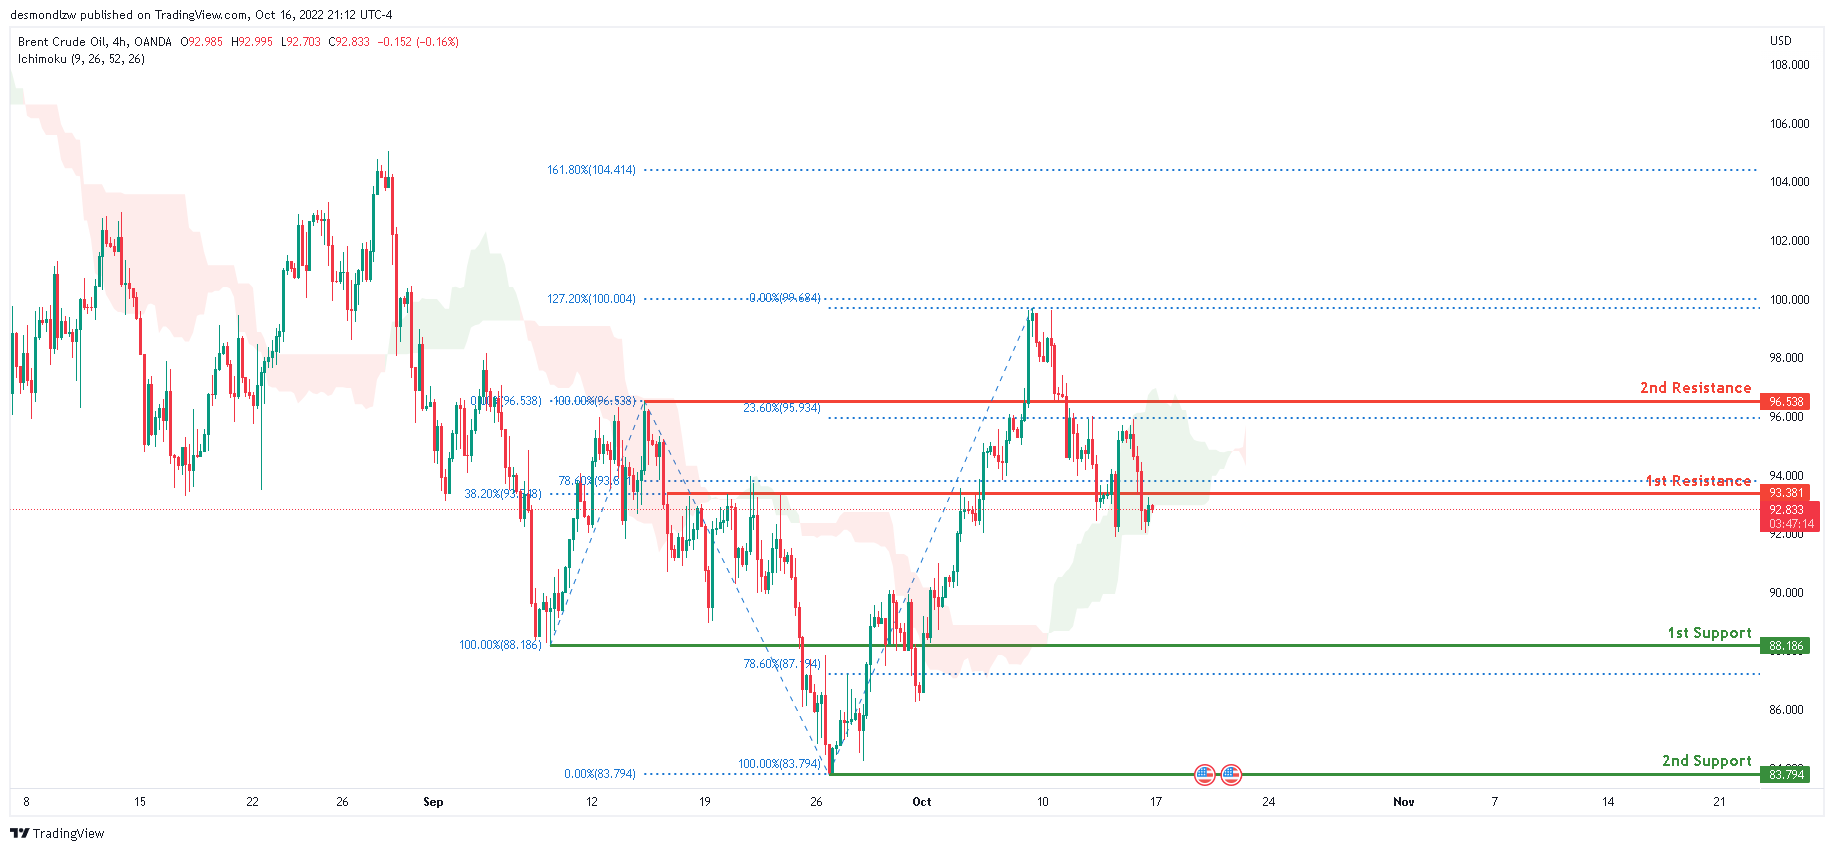
OIL:
Looking at the H4 chart, the current overall bias for Oil is bearish. To add confluence to this bias, the price is currently below the Ichimoku cloud which indicates a bearish market. Price maintained its bearish retracement and has closed under the 1st resistance at 93.381 where the 78.6% and 38.2% Fibonacci line are. If this bearish momentum continues, expect the price to head towards the 1st support at 88.186 where the 100% Fibonacci line and 78.6% Fibonacci line are located.
Areas of consideration:
- H4 time frame, 1st resistance at 93.381
- H4 time frame, 1st support at 88.18
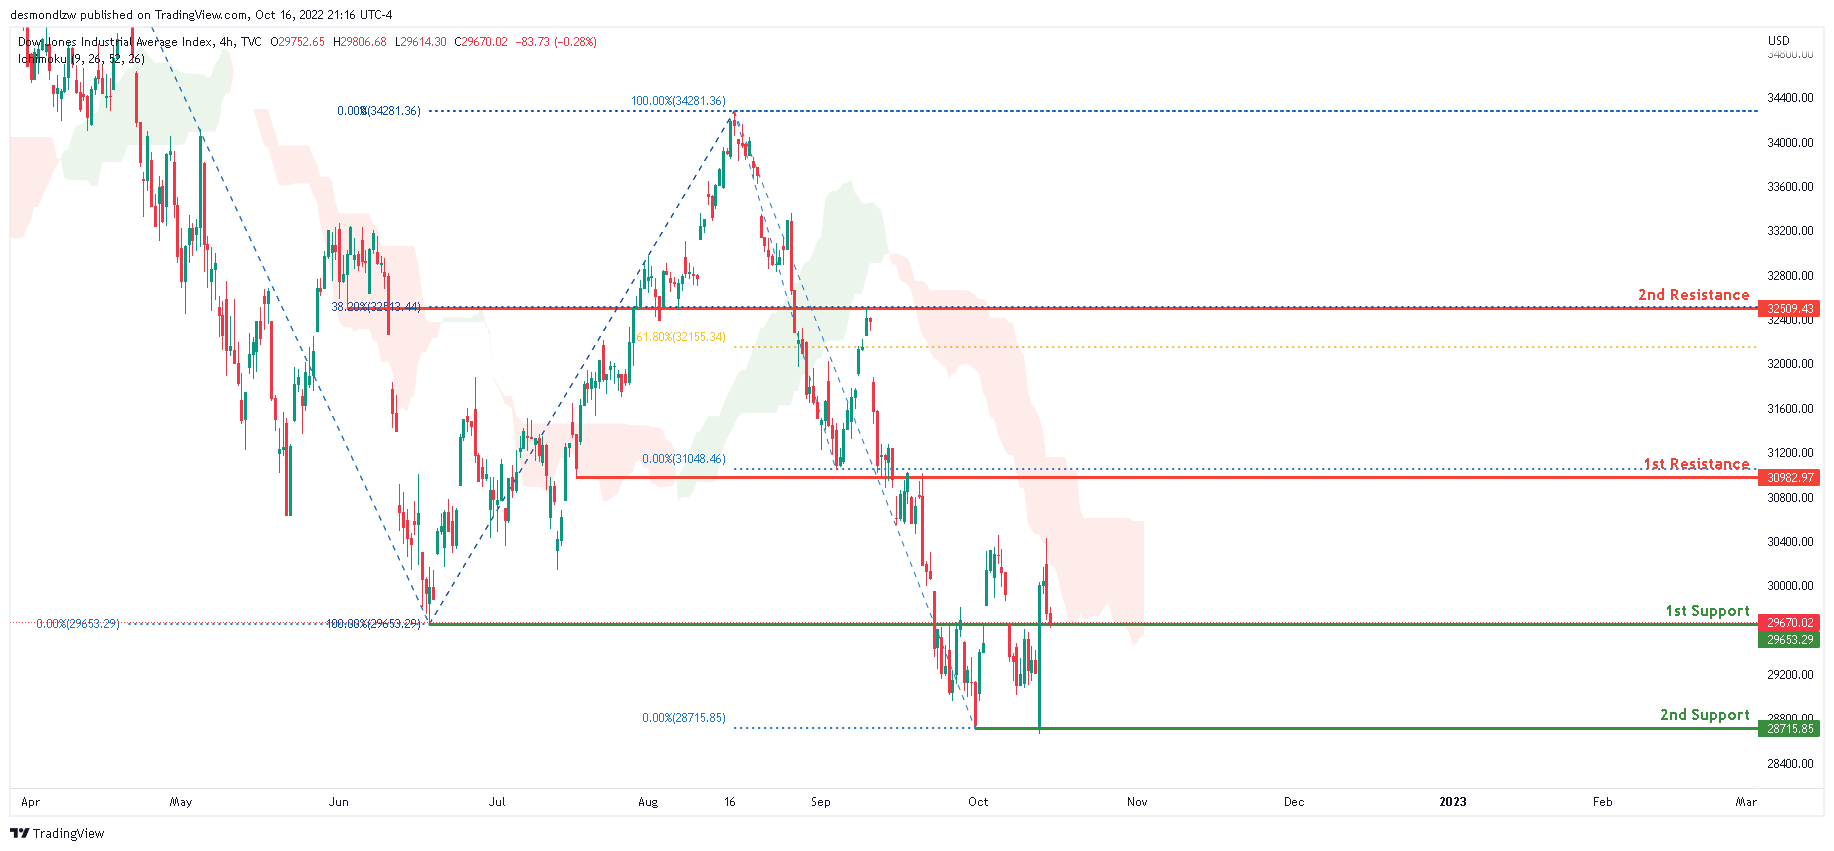
Dow Jones Industrial Average:
The current overall bias for DJI is bearish, according to the H4 chart. To add to this bias, the price is currently trading below the Ichimoku cloud, indicating a bearish market. Price is currently resting on the 1st support at 29653.29 where the previous low and 100% Fibonacci line is located. If this bearish momentum continues, expect the price to possibly head back down towards the 2nd support at 28715.85 where the 0% Fibonacci line and previous low is located.
Areas of consideration:
- H4 time frame, 1st support at 29653.29
- H4 time frame, 2nd support at 28715.85
- H4 time frame, 1st Resistance at 30982.9
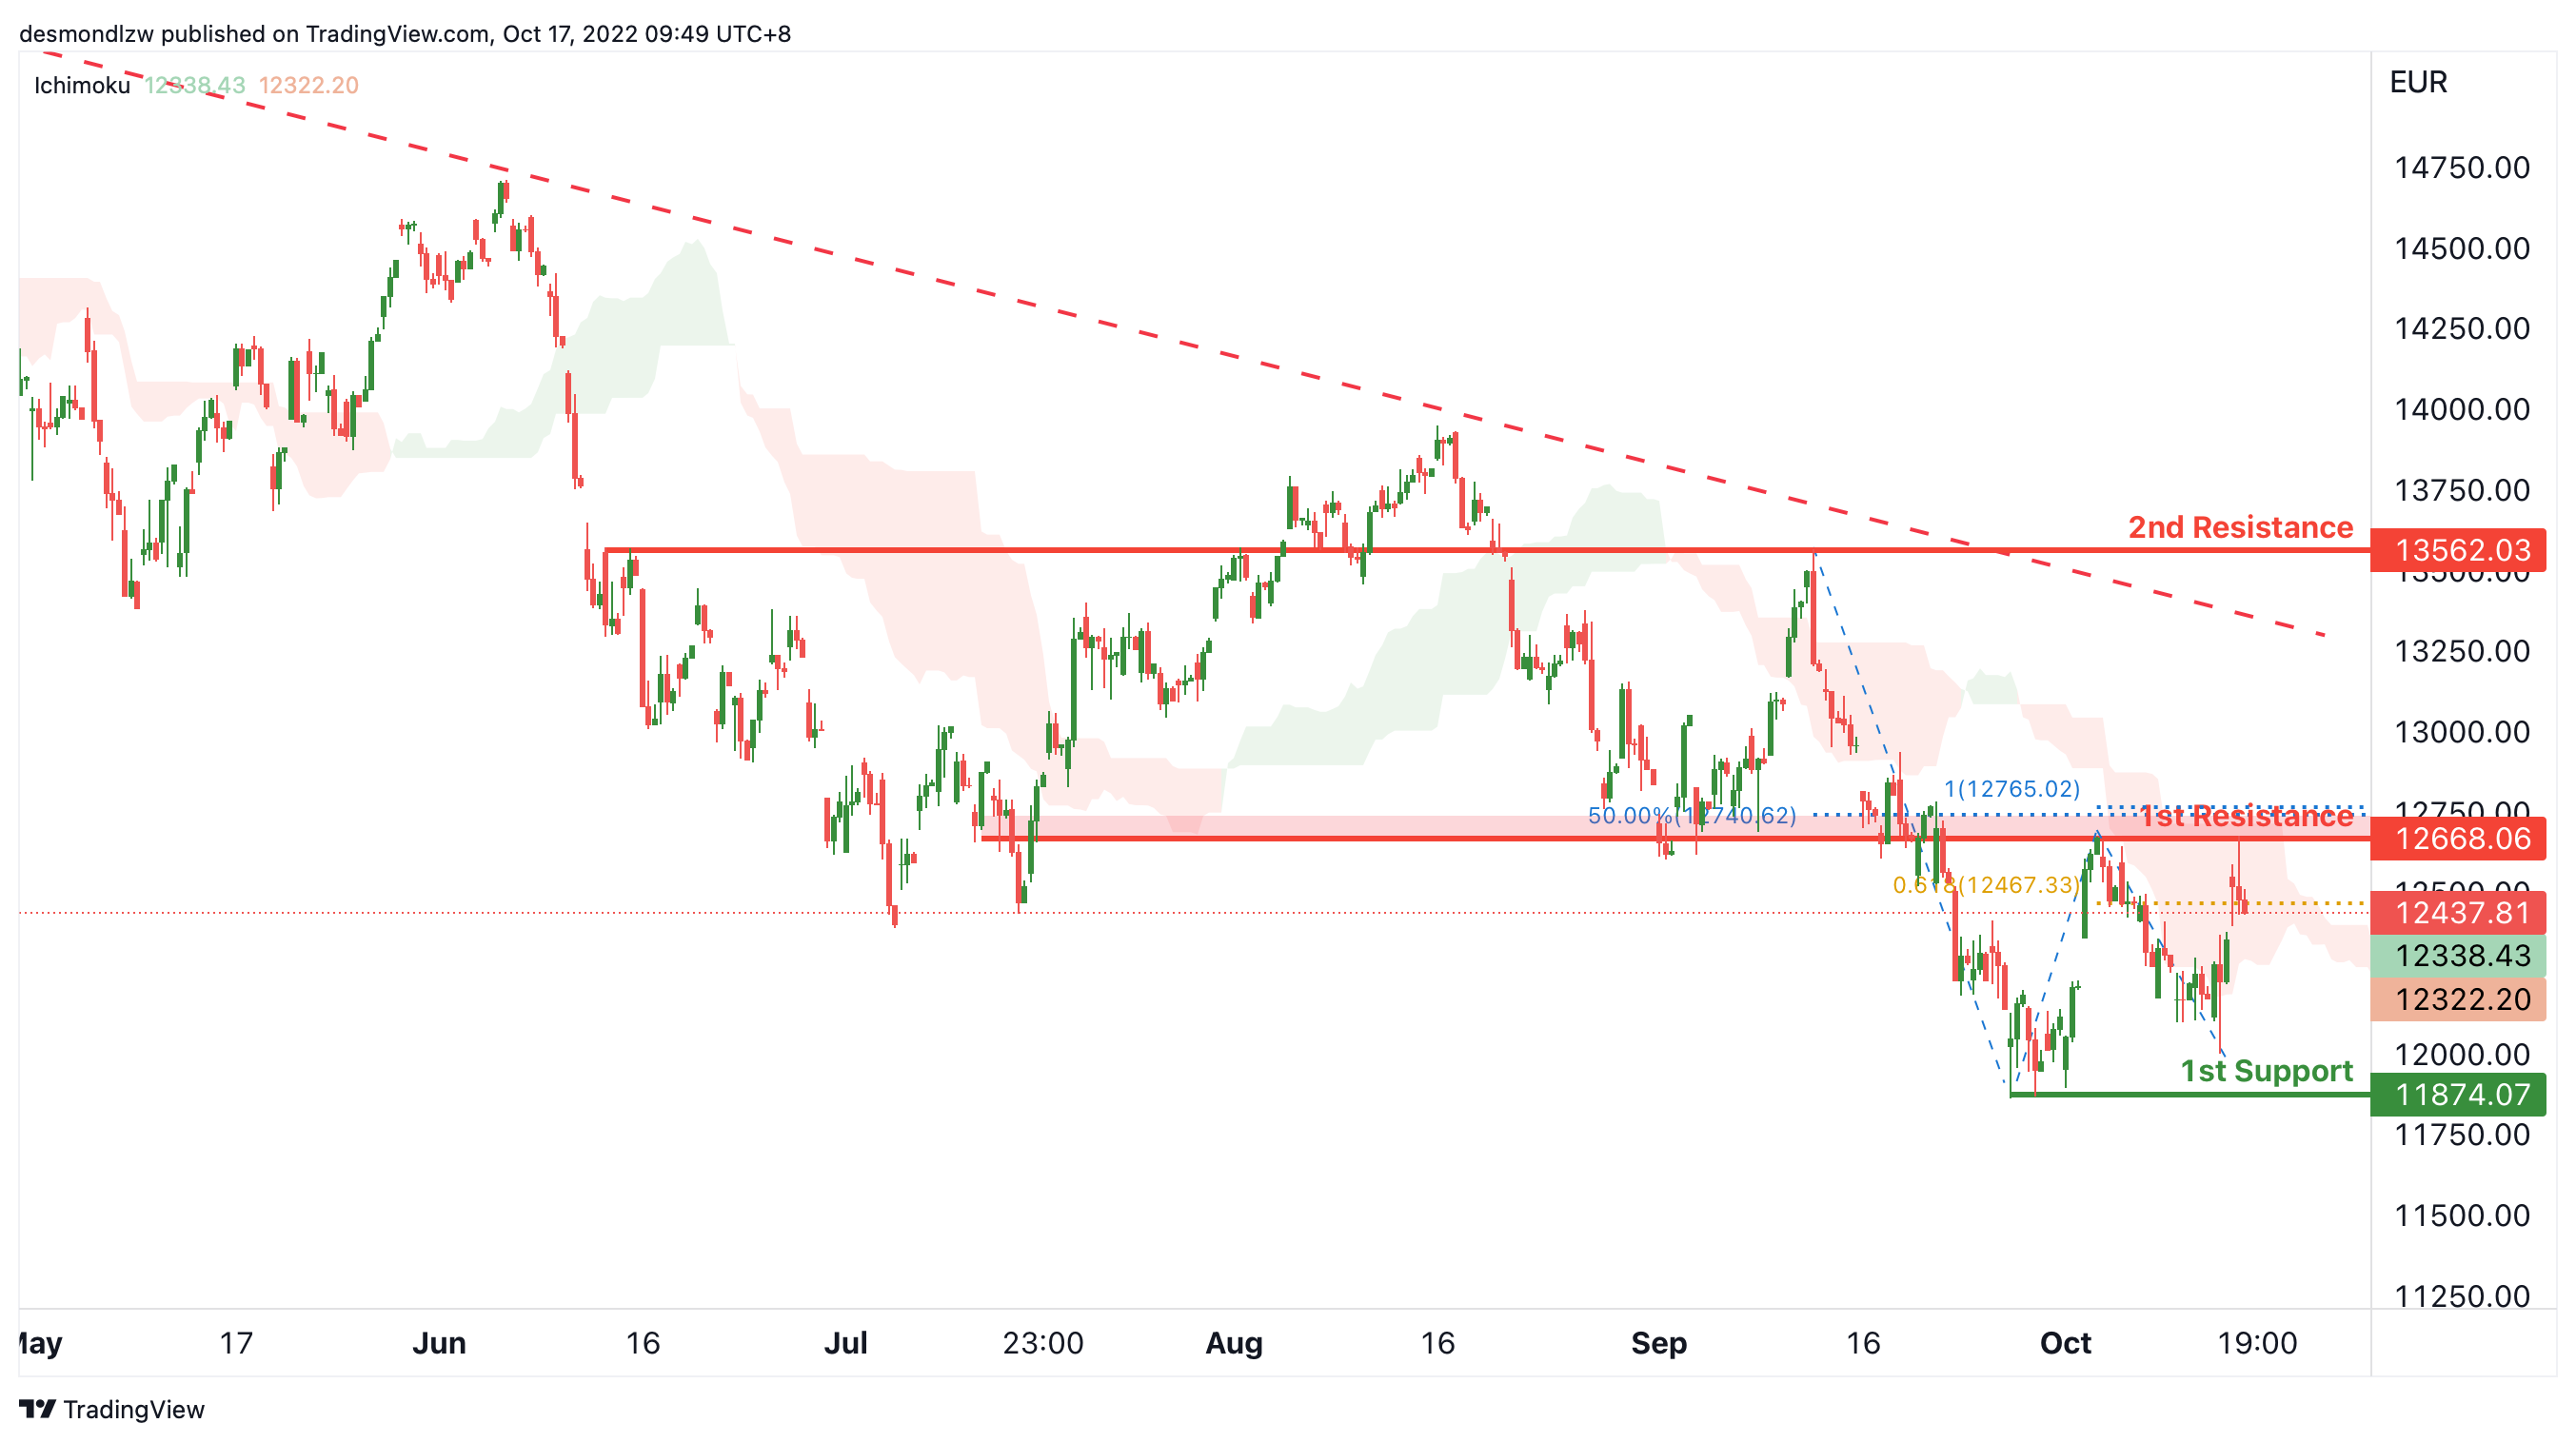
DAX:
On the H4, as the price is crossing ichimoku cloud, we can expect the price to retest the 1st resistance at 12668.06, which is in line with the 50% fibonacci retracement, 100% fibonacci projection and overlap resistance. After testing the 1st resistance, as the price is below the descending trendline, the price may drop to the 1st support at 11874.07, which is in line with the swing low. Alternatively, if the price can break the 1st resistance, we can expect the price rise to the 2nd resistance at 13562.03, where the previous swing high is.
Areas of consideration:
- H4 time frame, 1st support at 11874.07
- H4 time frame, 1st resistance at 12668.06
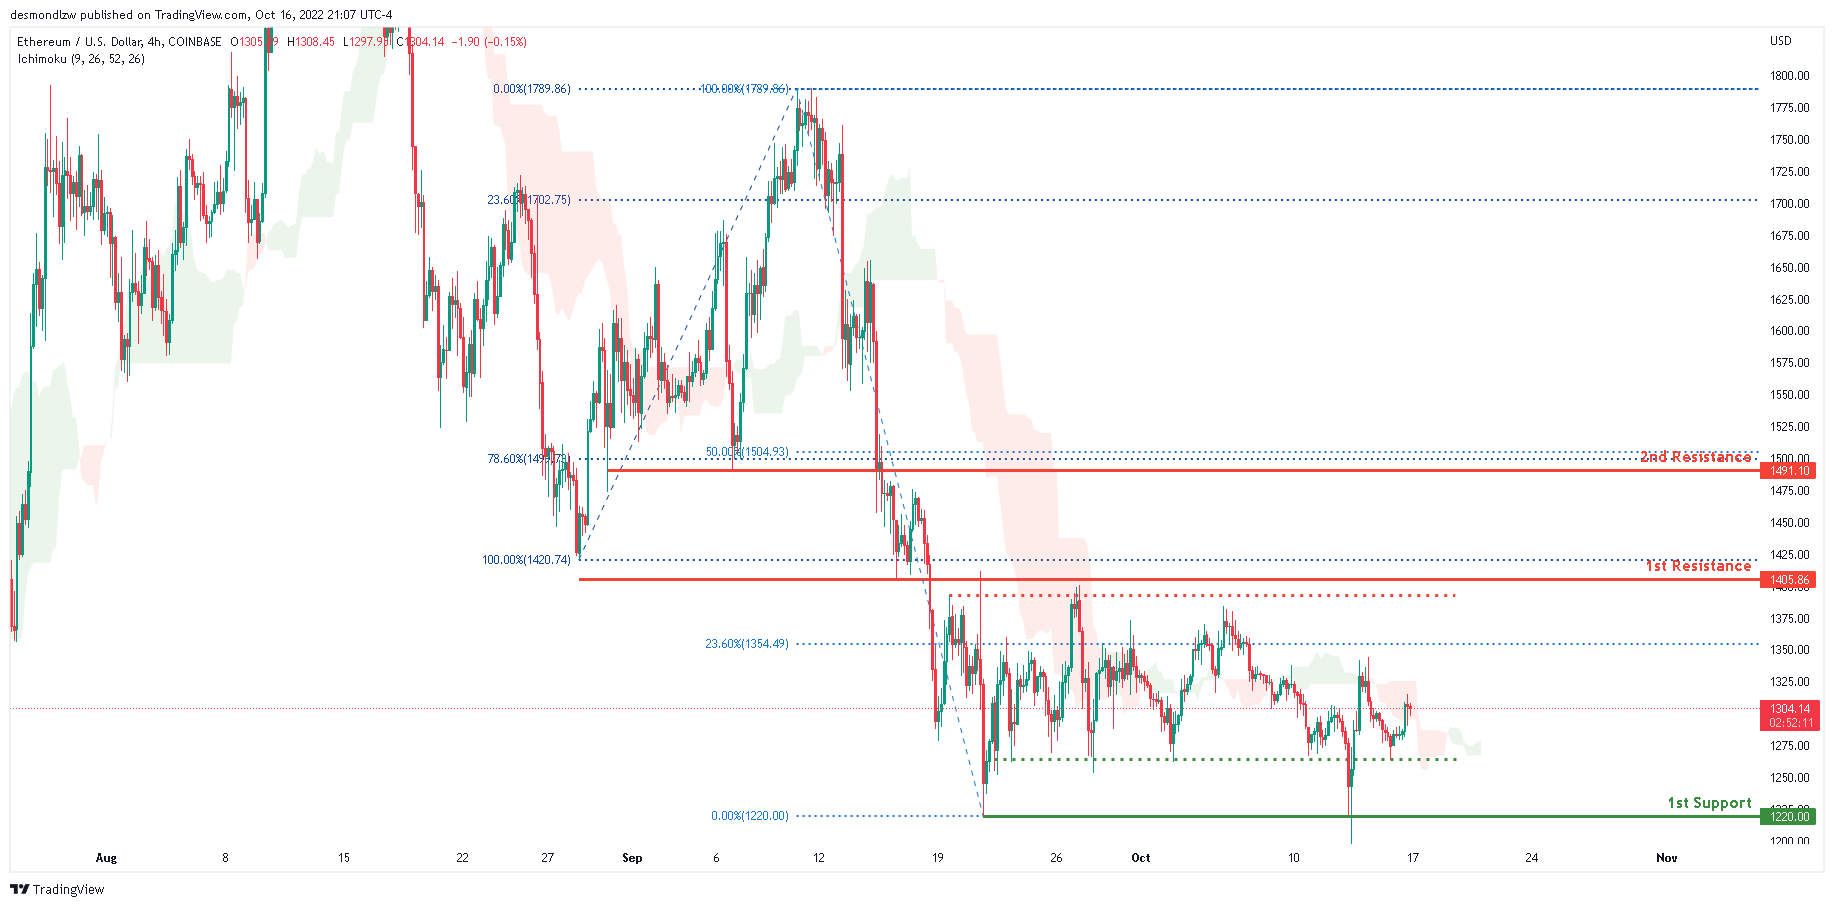
ETHUSD:
Looking at the H4 chart, the current overall bias for ETHUSD is bearish. To add confluence to this bias, the price is currently within the red Ichimoku cloud which indicates a bearish market. Price continued to consolidate between the 1st support and 2nd resistance throughout the last week. Expecting price to continue consolidating within this area unless bullish momentum kicks in where we can possibly see price tap on the 1st resistance at 1405.86 where the 100% Fibonacci line and previous swing low is.
Areas of consideration:
- H4 time frame, 1st resistance of 1405.86
- H4 time frame, 1st support at 1220.00
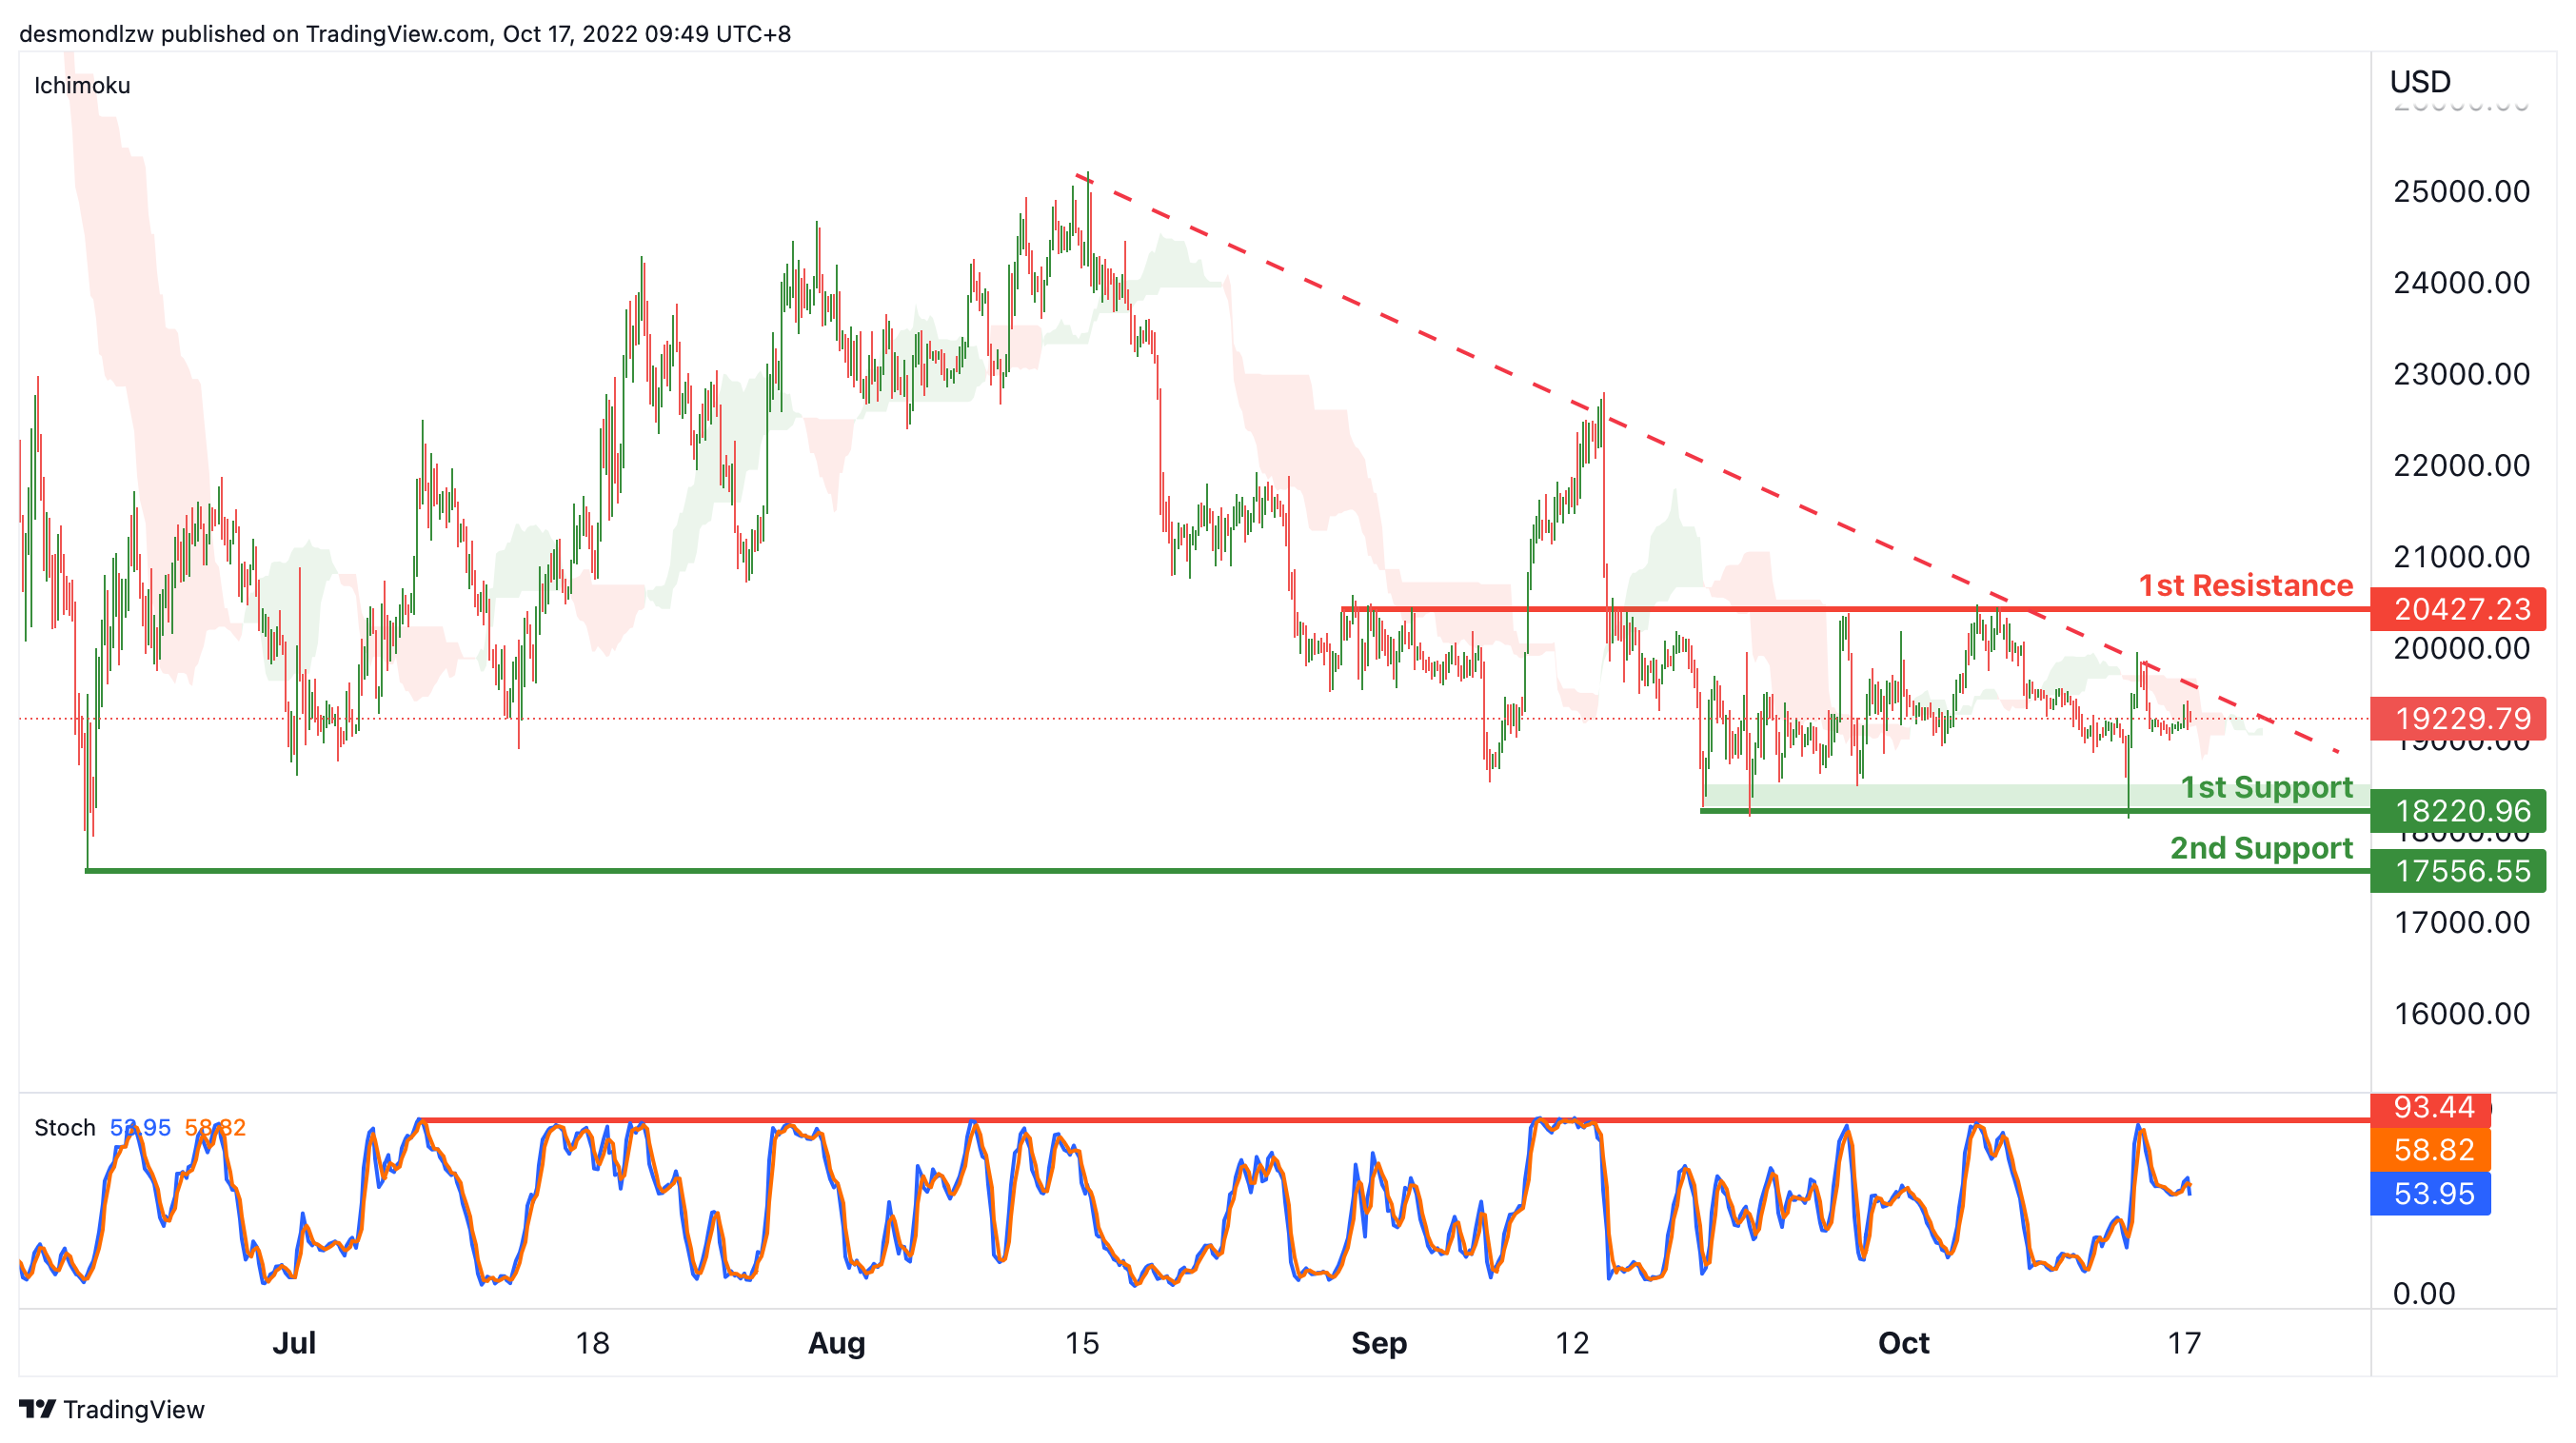
BTCUSD:
On the H4, price is crossing the ichimoku cloud, if the price can break the descending trendline, we can expect the price break the descending trendline and rise to the 1st resistance at 20427.23, where the overlap resistance and 50% fibonacci retracement are. Alternatively, as the price is still below descending trendline, we can expect the price drop to the 1st support at 18220.96, which is in line with the swing lows. If the 1st support is broken, we can expect the price to drop to the 2nd support at 17556.55, where the previous swing low is.
Areas of consideration:
- H4 time frame, current price
- H4 time frame, 1st resistance at 20427.23
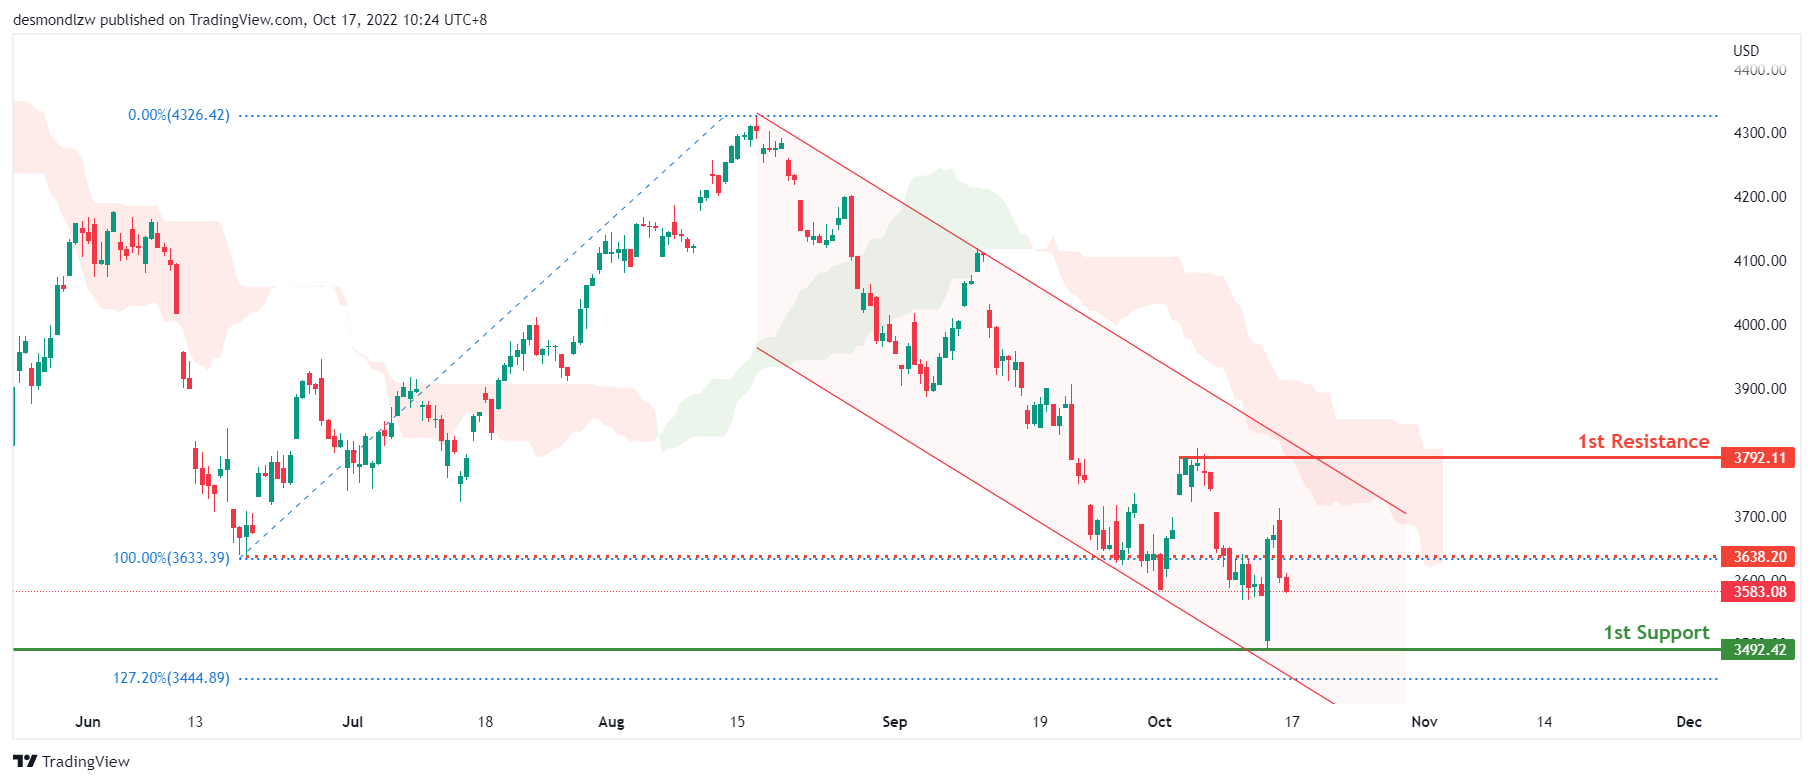
S&P 500:
Based on the H4 chart, the current overall bias for the S&P500 is bearish as price continues in the bearish channel and stays below the ichimoku cloud. While price bounced from the 1st support of 3492.42, where the fibonacci extension and previous swing high from October 2020, the short term bullish momentum failed to break above the 3700 price level. Expect price to trade lower to test the 1st support level again.
Areas of consideration:
- H4 time frame, 1st support at 3492.42
- H4 time frame, 1st resistance at 3792.11


