
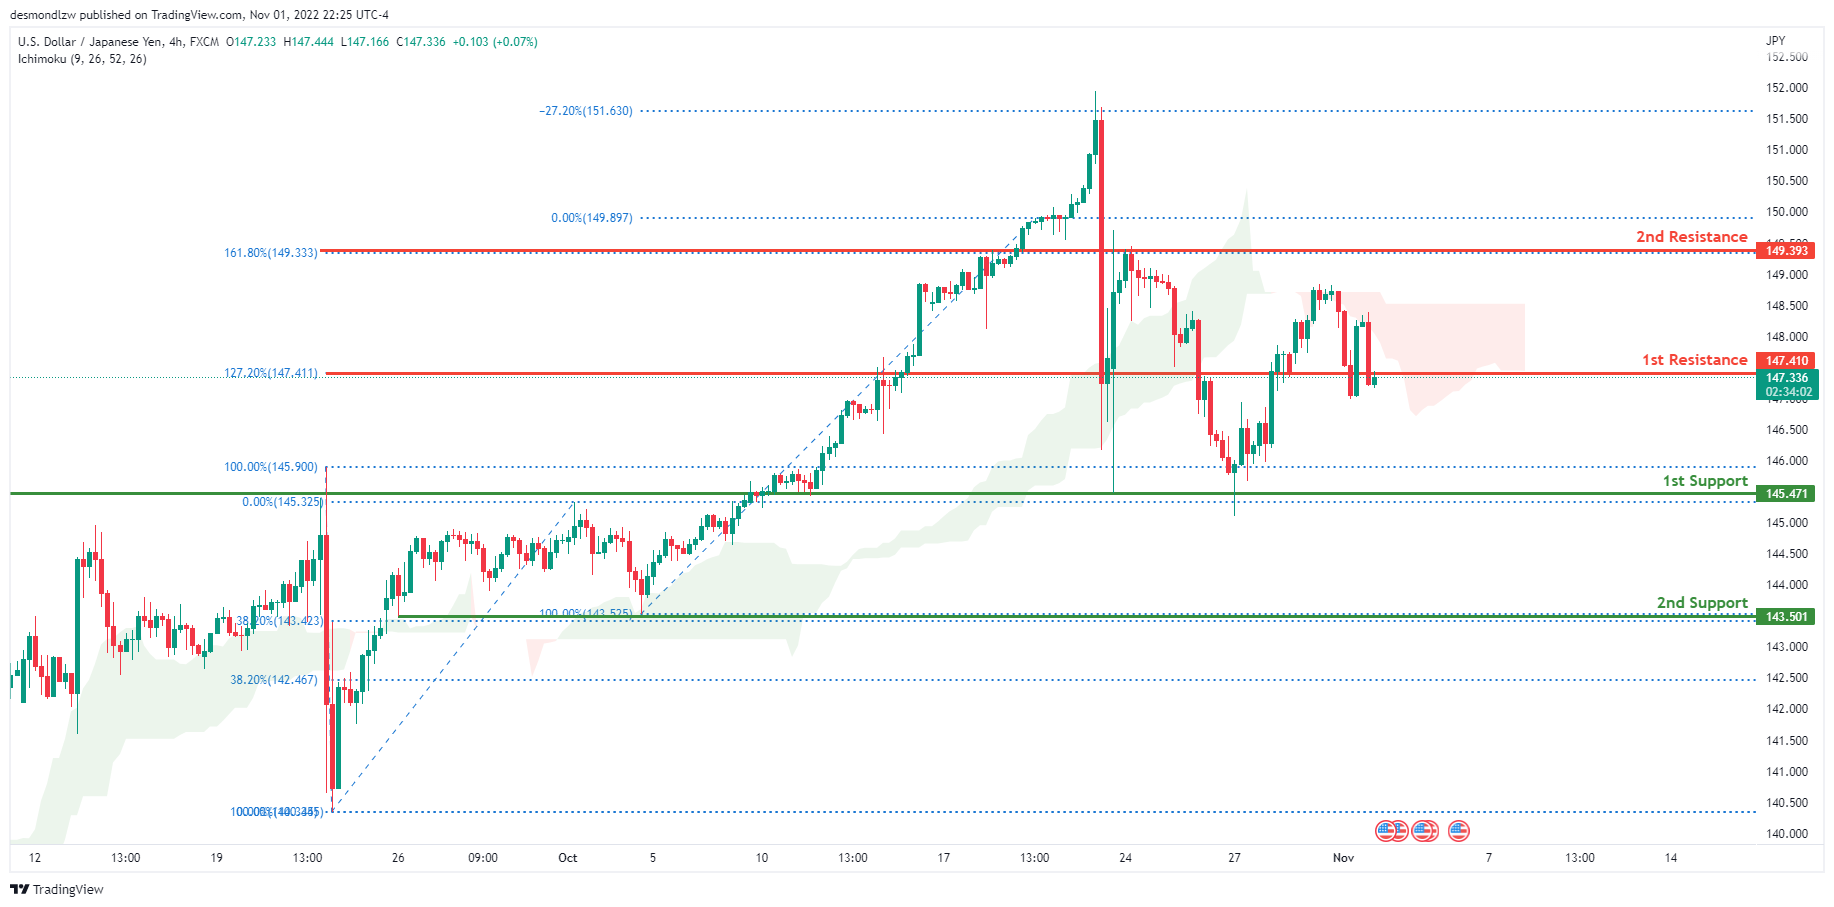
USD/JPY:
The current general bias for USDJPY on the H4 chart is bearish. To add confluence to this, the price is below the Ichimoku cloud which indicates a bearish market. Overnight, USDJPY had some bearish momentum downwards with the price closing under the 1st resistance line at 147.410 where the 127.2% Fibonacci extension line is located. Price is currently trading at 147.352 at time of writing. If this bearish momentum continues, expect USDJPY to possibly head downwards towards the 1st support at 145.751 where the 100% and 0% Fibonacci lines are located.
Areas of consideration:
- H4 time frame, 1st resistance at 147.410
- H4 time frame, 1st support at 145.751
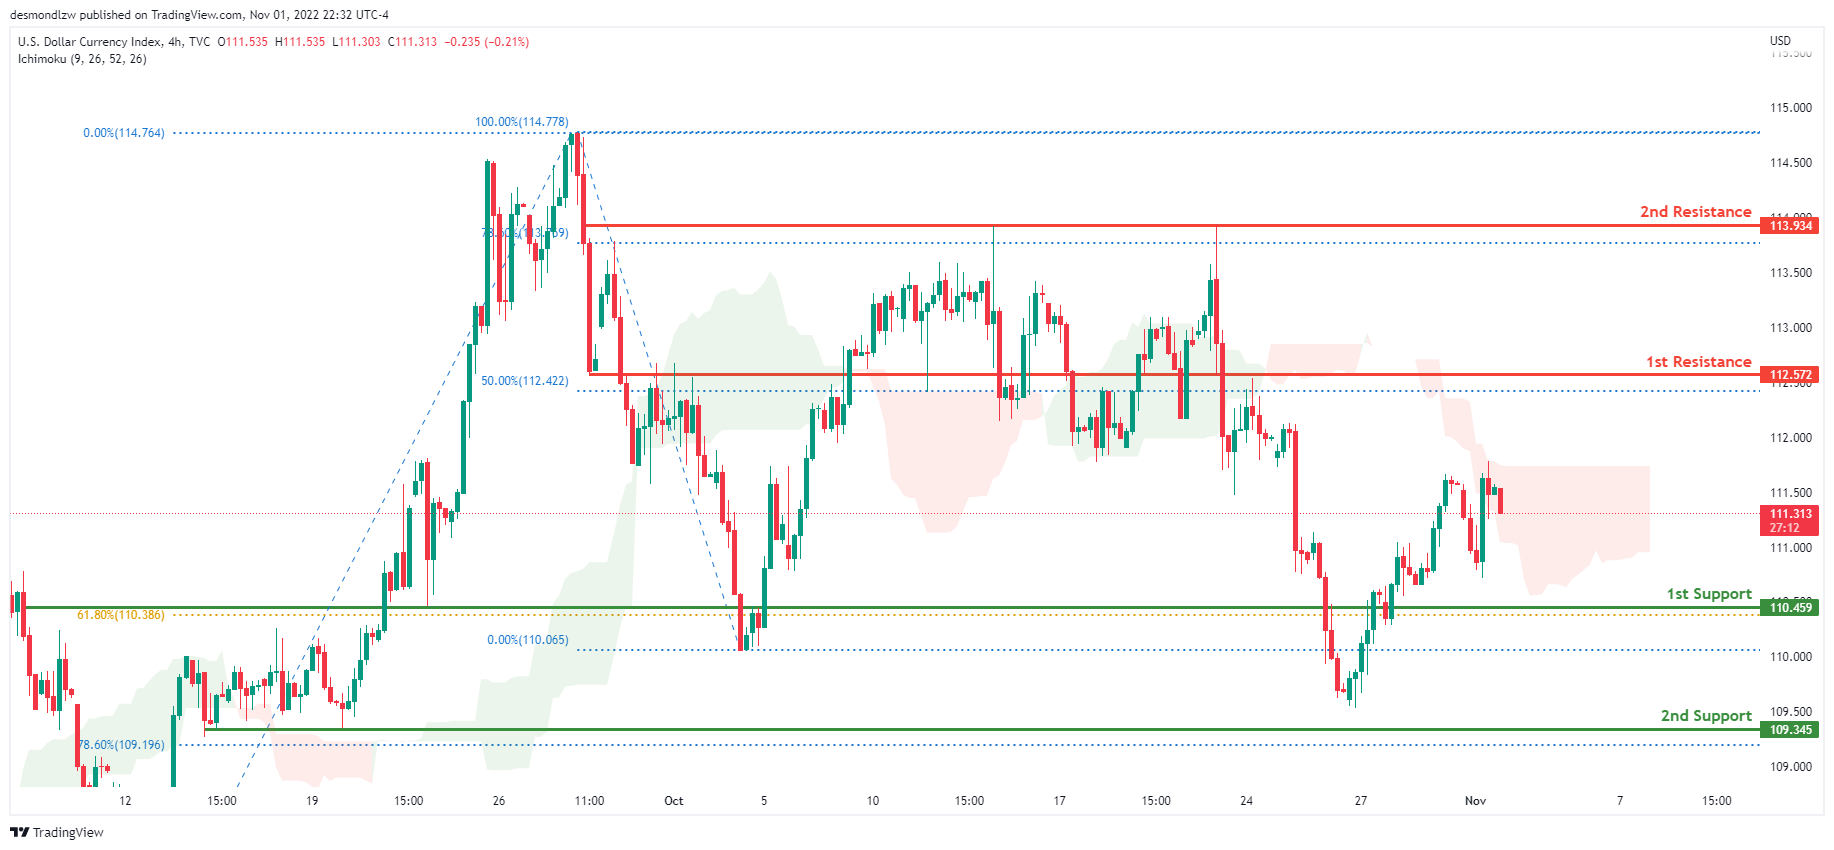
DXY:
On the H4 chart, the overall bias for DXY is bearish. To add confluence to this, the price is below the Ichimoku cloud which indicates a bearish market. Overnight, DXY had bullish momentum upwards with the price currently trading at 111.310 at time of writing. If this bearish momentum continues, expect price to possibly head towards the 1st support at 110.459, where the 61.8% Fibonacci line is located.
Areas of consideration:
- H4 time frame, 1st resistance at 112.572
- H4 time frame, 1st support at 110.459
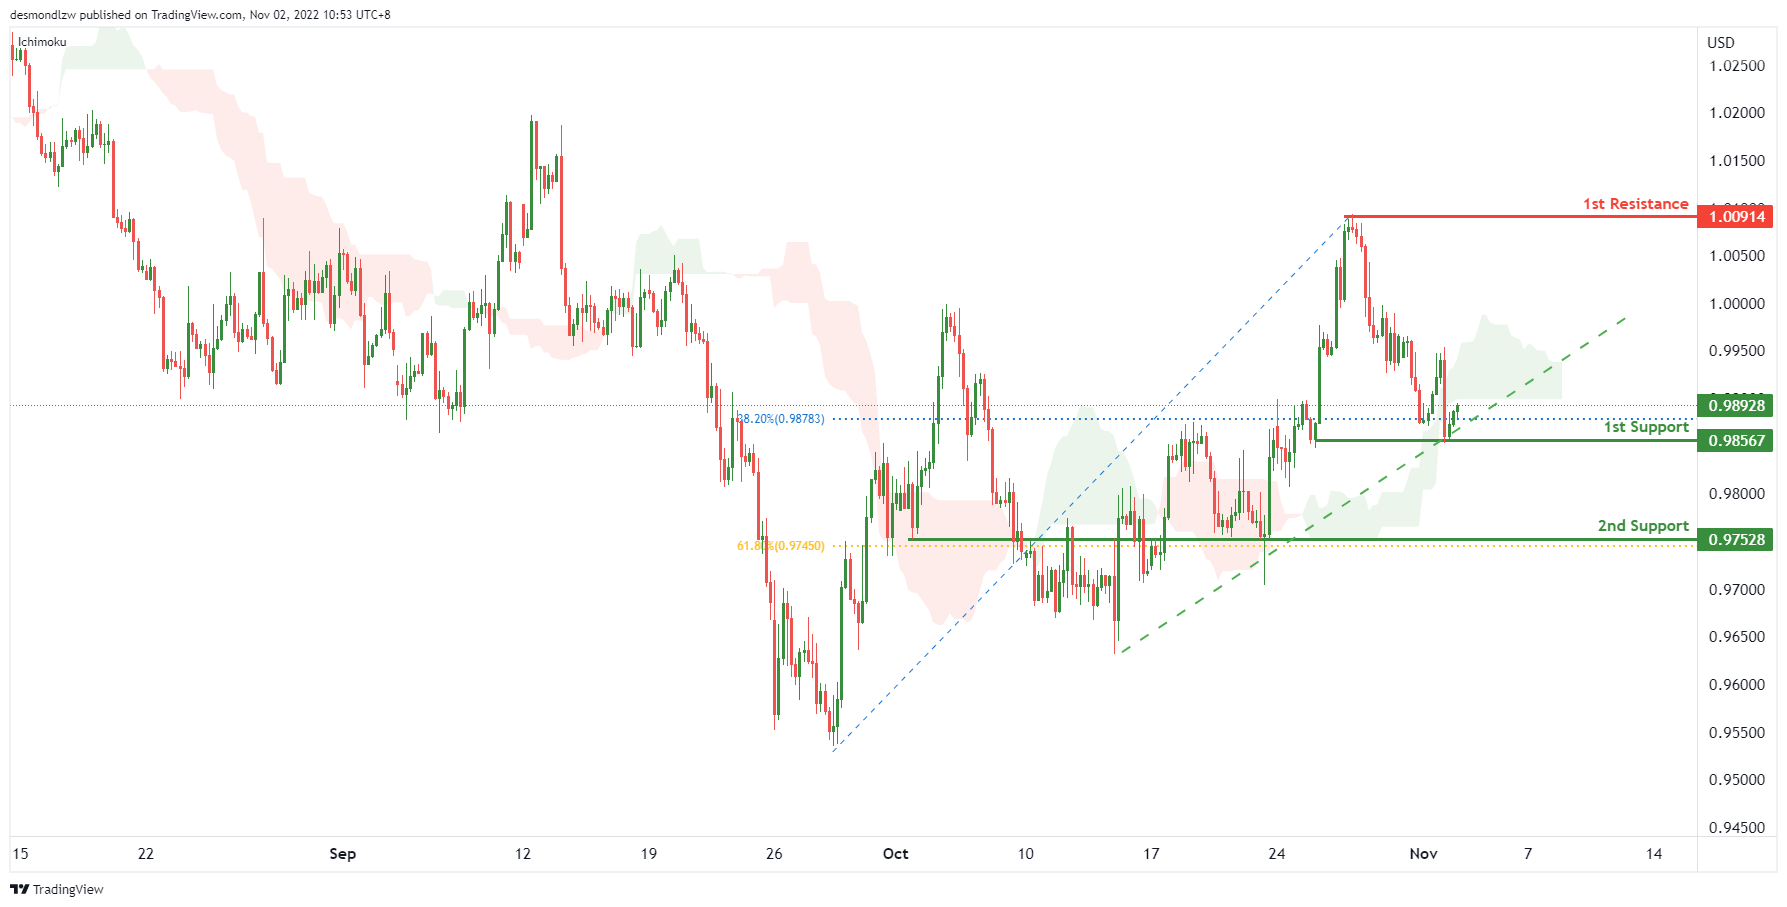
EUR/USD:
On the H4, with the price moving within the ascending trendline and above ichimoku cloud, we have a bullish bias that the price may rise from the 1st support at 0.98567, which is in line with the swing lows to the 1st resistance at 1.00914, where the swing high is. Alternatively, the price may drop to the 2nd support at 0.97528, where the overlap support and 61.8% fibonacci retracement are.
Areas of consideration :
- H4 1st support at 0.98567
- H4 1st resistance at 1.00914
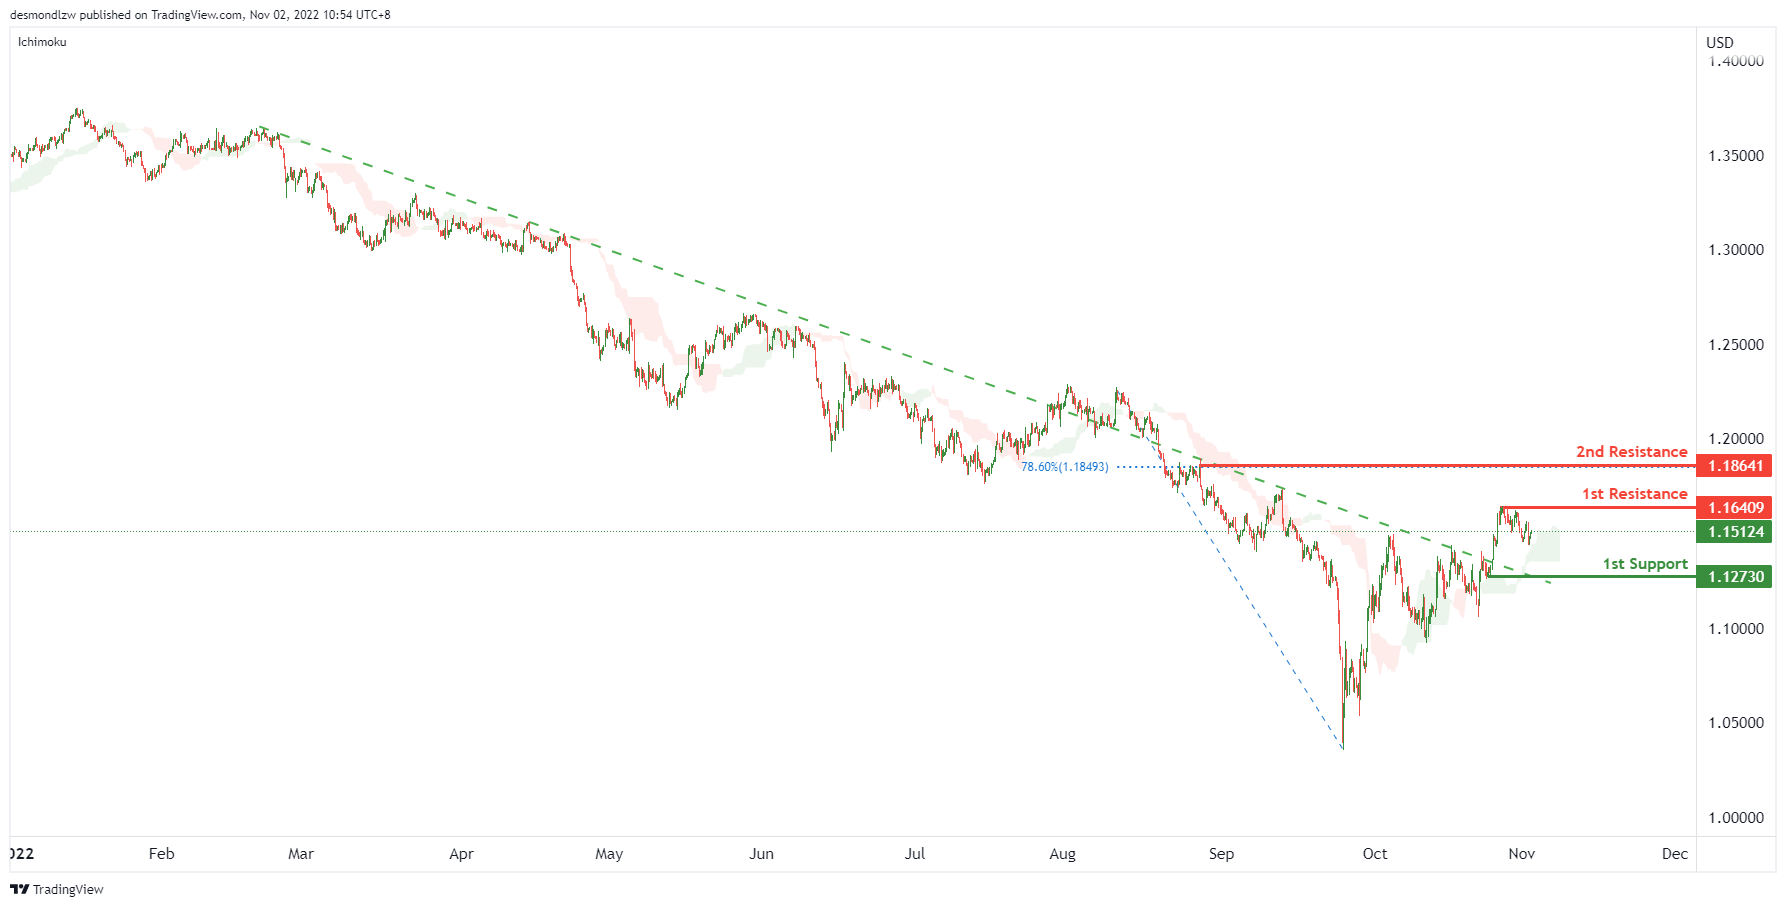
GBP/USD:
On the H4, price is above the ichimoku cloud and breaking the descending trendline, we have a bullish bias that the price may test the 1st resistance at 1.16409, which is in line with the previous swing high. If the 1st resistance is broken, the 2nd resistance is at 1.18641, where the 78.6% fibonacci retracement sits. Alternatively, the price may drop to the 1st support at 1.12730, where the swing low support is.
Areas of consideration:
- H4 current price
- H4 1st resistance at 1.16409
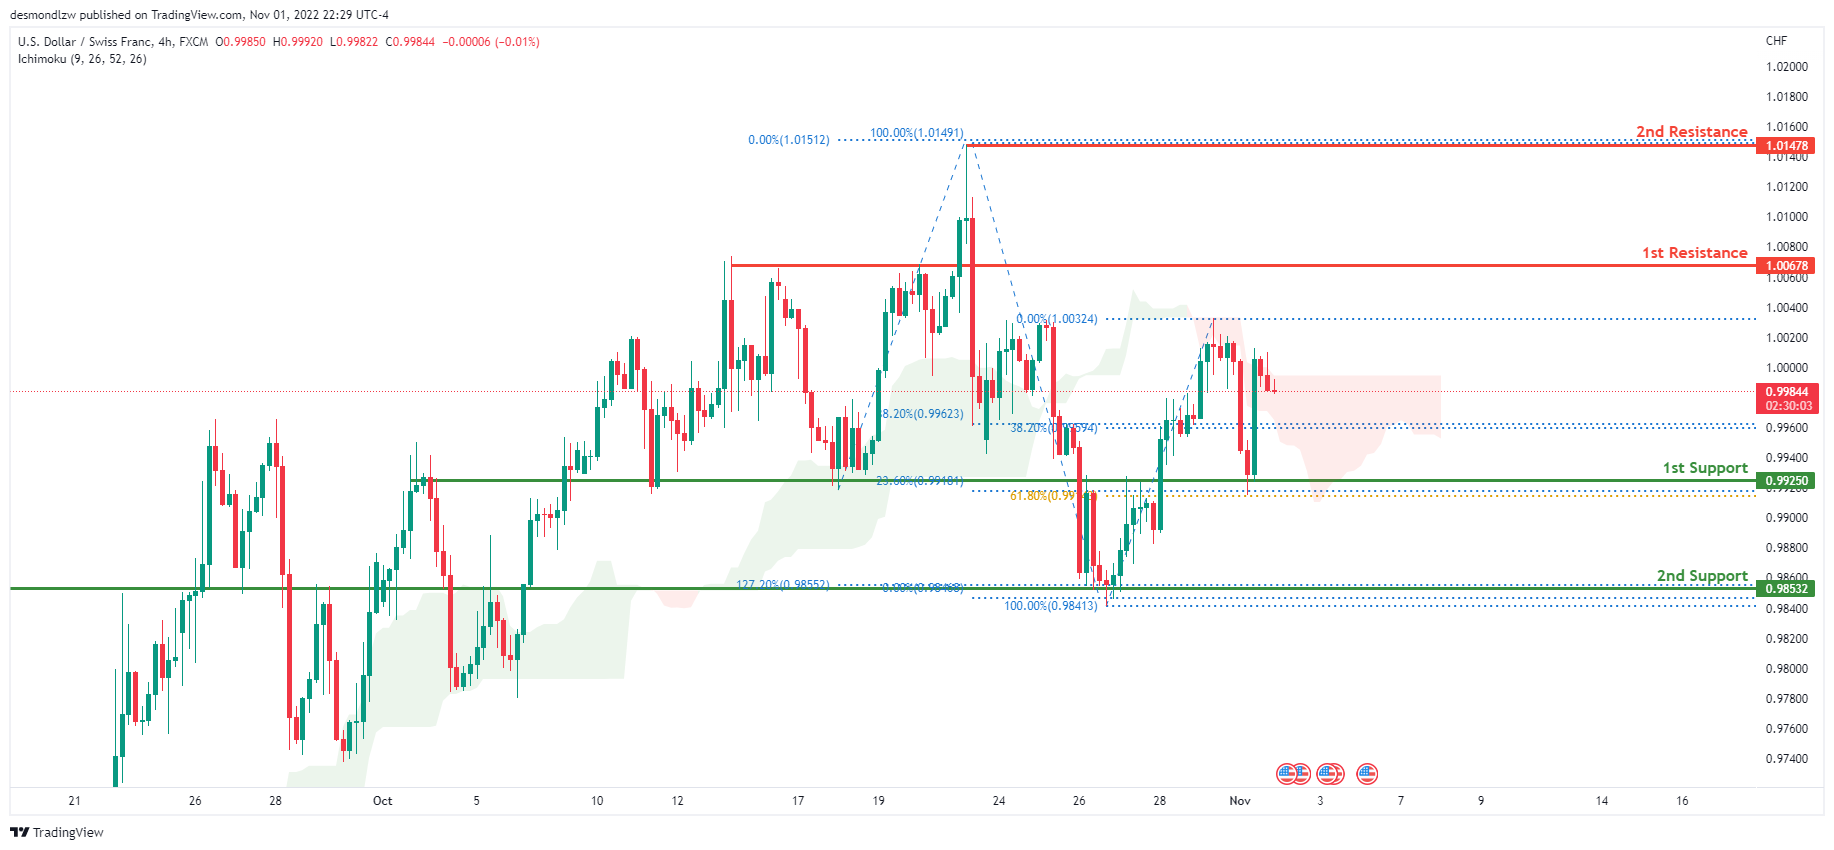
USD/CHF:
On the H4 chart, the overall bias for USDCHF is bearish. To add confluence to this, the price is below the Ichimoku cloud which indicates a bearish market. Overnight, USDCHF had some bullish momentum upwards with the price reflecting off the 1st support at 0.98532 where the 23.6% and 61.8% Fibonacci lines are located. Price is currently trading at 0.99830 at time of writing. Expecting price to possibly head back up to retest the 1st resistance line at 1.00678 where the 78.6% Fibonacci line is located.
Areas of consideration
- H4 1st support at 0.99250
- H4 2nd support at 0.98532
- H4 1st resistance at 1.00678
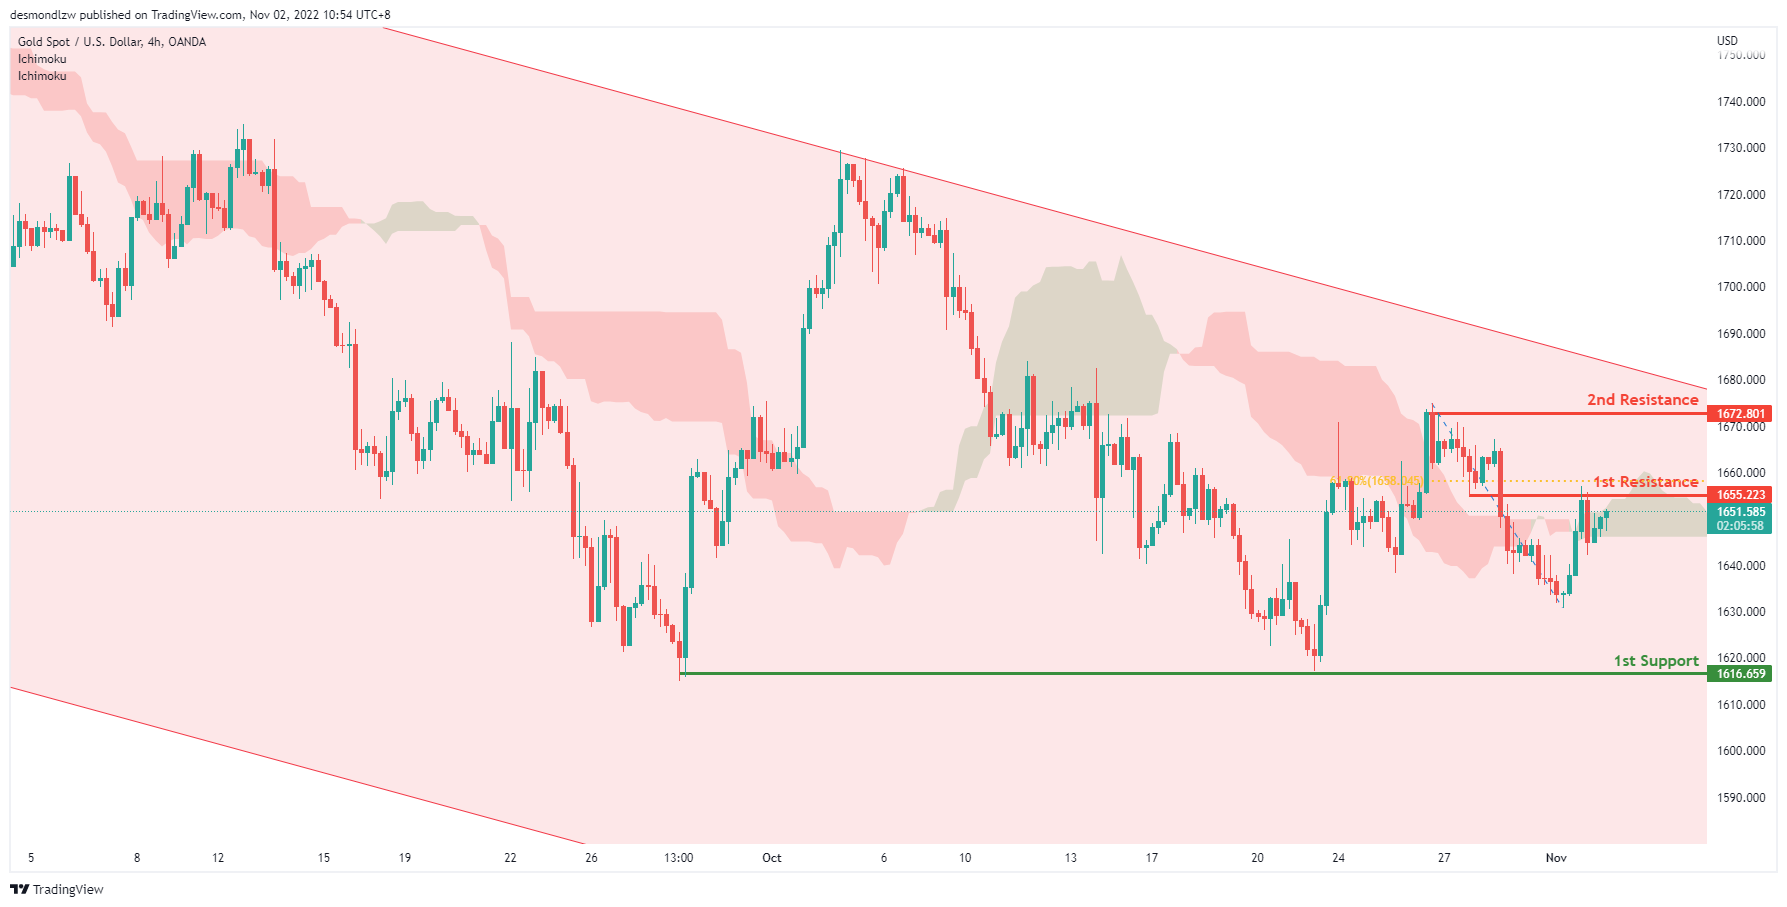
XAU/USD (GOLD):
On H4, with the price within the descending channel and crossing ichimoku cloud, we have a bearish bias that the price may drop from the 1st resistance at 1655.223, which is in line with the overlap resistance and 61.8% fibonacci retracement to the 1st support at 1616.659, where the previous swing lows are. Alternatively, the price may rise to retest the 1st resistance and rise to the 2nd resistance is at 1672.801, where the previous swing high is.
Areas of consideration:
- H4 time frame, 1st resistance at 1655.223
- H4 time frame, 1st support at 1616.659
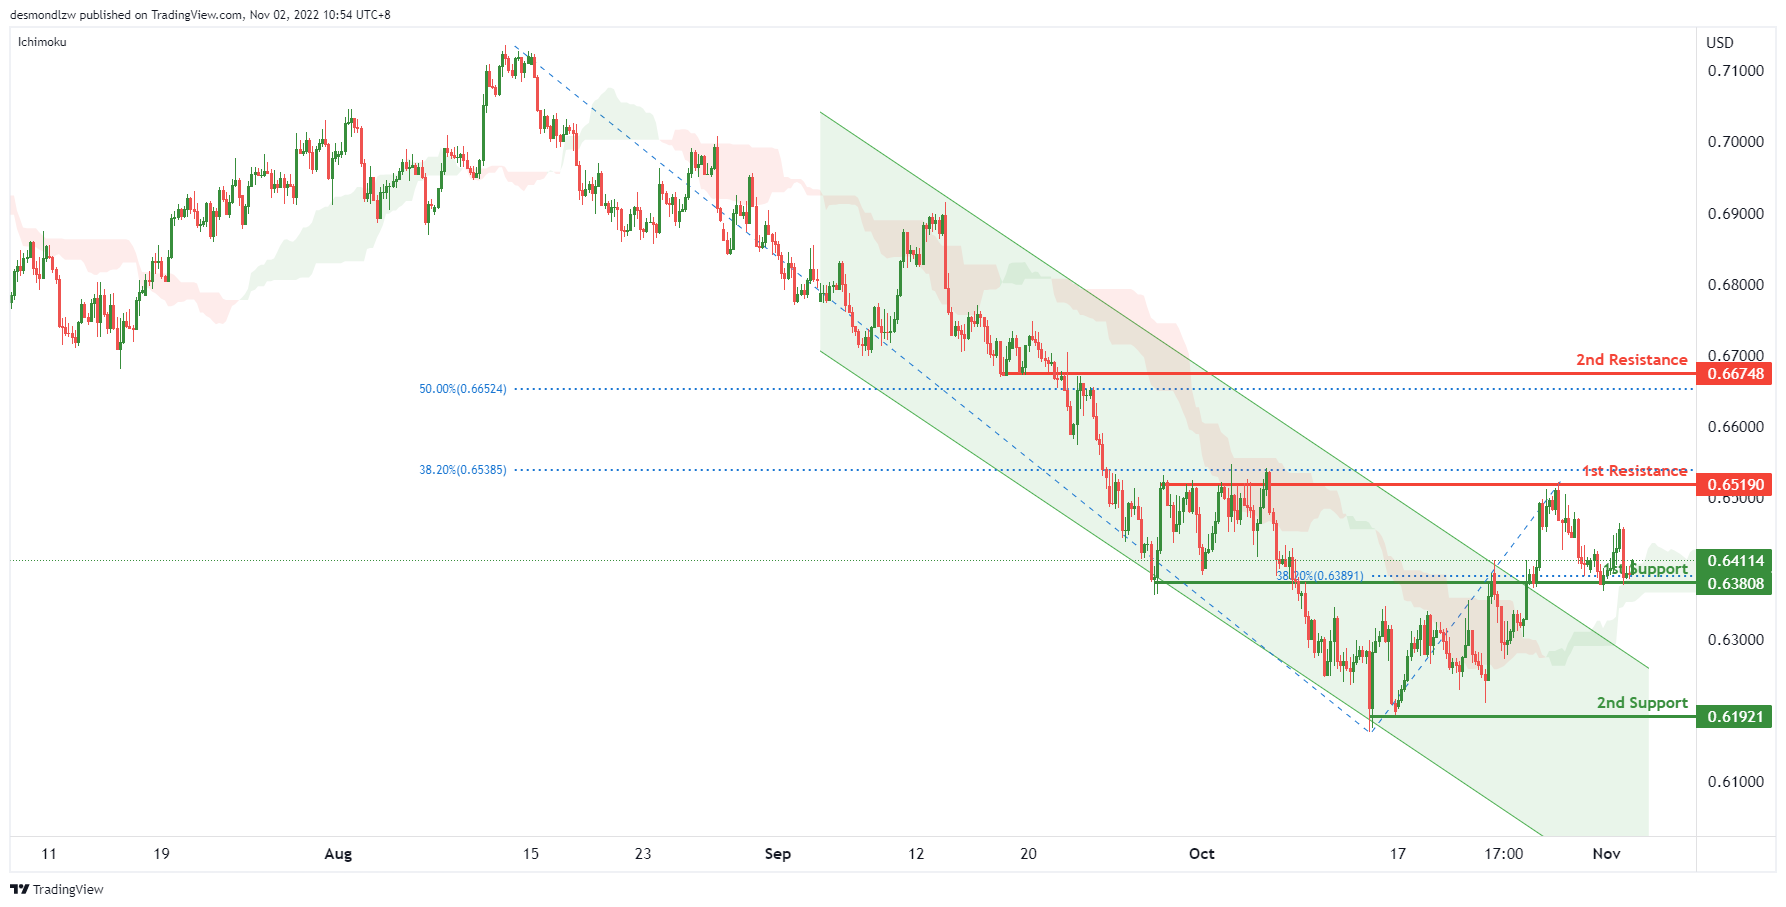
AUD/USD:
On the H4, with the price breaking the descending channel and above ichimoku cloud, we have a bullish bias that the price may rise from the 1st support at 0.63808, which is in line with the overlap support and 38.2% fibonacci retracement to the 1st resistance at 0.65190, which is in line with the overlap resistance and 38.2% fibonacci retracement. If the 1st resistance is broken, the 2nd resistance is at 0.66748, where the 50% fibonacci retracement is. Alternatively, the price may drop to the 2nd support at 0.61921, where the previous swing low is.
Areas of consideration
- H4, 1st support at 0.63808
- H4, 1st resistance at 0.65190
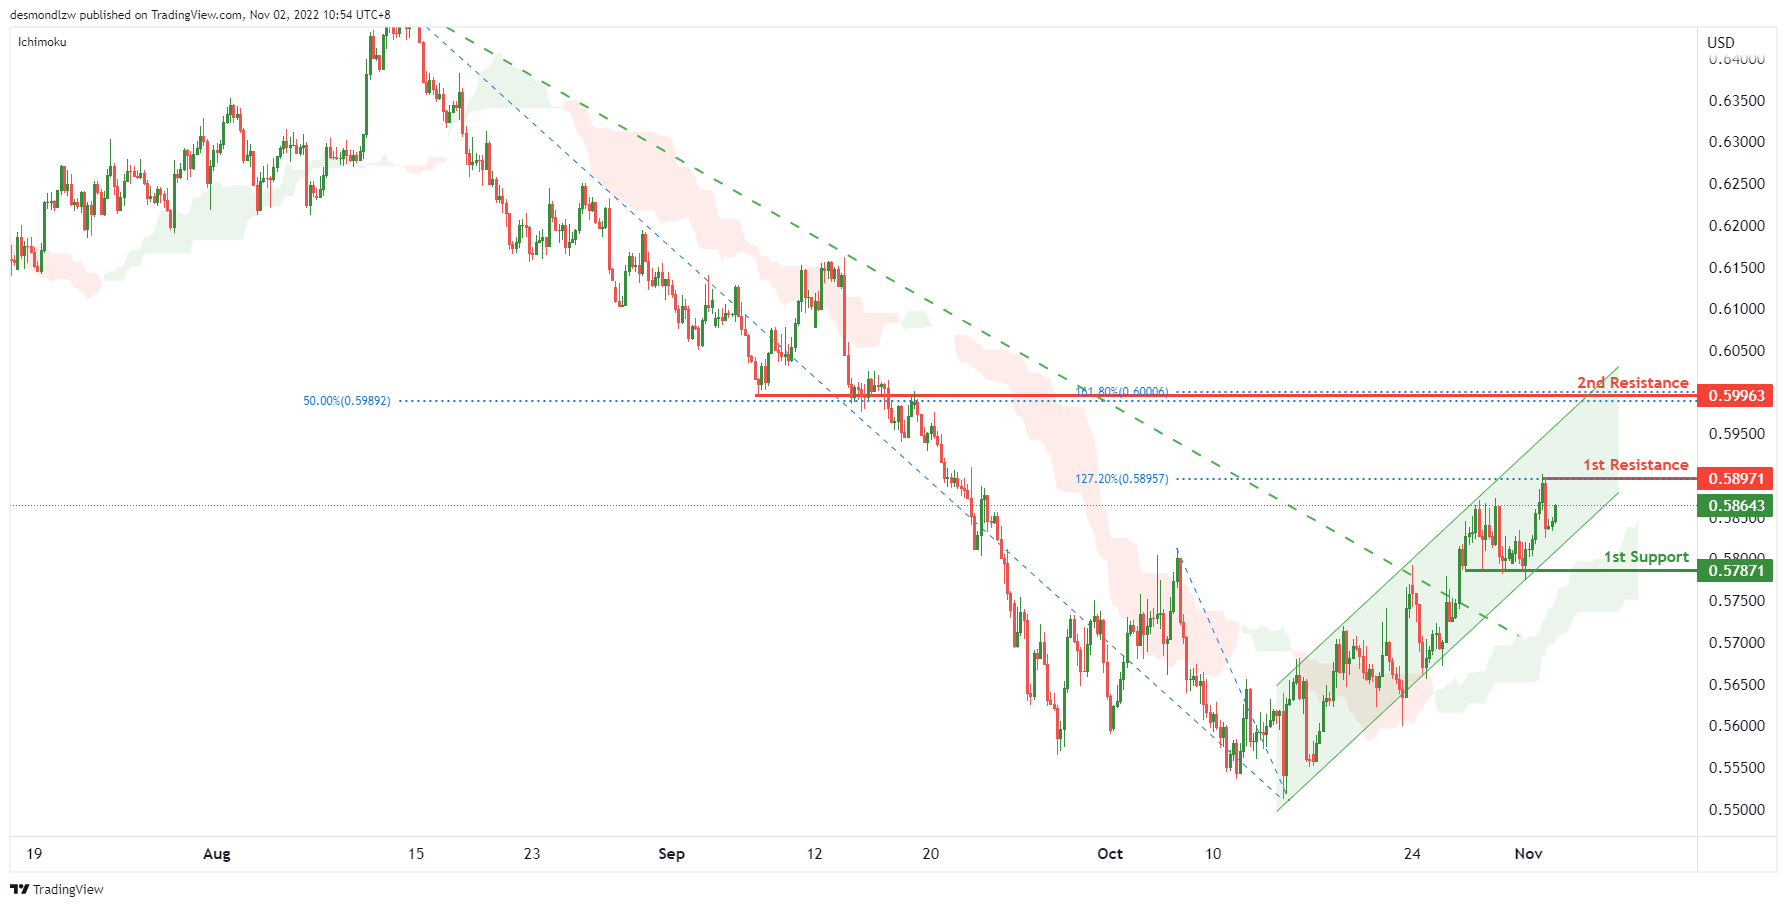
NZD/USD:
On the H4 chart, as the price is breaking the descending trendline, moving within the ascending channel and the price is above ichimoku cloud, we have a bullish bias that the price may rise to the 1st resistance at 0.58971, which is in line with the previous swing high and 127.2% fibonacci extension. If the 1st resistance is broken, the 2nd resistance is at 0.59963, where the 50% fibonacci retracement and 161.8% fibonacci extension are. Alternatively, the price may drop to the 1st support at 0.57871, where the previous swing lows are.
Areas of consideration:
- H4 time frame, 1st resistance at 0.58971
- H4 time frame, 2nd resistance at 0.59963
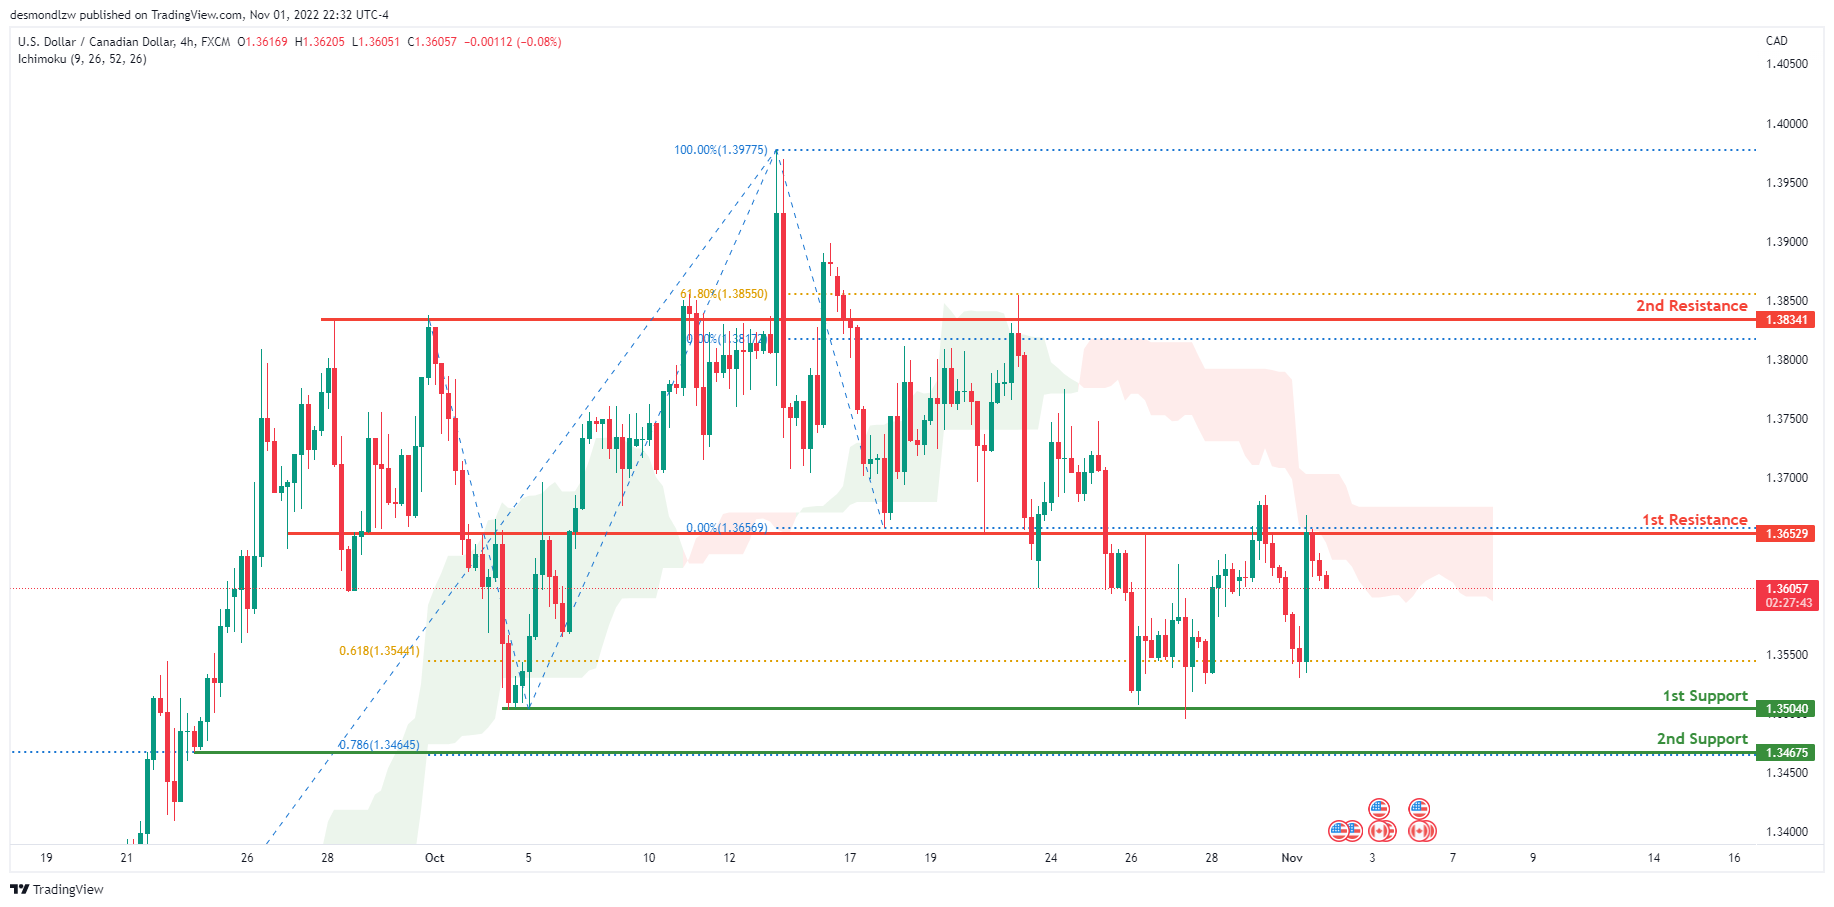
USD/CAD:
On the H4 chart, the overall bias for USDCAD is bearish. To add confluence to this, the price is below the Ichimoku cloud which indicates a bearish market. Overnight, price reflected off the 1st resistance at 1.36751 where the 0% fibonacci line is located. If this bearish momentum continues, the price will head towards the 1st support at 1.35040 where the previous swing low and 61.8% Fibonacci projection line is located.
Areas of consideration:
- H4 time frame, 1st resistance at 1.36751
- H4 time frame, 1st support at 1.35029
- H4 time frame, 2nd support at 1.34675
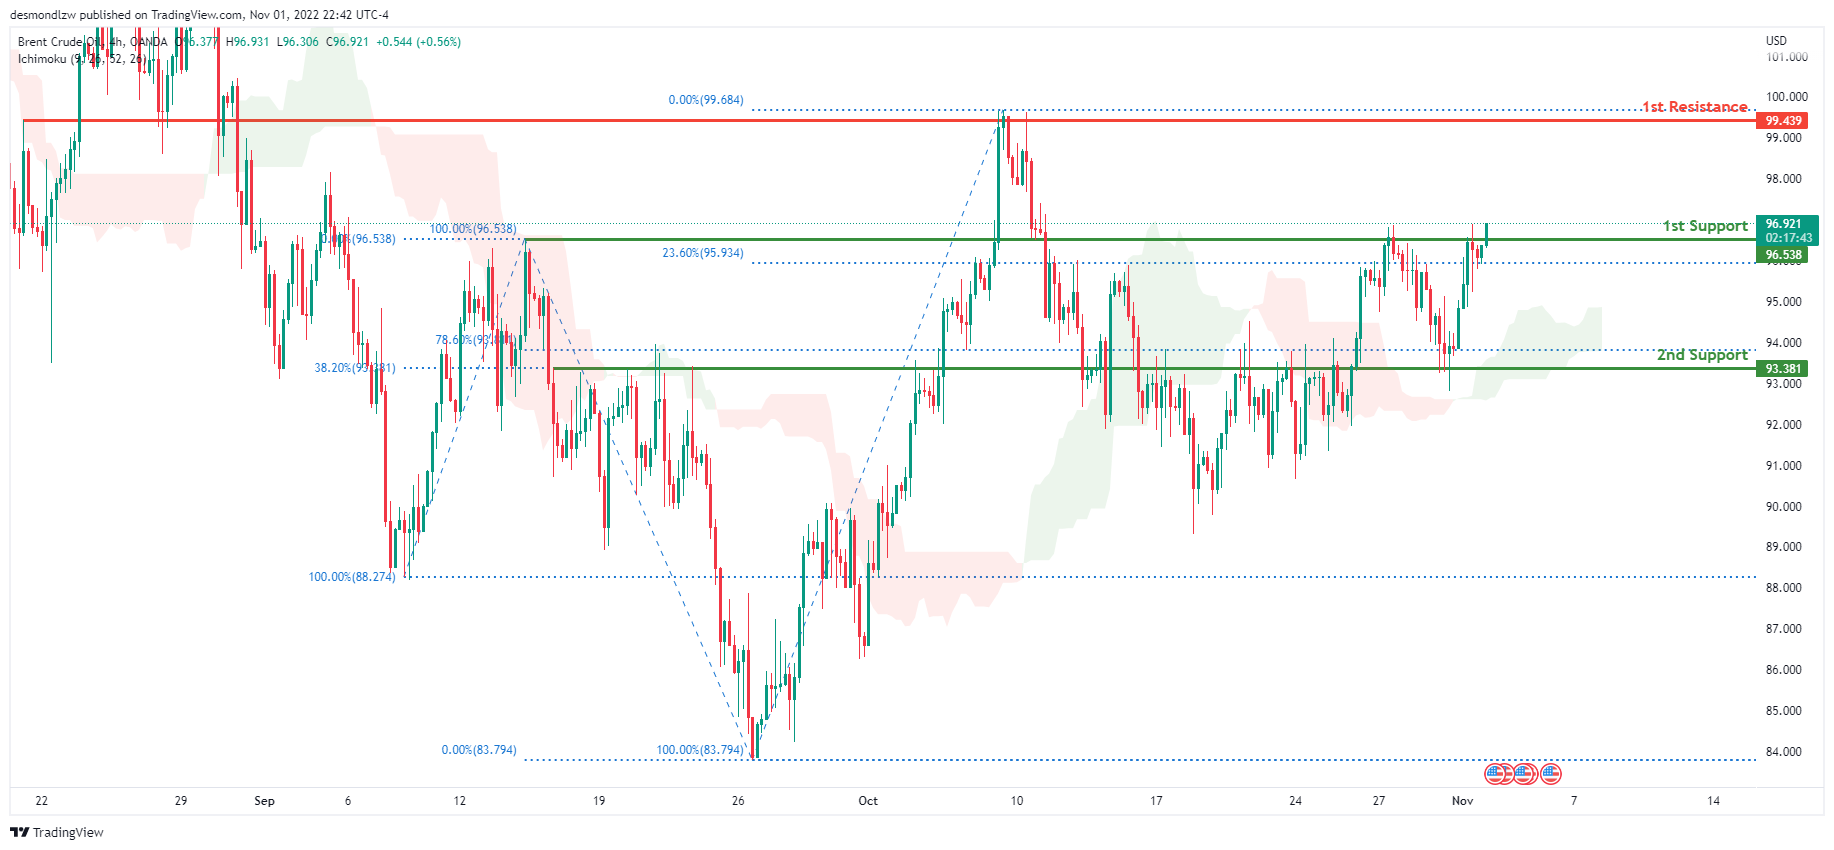
OIL:
Looking at the H4 chart, the current overall bias for Oil is bullish. To add confluence to this, the price is above the Ichimoku cloud which indicates a bullish market. Overnight, price continued its bullish momentum upwards with price currently above the 1st support line at 96.538 where the 100% and 23.6% Fibonacci lines are located. If this bullish momentum continues, expect price to possibly head towards the 1st resistance at 99.439 where previous swing high and 0% Fibonacci line is located.
Areas of consideration:
- H4 time frame, 1st resistance at 99.439
- H4 time frame, 1st support at 96.538
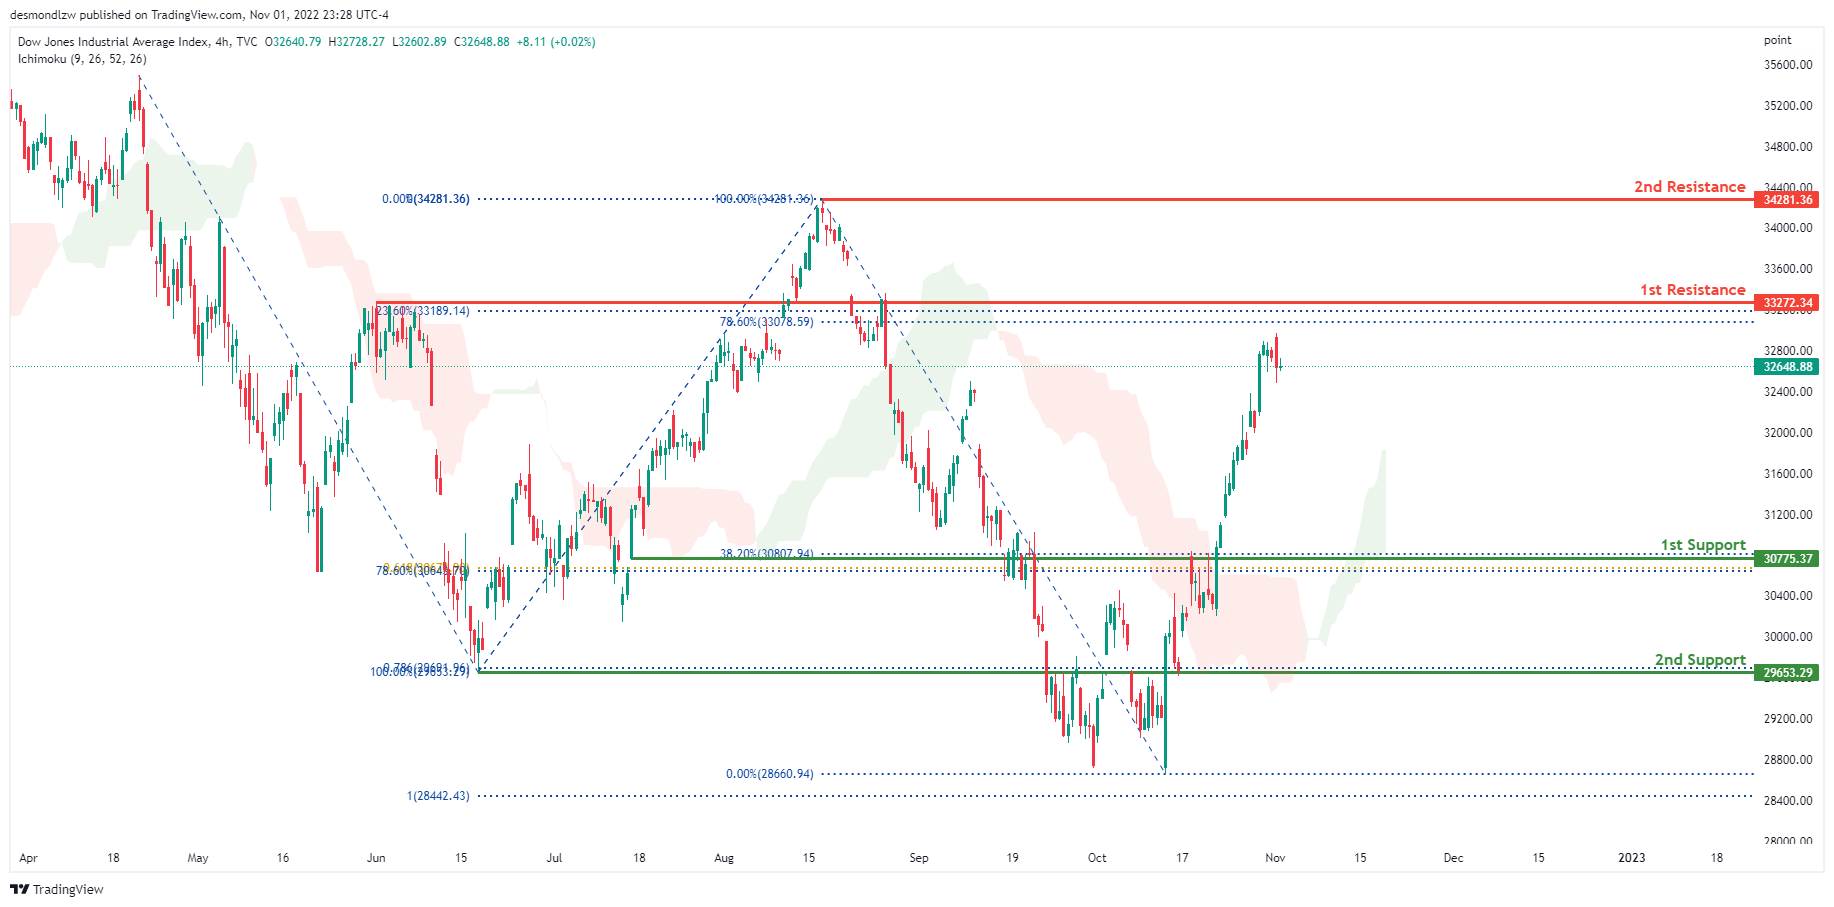
Dow Jones Industrial Average:
On the H4 chart, the overall bias for DJI is bullish. To add confluence to this, the price is above the Ichimoku cloud which indicates a bullish market. Overnight, DXY consolidated around the area of 32648.88. If this bullish momentum continues, expect the price to possibly head towards the 1st resistance at 33272.34 where the 23.6% and 78.6% Fibonacci lines are located.
Areas of consideration:
- H4 time frame, 1st support at 30775.37
- H4 time frame, 1st Resistance at 33272.34
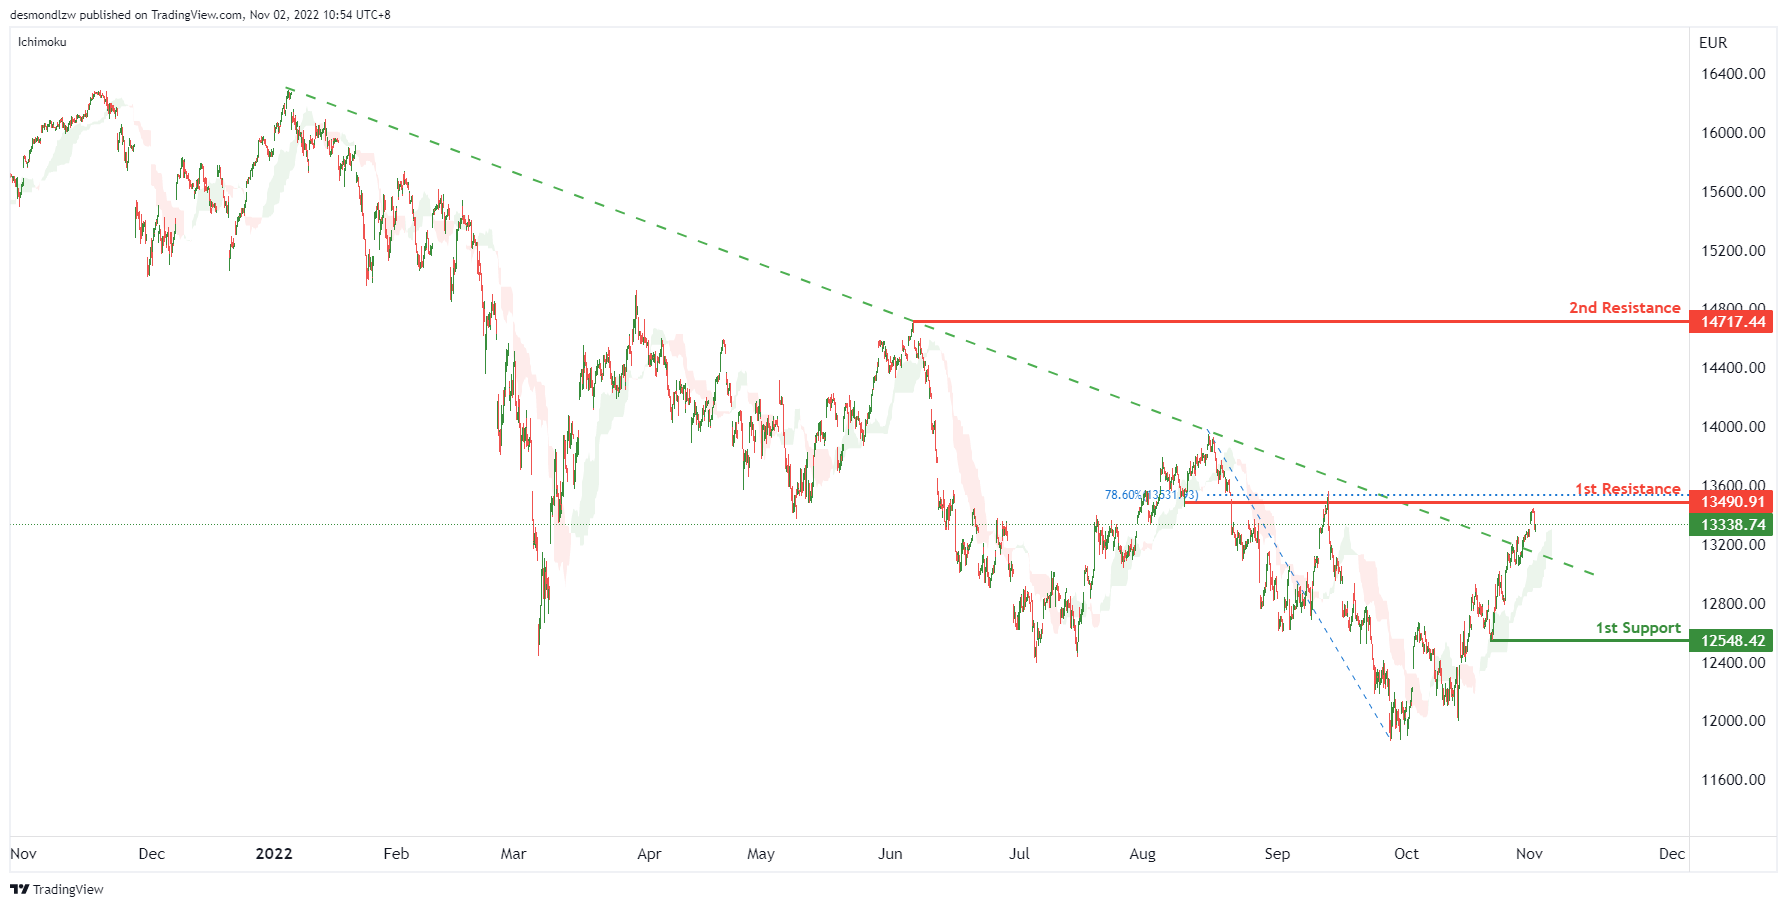
DAX:
On the H4 chart, the price has now closed above the Ichimoku cloud which indicates a breakout of a descending trendline. Expecting price to possibly continue this bullish momentum and head towards the 1st resistance at 13490.91, where the 78.6% Fibonacci line is located. If the 1st resistance is broken, the 2nd resistance could be at 14717.44, which is in line with the previous swing high. Alternatively, the price may drop to the 1st support at 12548.42, which is in line with the swing low.
Areas of consideration:
- H4 time frame, 1st resistance at 13490.91
- H4 time frame, 2nd resistance at 14717.44
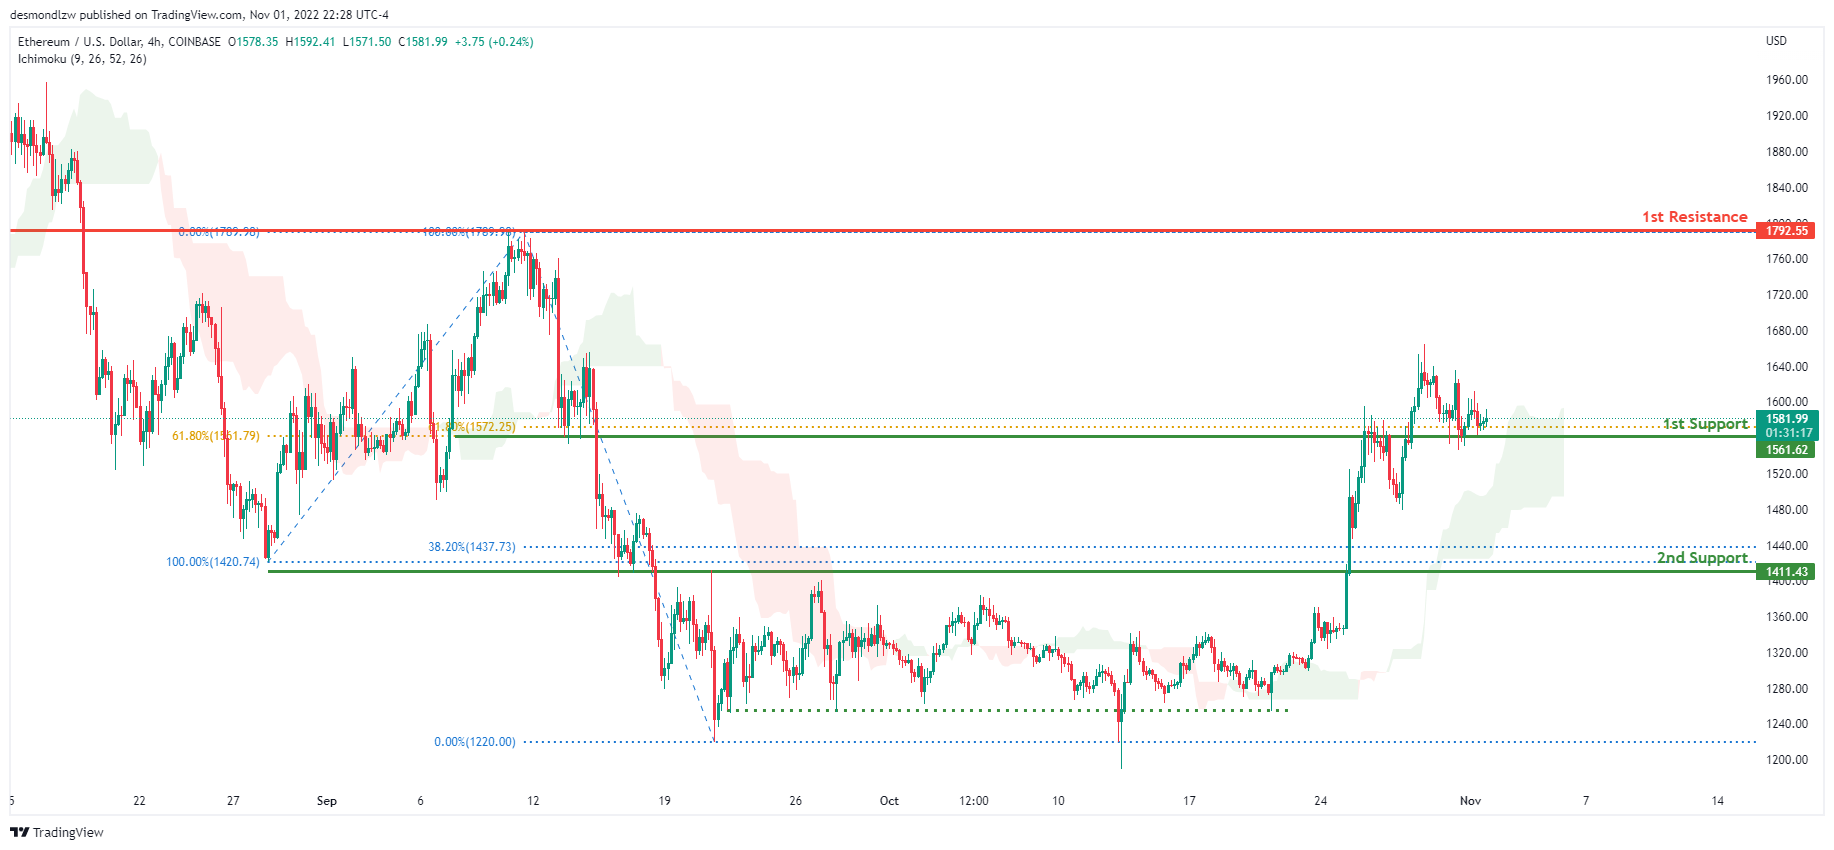
ETHUSD:
Looking at the H4 chart, the current overall bias for ETHUSD is bullish. To add confluence to this, the price is above the Ichimoku cloud which indicates a bullish market. Overnight, price continued to consolidate along the 1st support level at 1561.62 where 2 of the 61.8% Fibonacci lines are located. If this bullish momentum continues, expect the price to head towards the 1st resistance at 1792.55 where the previous swing high and 100% Fibonacci line is located.
Areas of consideration:
- H4 time frame, 1st resistance of 1792.55
- H4 time frame, 1st support at 1561.62
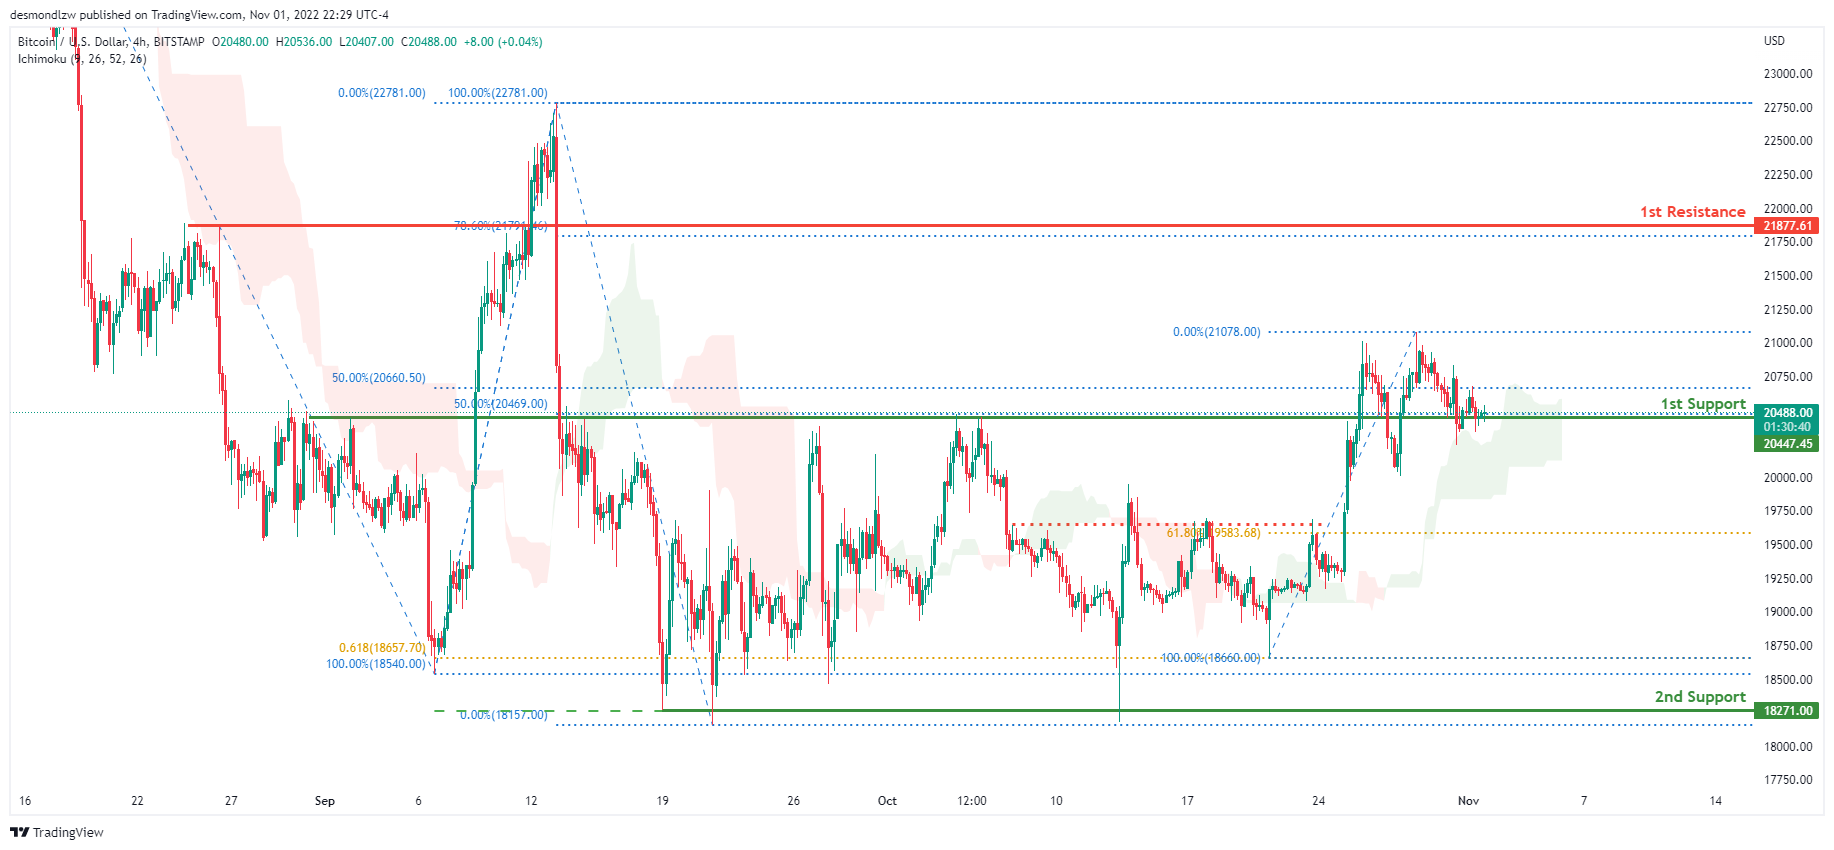
BTCUSD:
On the H4 chart, the overall bias for BTCUSD is bullish. To add confluence to this, the price is above the Ichimoku cloud which indicates a bullish market. Overnight, price continued to consolidate along the 1st support at 20440.00 where the 2 of the 50% Fibonacci lines are located. If this bullish momentum continues, expect the price to head towards the 1st resistance at 21892.00, where the 78.6% Fibonacci line is located.
Areas of consideration:
- H4 time frame, 1st resistance 21892.00
- H4 time frame, 1st support at 20440.00
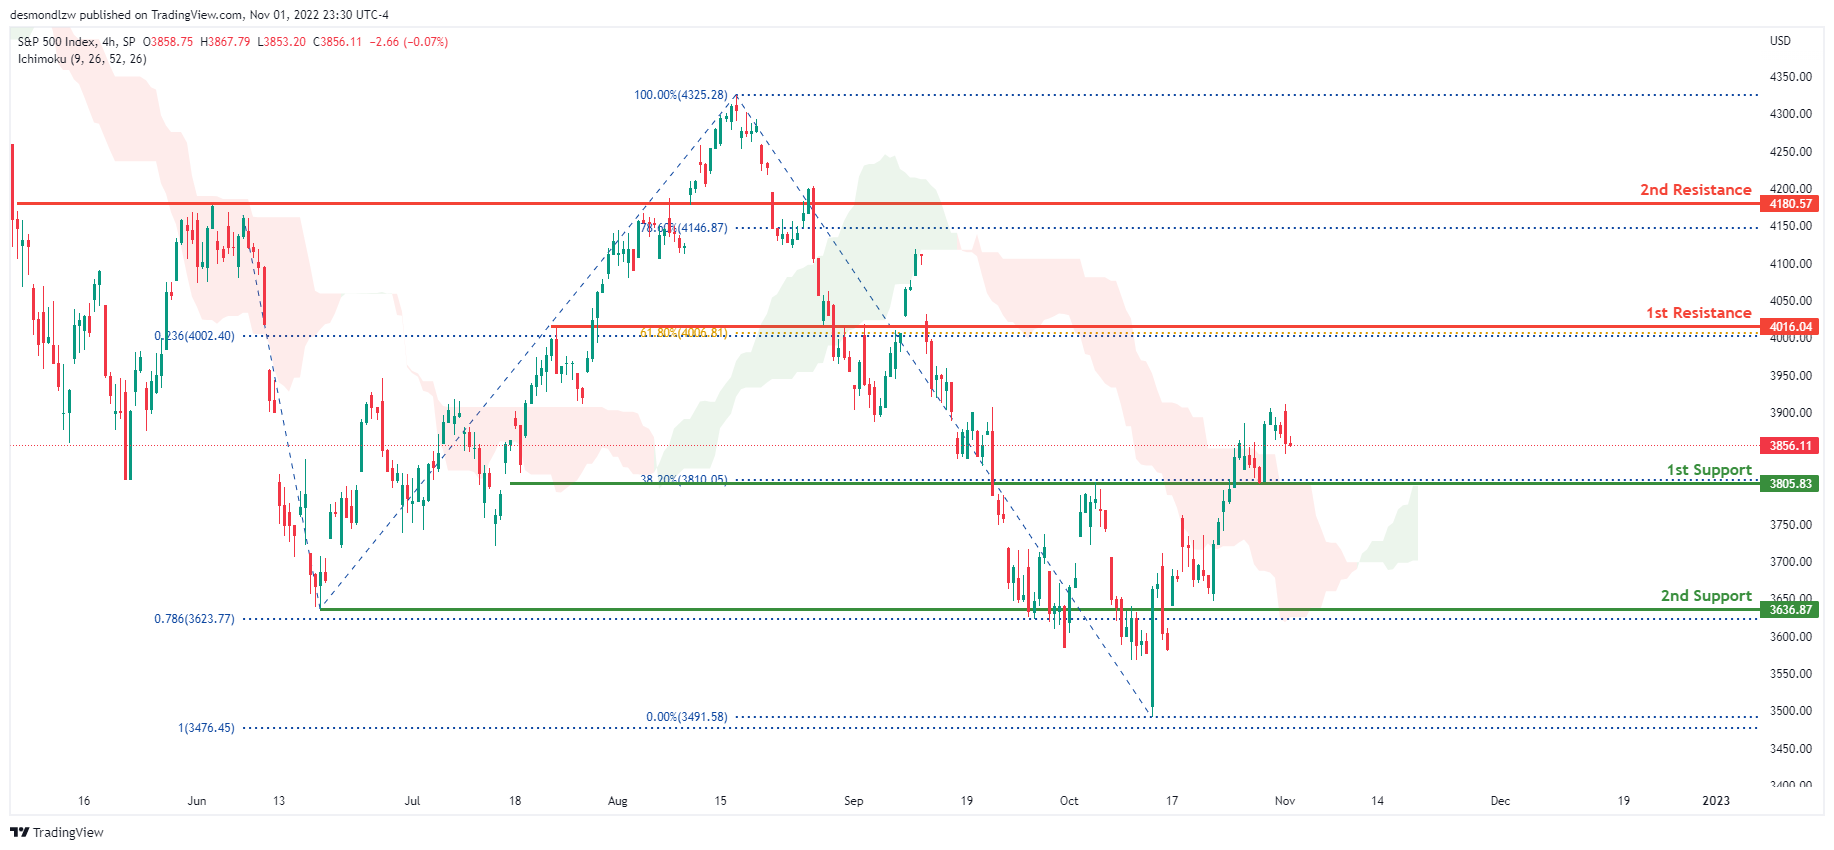
S&P 500:
On the H4 chart, the overall bias for S&P500 is bullish. To add confluence to this, the price is above the Ichimoku cloud which indicates a bullish market. Overnight, price continued to consolidate with price currently trading at 3856.11 at time of writing. If this bullish momentum continues, expect price to possibly head towards the 1st resistance at 4016.04 where the 61.8% Fibonacci line and 23.6% Fibonacci projection line is located.
Areas of consideration:
- H4 time frame, 1st support at 3805.83
- H4 time frame, 1st resistance at 4016.04


