
DXY:
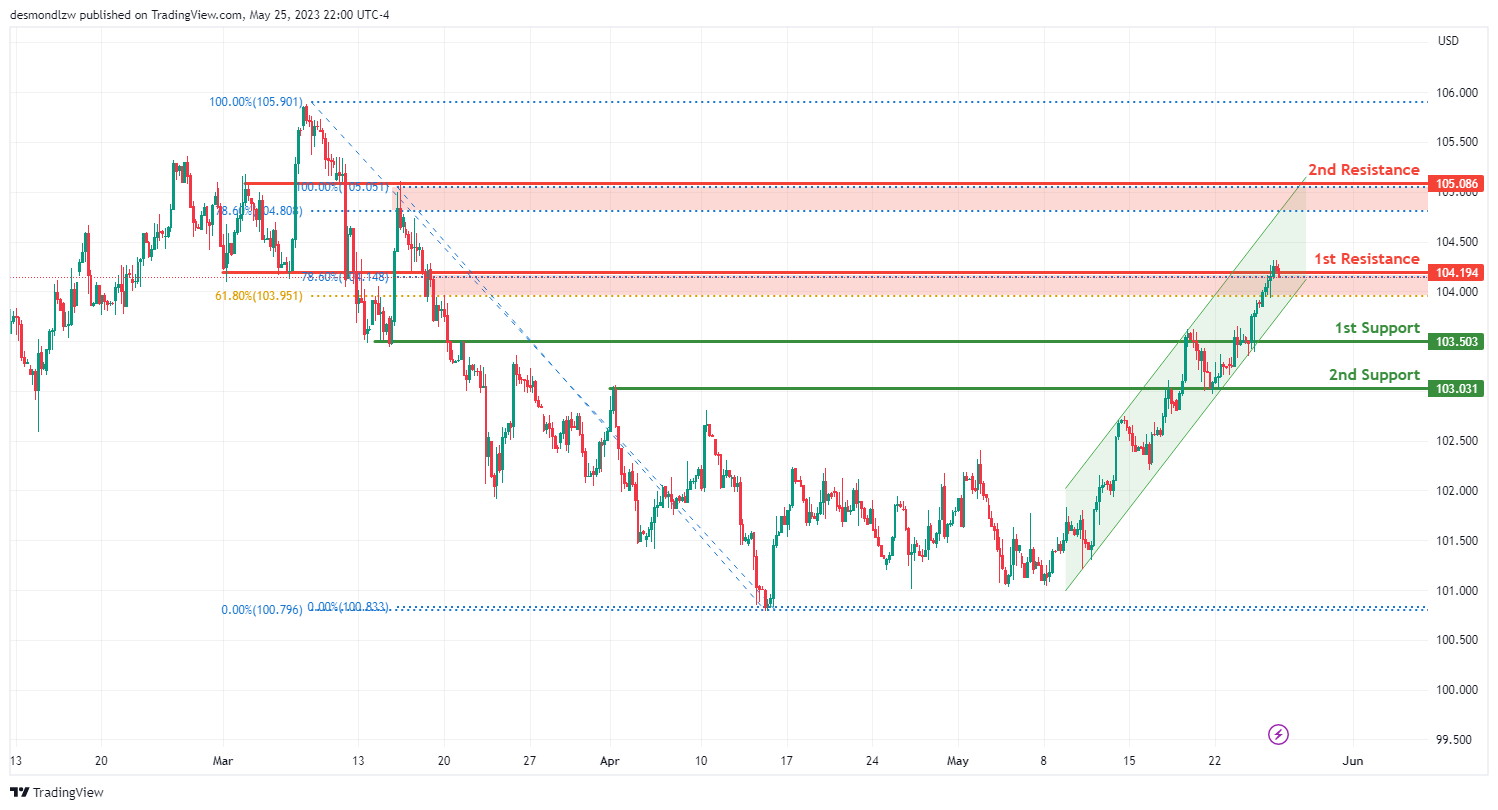
The DXY instrument is currently demonstrating a bullish momentum, primarily driven by the fact that the price is moving within a bullish ascending channel.
In the short term, there’s a possibility that the price could further descend towards the first support level at 103.50 before rebounding and climbing towards the first resistance. This first support level is known as a pullback support, which suggests it could halt any further downward movement.
An additional support level is at 103.03, serving as an overlap support, indicating its potential to prevent further declines in price.
On the other hand, should the price aim to continue its bullish trend, it could meet resistance at 104.19. This overlap resistance level, also at both the 61.80% and 78.60% Fibonacci retracement levels, could potentially obstruct upward price movements. This alignment is referred to as Fibonacci confluence.
A second resistance level is at 105.08. This pullback resistance, located at the 78.60% Fibonacci retracement level, might pose a challenge to any further increases in price.
EUR/USD:
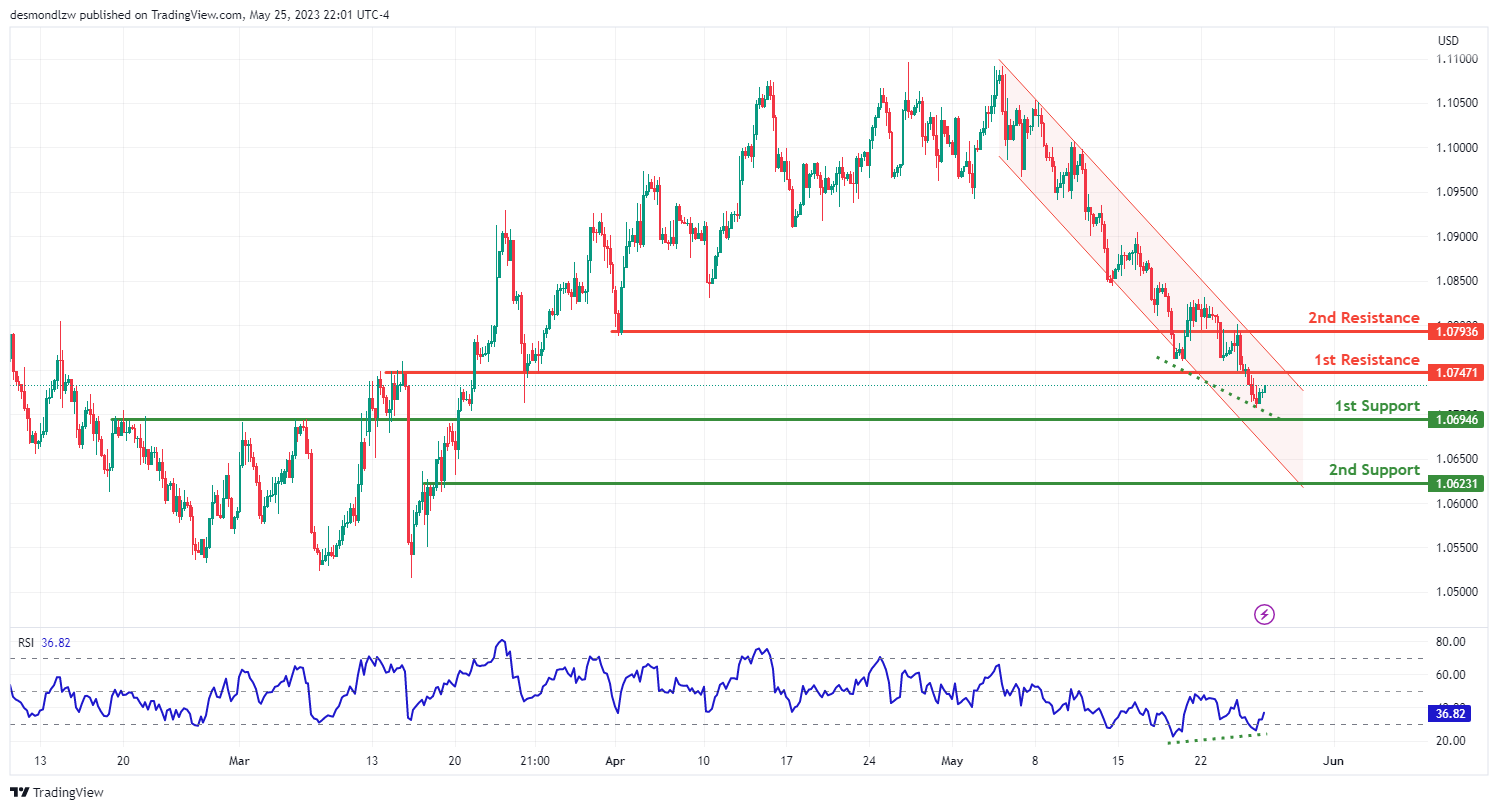
The EUR/USD chart is currently showing a bearish trend, predominantly due to the price being in a bearish descending channel.
In the short term, there’s a possibility for a bearish reaction at the first resistance level at 1.0747, leading to a decline towards the first support level at 1.0694. This resistance level is recognized as a pullback resistance, indicating its potential to hinder upward price movements.
An additional resistance level is located at 1.0793, known as an overlap resistance, which could also obstruct any further price increases.
On the other hand, if the price looks to descend, it may find support at 1.0694. This pullback support could potentially halt any further downward movement.
Another support level to be mindful of is at 1.0623. As an overlap support, this level could potentially stop any further price declines.
Despite the overall bearish momentum, the Relative Strength Index (RSI) is displaying bullish divergence compared to the price, suggesting a potential swift rise in price in the near future.
GBP/USD:
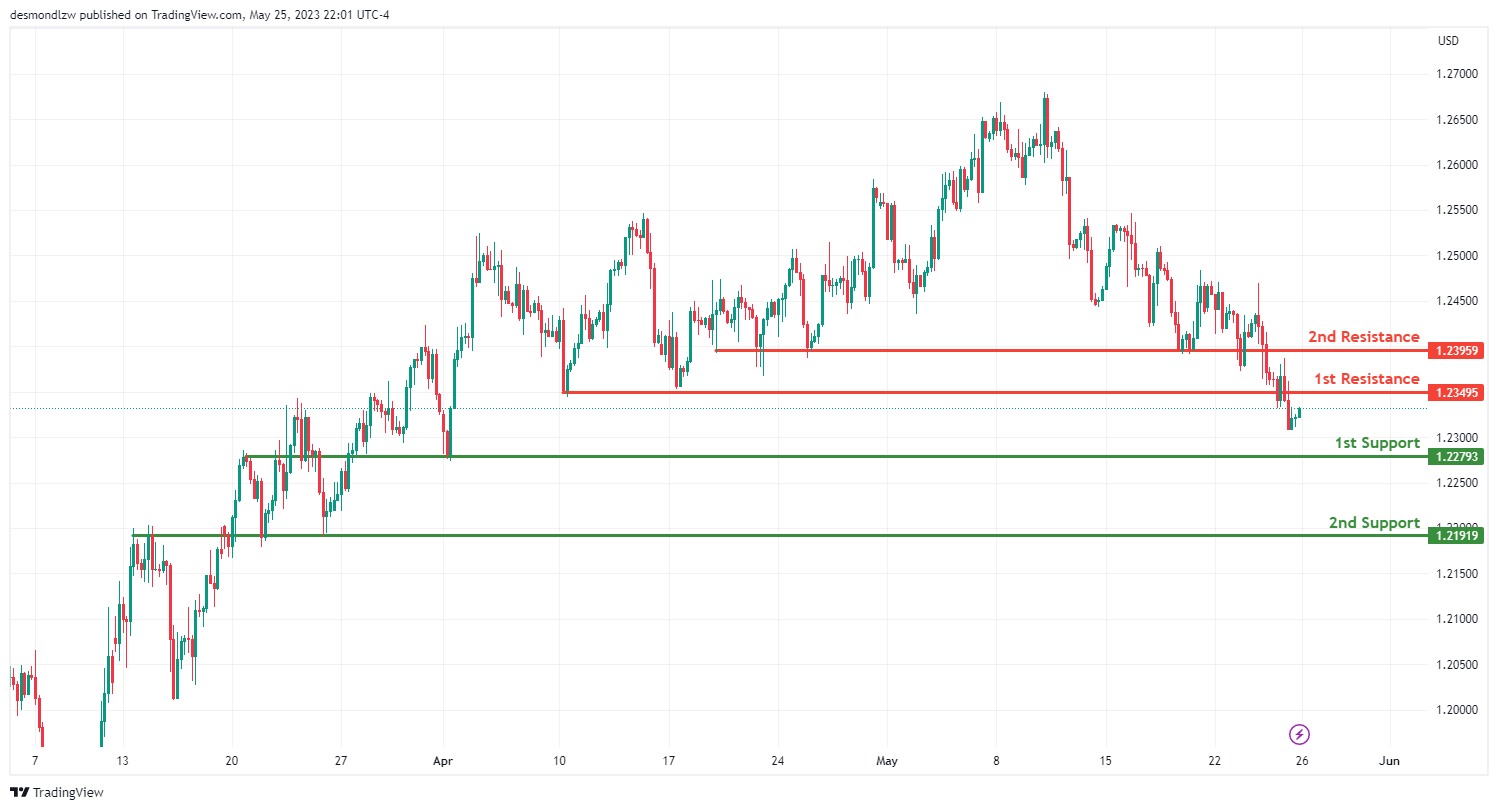
The GBP/USD chart is currently in a bearish trend, suggesting potential for continued downward movement.
In the near term, we could see a bearish response at the first resistance level at 1.2349, leading to a decrease towards the first support level at 1.2279. This first resistance level, recognized as a pullback resistance, might pose a hurdle for further price increases.
Furthermore, there’s a second resistance level at 1.2395, identified as an overlap resistance. This level could act as another obstacle for any upward price movements.
On the flip side, the first support level at 1.2279, known as an overlap support, could potentially provide a strong foundation to prevent further price declines.
There’s also a second support level at 1.2191, which is another overlap support. This further reinforces its potential to halt any further decrease in price.
USD/CHF:
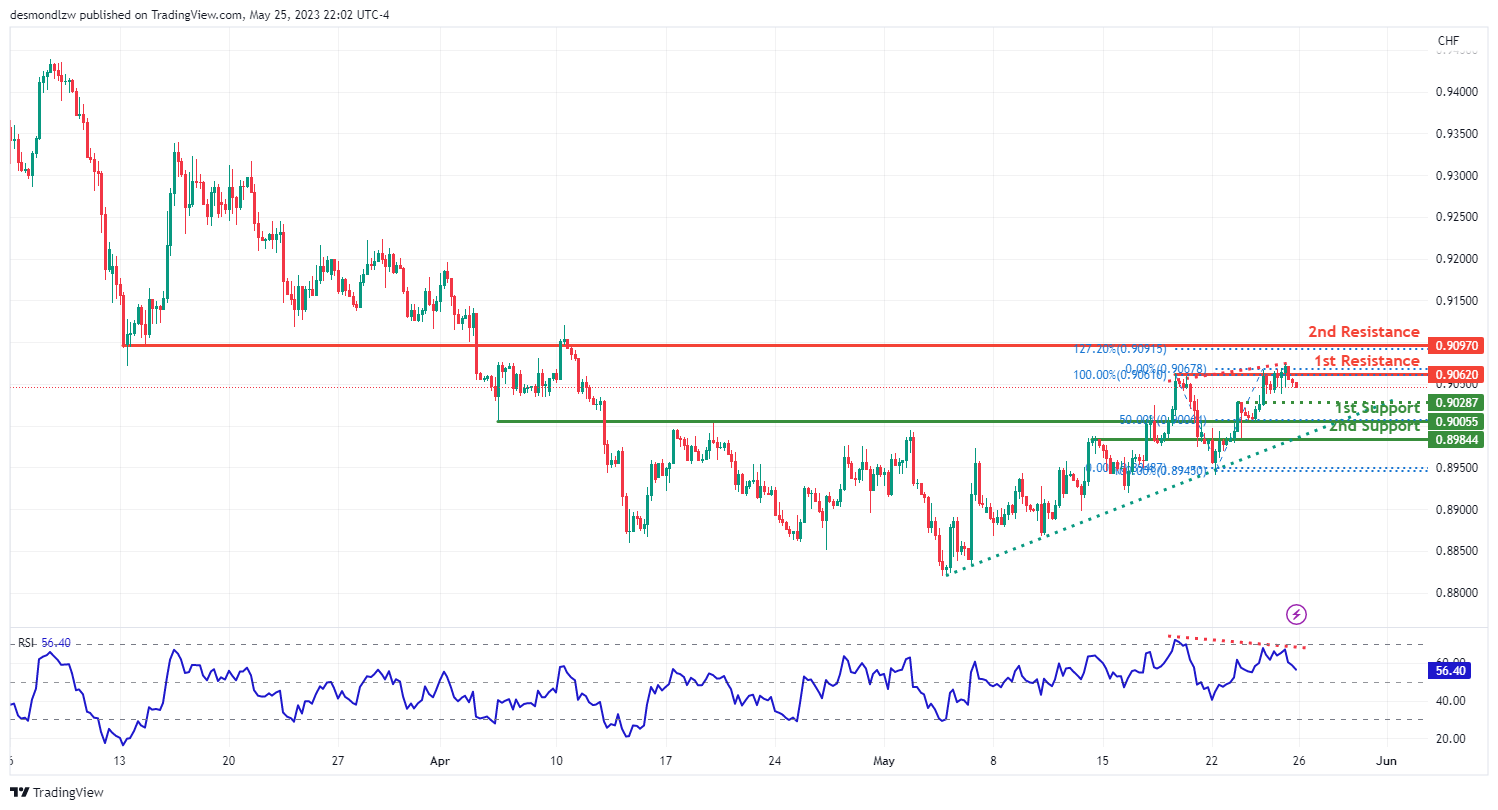
The USD/CHF trading instrument is currently displaying a bearish trend. However, the price is hovering above a significant ascending trend line, suggesting a possibility of further bullish momentum.
In the short term, the price might continue its downward trend towards the first support level at 0.9005 before potentially rebounding and escalating towards the first resistance level. This first support level, classified as an overlap support, also corresponds with the 50% Fibonacci retracement, indicating its potential to resist further price falls.
Another support level is positioned at 0.8984, also recognized as an overlap support, strengthening its capacity to halt further price decreases.
In the event of a price reversal, it might encounter resistance at 0.9062. This multi-swing high resistance could serve as a significant hurdle to price increases.
There’s also a second resistance level situated at 0.9097. This level, acknowledged as a pullback resistance, coincides with the 127.20% Fibonacci extension level, suggesting it could act as a considerable barrier to any further price surges.
Moreover, the Relative Strength Index (RSI) shows bearish divergence compared to the price, indicating the potential for a decline in price in the near future.
USD/JPY:
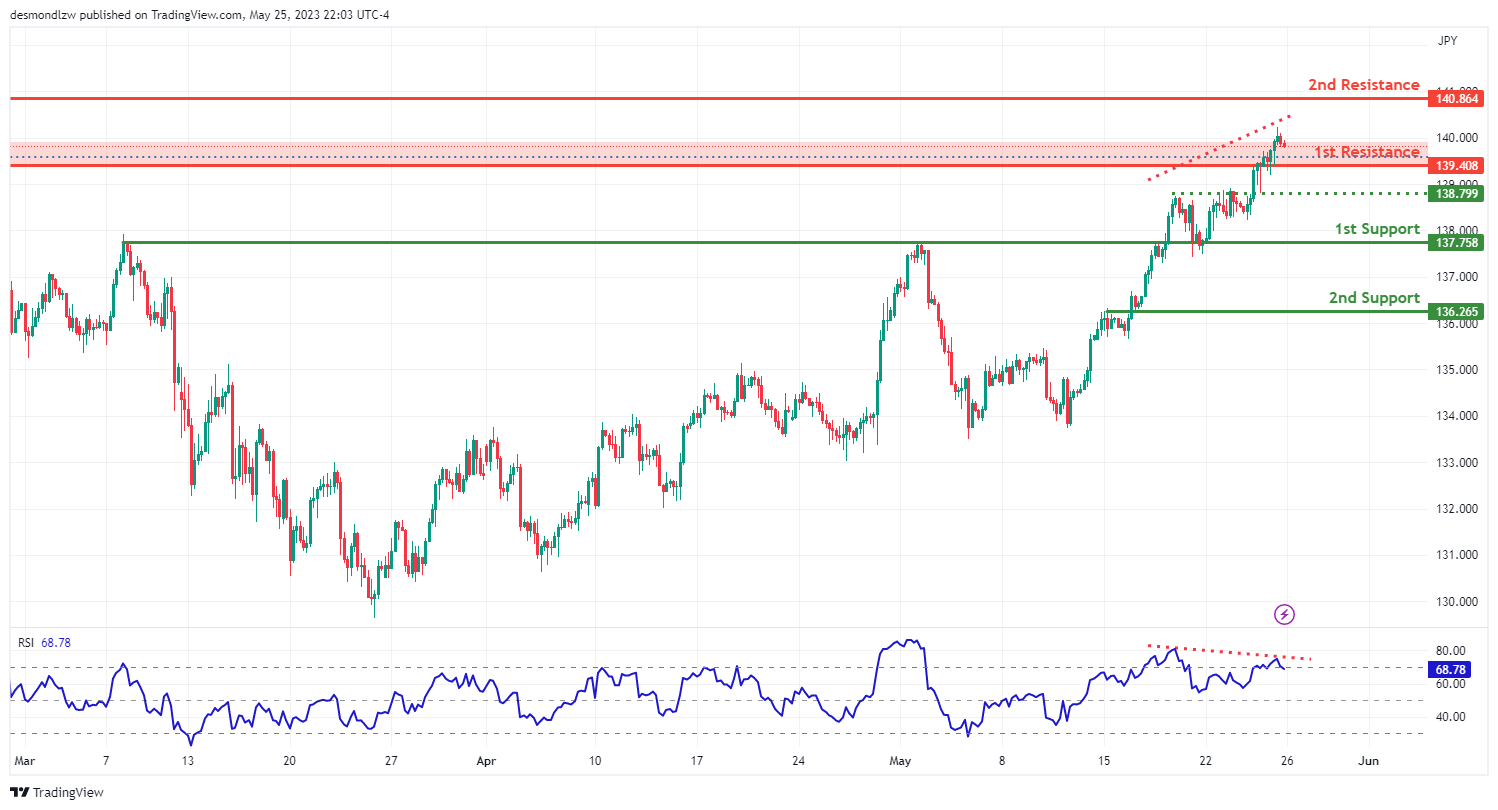
The USD/JPY trading instrument is presently exhibiting a bearish trend.
In the near future, the price could potentially continue its bearish trajectory towards the first support level at 137.75. This support level, known as an overlap support, could serve as a substantial base to prevent further price declines.
A second support level is identified at 136.25, also classified as an overlap support, reinforcing its potential to halt additional decreases in price.
Conversely, if the price seeks to reverse its bearish path, it might encounter resistance at 139.40. This resistance level, also identified as a pullback resistance, aligns with the 50% Fibonacci retracement level and could pose a challenge to further price increases.
Another resistance level to be mindful of is at 140.86. As a swing high resistance, this level could potentially limit any upward price momentum.
Moreover, the Relative Strength Index (RSI) is showing bearish divergence compared to the price, indicating a likelihood of a swift decrease in price in the near future.
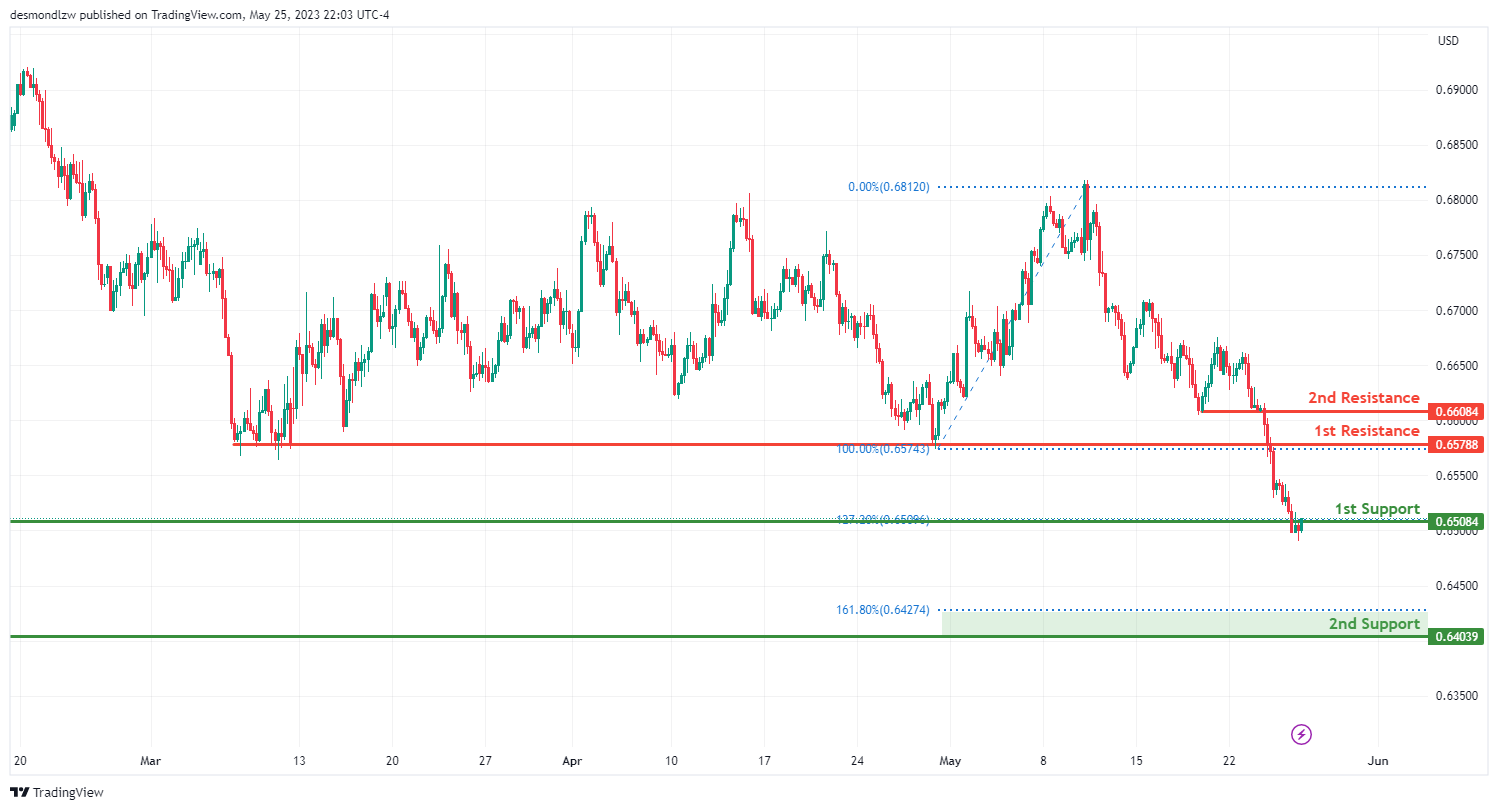
AUD/USD:
The AUD/USD instrument is currently displaying a bullish trend.
In the near future, there’s a possibility for a bullish bounce off the first support level at 0.6508, potentially propelling the price towards the first resistance level at 0.6578. This first support level, known as a pullback support, aligns with the 127.20% Fibonacci Extension, bolstering its potential to halt any further downward movement.
There is also a second support level at 0.6403, identified as an overlap support, coinciding with the 161.80% Fibonacci Extension, which further strengthens its ability to prevent additional price decreases.
On the upside, the first resistance level is located at 0.6578, which functions as a pullback resistance and could pose a potential barrier to price increases.
Further, a second resistance level is noted at 0.6608, also serving as a pullback resistance, enhancing the potential for hindering any further bullish price momentum.
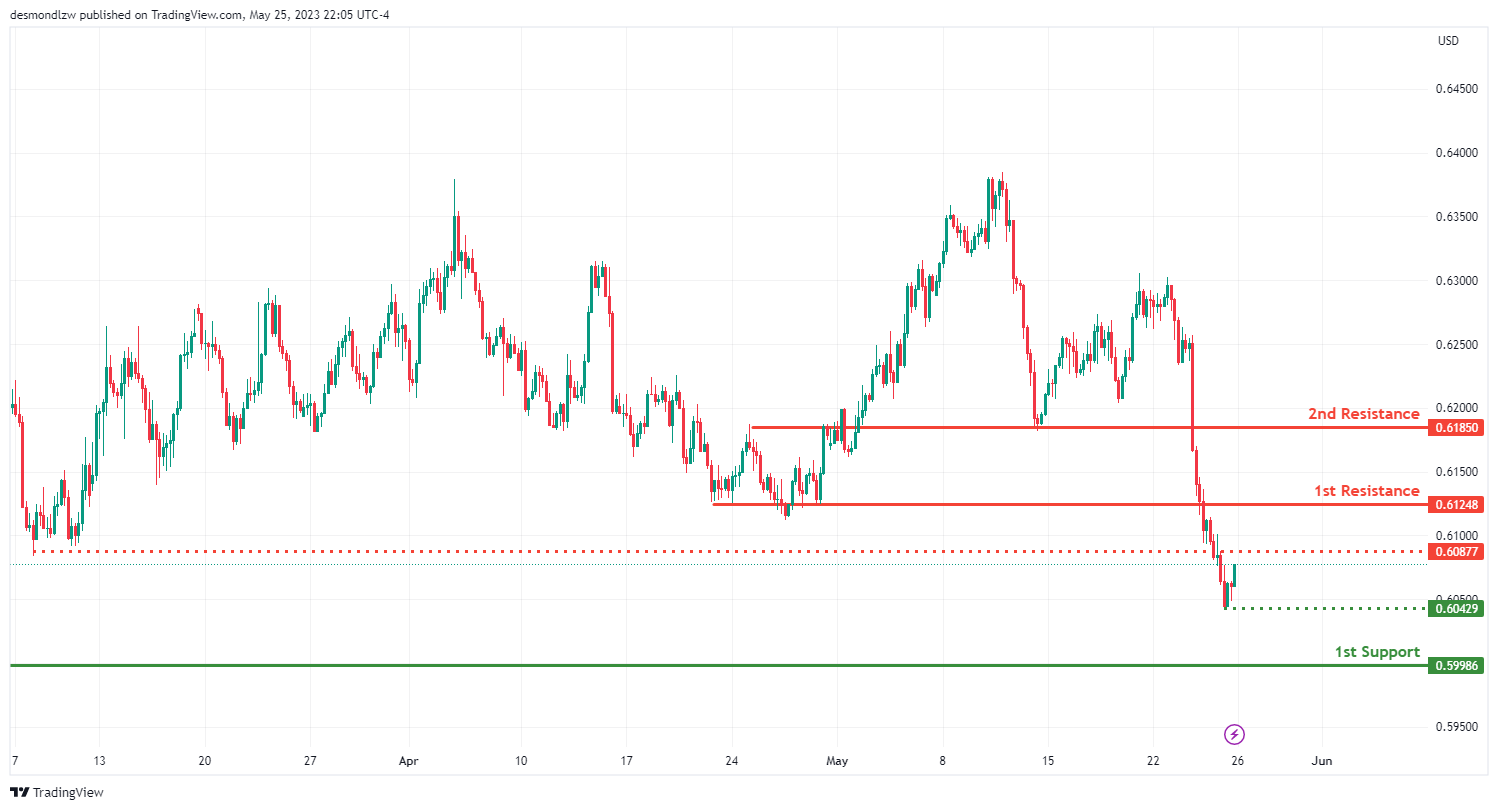
NZD/USD
The NZD/USD instrument is currently displaying a bearish trend.
In the short term, there’s a potential for a bearish continuation towards the first support level at 0.6508. This first support level serves as a pullback support, strengthening its ability to halt further price drops.
An intermediate support level is also present at 0.6042, functioning as a swing low support and could further reinforce the potential for price support during a downward movement.
Regarding resistance levels, the first resistance is at 0.6124, serving as a pullback resistance, which could provide a potential obstacle for upward price movements.
Additionally, there is a second resistance level at 0.6185, also serving as a pullback resistance, enhancing its potential to hinder any further bullish momentum.
An intermediate resistance level is noted at 0.6087, functioning as a pullback resistance, which might act as an additional hurdle to the price rise.
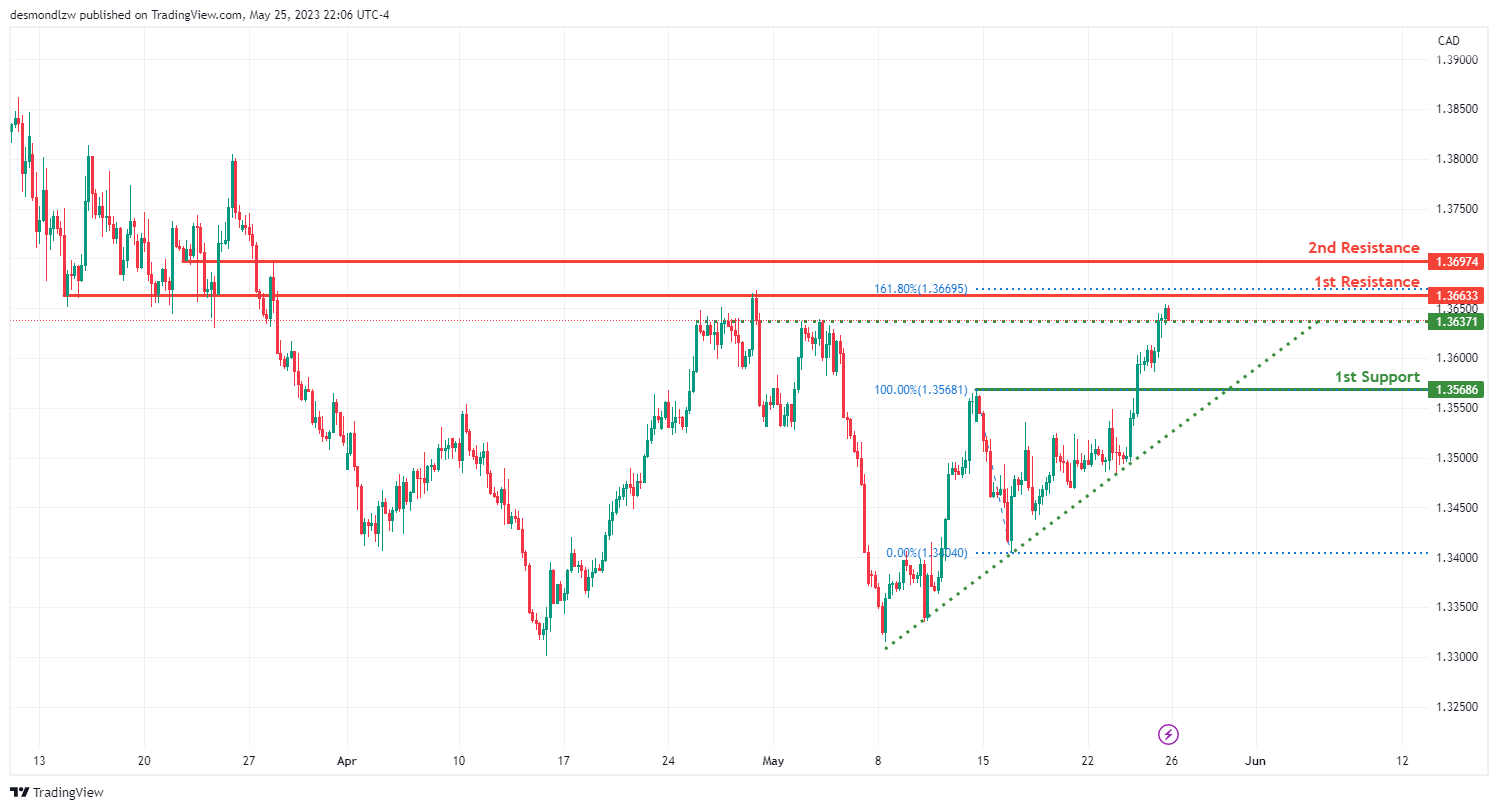
USD/CAD:
The USD/CAD pair is currently displaying a bullish momentum. This trend is influenced by the price being above a significant ascending trend line, which suggests further bullish movements.
In the short term, it’s likely that the price could drop to the first support level at 1.3568 before bouncing back and rising to the first resistance level at 1.3663. This first support level, identified as a pullback support, might provide a strong base to prevent further price drops.
Additionally, an intermediate support level at 0.6042 is acting as a swing low support, providing another potential base to halt any price declines.
As for resistance levels, the first resistance at 1.3663 is classified as an overlap resistance, coinciding with a 161.80% Fibonacci Extension, suggesting its significance as a potential price ceiling. The second resistance level at 0.6185, recognized as an overlap resistance, could further hinder an upward price movement.
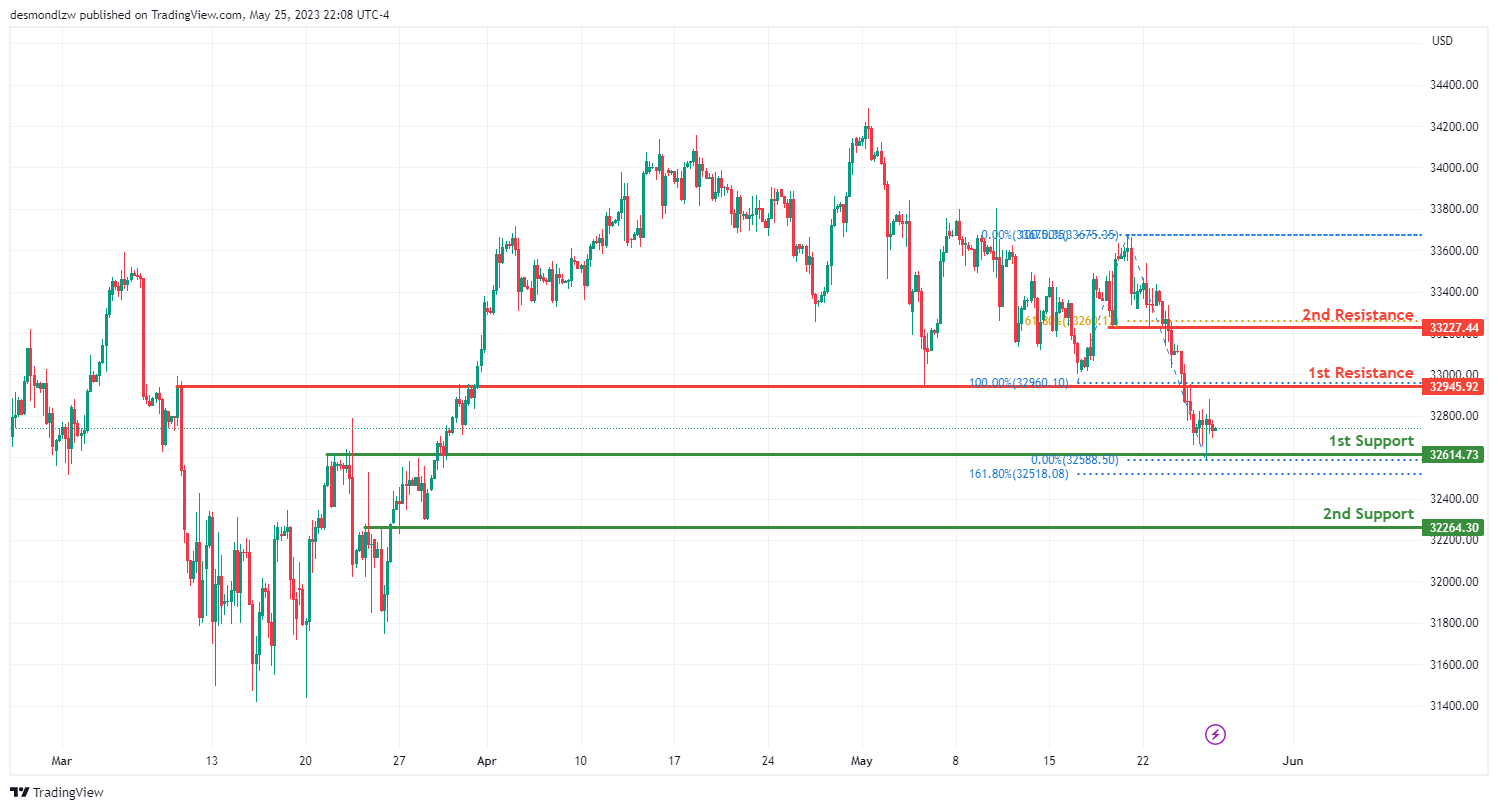
DJ30:
The DJ30 chart is currently displaying a bullish trend, suggesting potential for continued upward movement.
In the near term, there’s a possibility of a bullish continuation towards the first resistance level at 32945.92.
As for the support levels, the first one at 32614.73, known as an overlap support, might offer a strong foundation to prevent further declines in price. The second support level, placed at 32264.30, also recognized as an overlap support, might provide additional strength against a downward price movement.
Regarding the resistance levels, the first resistance at 32945.92 is identified as a pullback resistance, which could act as a potential barrier to price increase. The second resistance level at 33227.44, also classified as a pullback resistance, coincides with the 61.80% Fibonacci retracement, implying its significance as a potential price ceiling.
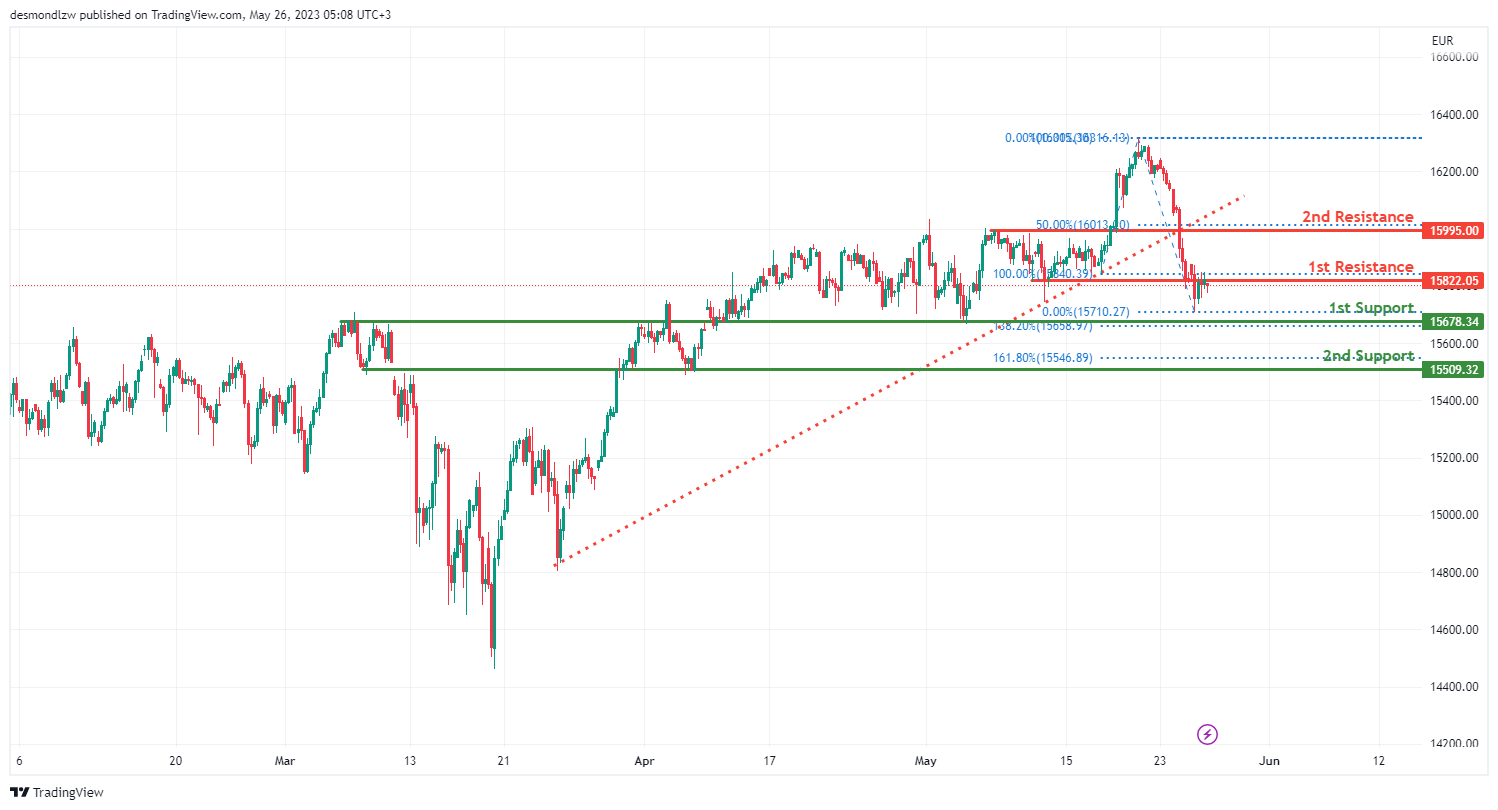
GER30:
The GER30 chart is currently exhibiting a bearish trend, indicating potential for further downward movement. A significant factor contributing to this momentum is that the price has broken below an ascending support line, signalling a potential bearish shift.
In the short term, we might see a bearish reaction at the first resistance level of 15822.05, which could lead to a decrease towards the first support level of 15678.34. The first support is an overlap support, and it aligns with the 138.20% Fibonacci extension, indicating its potential to act as a solid base to prevent further price drops.
There’s also a second support level at 15509.32, classified as an overlap support and aligning with the 161.80% Fibonacci retracement. This level could provide additional support in the event of a price decrease.
On the resistance side, the first resistance level at 15822.05 is recognized as an overlap resistance and could impede upward price movement. The second resistance level at 15995.00, known as a pullback resistance, coincides with the 50% Fibonacci retracement, suggesting its potential to act as a barrier to price increase.
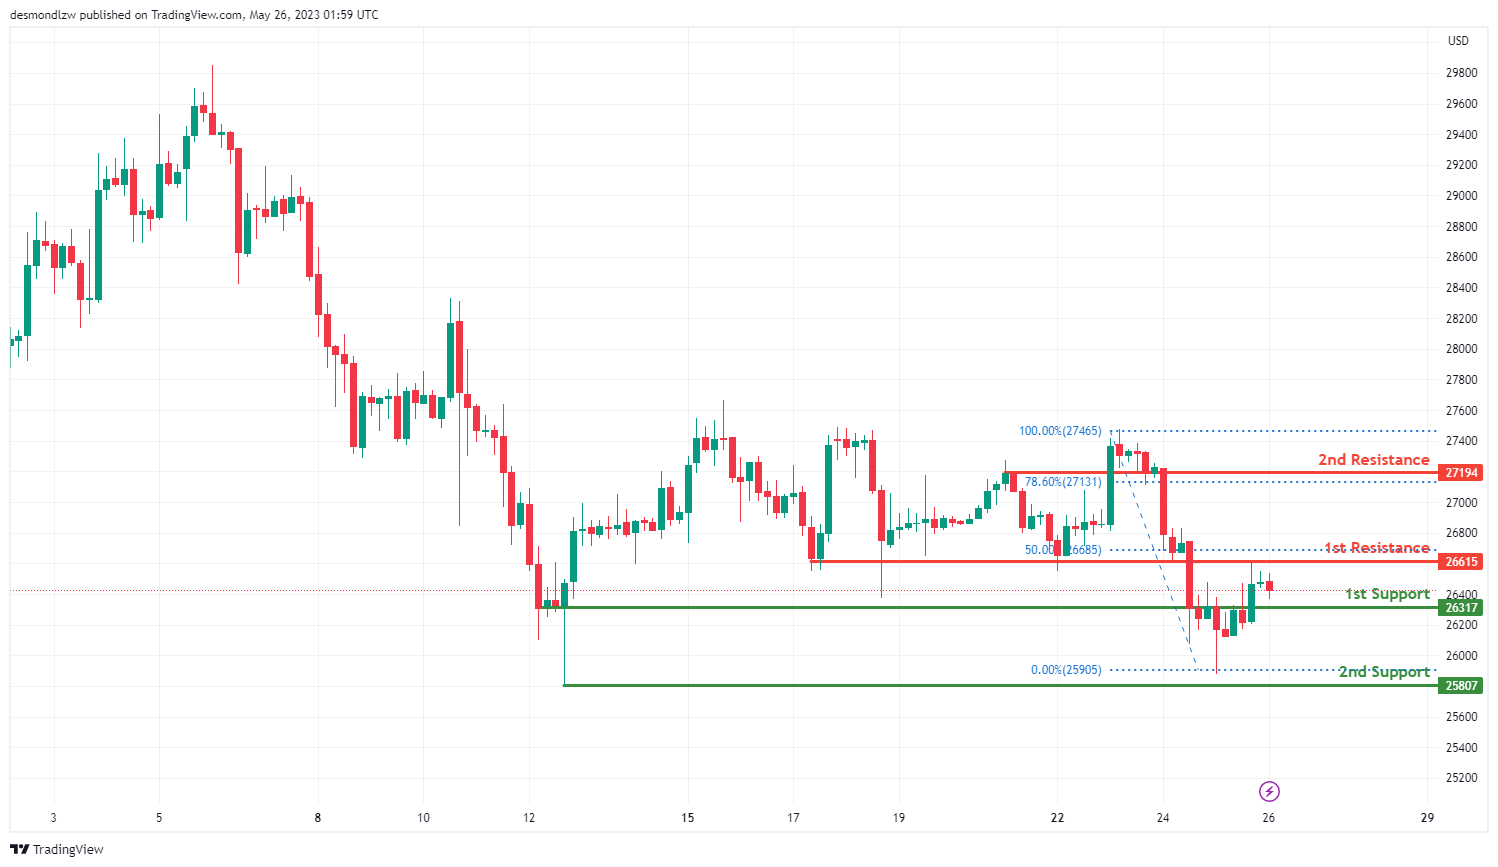
BTC/USD:
The BTC/USD chart is currently demonstrating a bearish trend, suggesting potential for continued downward movement.
In the short run, there’s a possibility for a bearish continuation towards the first support level at 26317. This level serves as a pullback support, which might provide a solid base to prevent further price drops.
There’s also a second support level at 25807, which is identified as a swing low support. This level could add another layer of support in case of a price decrease.
On the resistance side, the first resistance level is at 26615, recognized as an overlap resistance and coinciding with a 50% Fibonacci retracement. This suggests its significance as a potential price ceiling.
Moreover, there’s a second resistance level at 27194, known as a pullback resistance. This level aligns with a 78.60% Fibonacci retracement, indicating its potential to obstruct an upward price movement.
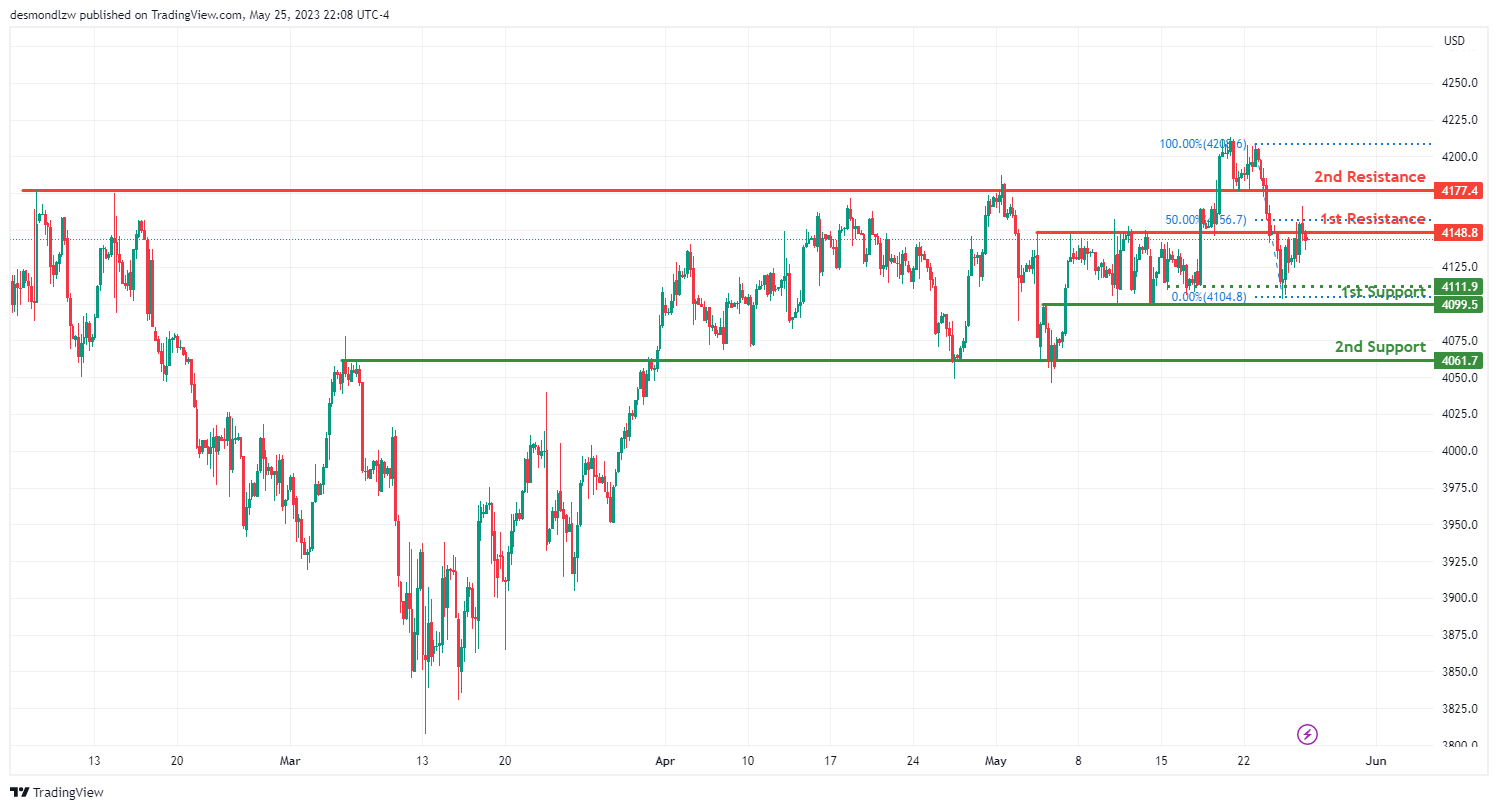
US500
The US500 chart is currently indicating a bearish momentum, suggesting the potential for continued downward trends.
In the near term, a bearish response off the first resistance level at 4148.8 could lead to a decline towards the first support level at 4099.5. This first resistance level is recognized as an overlap resistance, aligning with a 50% Fibonacci retracement, which hints at its potential to act as a limit for price hikes.
Moreover, a second resistance level at 4177.4, identified as a pullback resistance, could further obstruct an upward price movement.
In terms of support, the first support level at 4099.5, known as an overlap support, might provide a strong foundation to prevent further drops in price. Additionally, there’s a second support level at 4061.7, also recognized as an overlap support, adding to the potential for price support in the event of a downward shift in price.
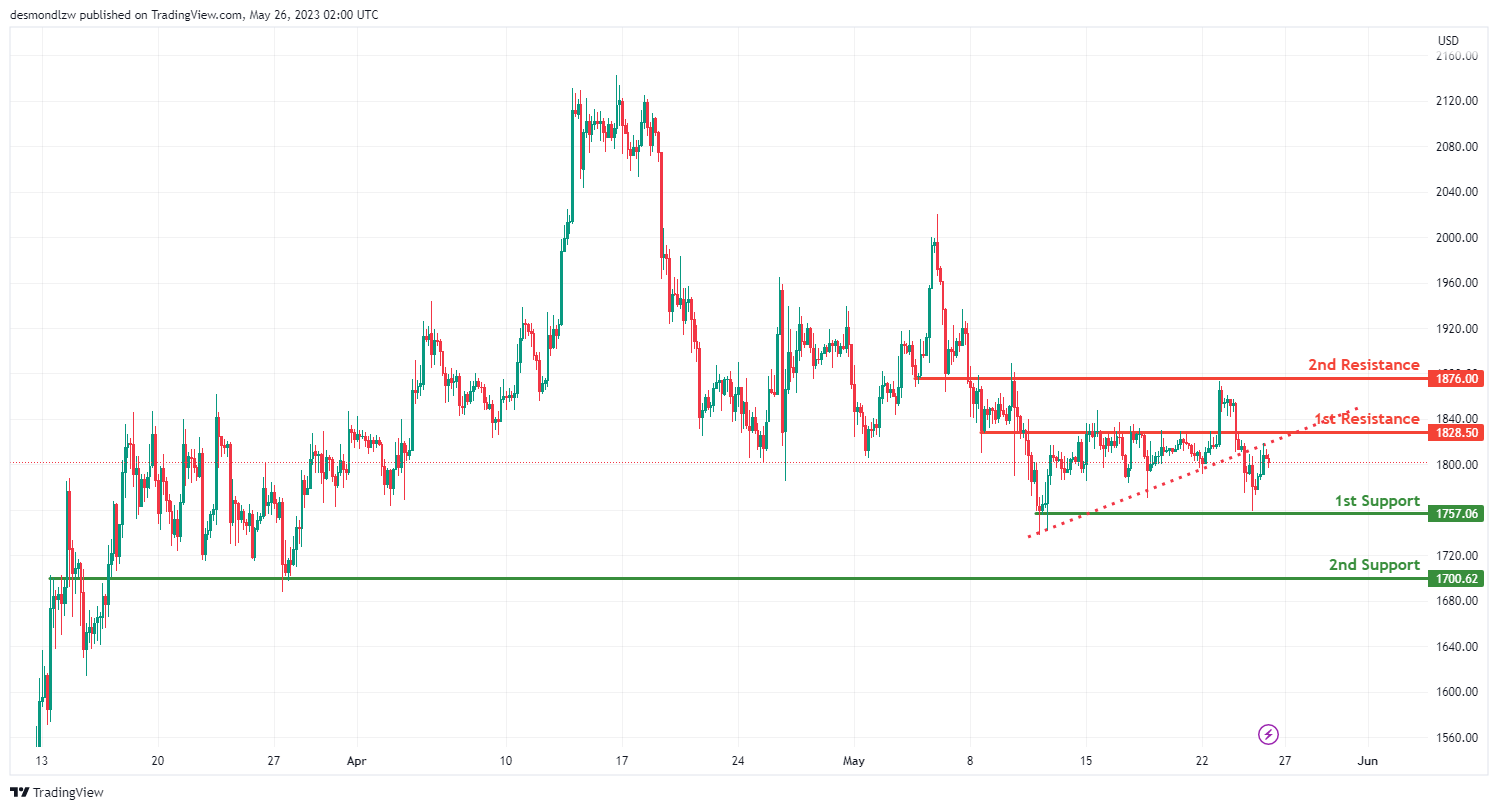
ETH/USD:
The ETH/USD chart currently shows a bearish momentum, which seems to have been triggered by the price breaking below an ascending support line.
In the short term, we could see a bearish response at the first resistance level of 1828.50, leading to a drop towards the first support level of 1757.06. This first resistance level is recognized as an overlap resistance, suggesting its potential to act as a barrier to price increases.
A second resistance level at 1876.00, also classified as an overlap resistance, could further challenge upward price movements.
In terms of support, the first support level at 1757.06, known as a multi-swing low support, could provide a sturdy base to prevent additional price drops. Furthermore, there’s a second support level at 1700.62, which is identified as an overlap support. This could add further strength to the price support in the event of a downward shift in price.
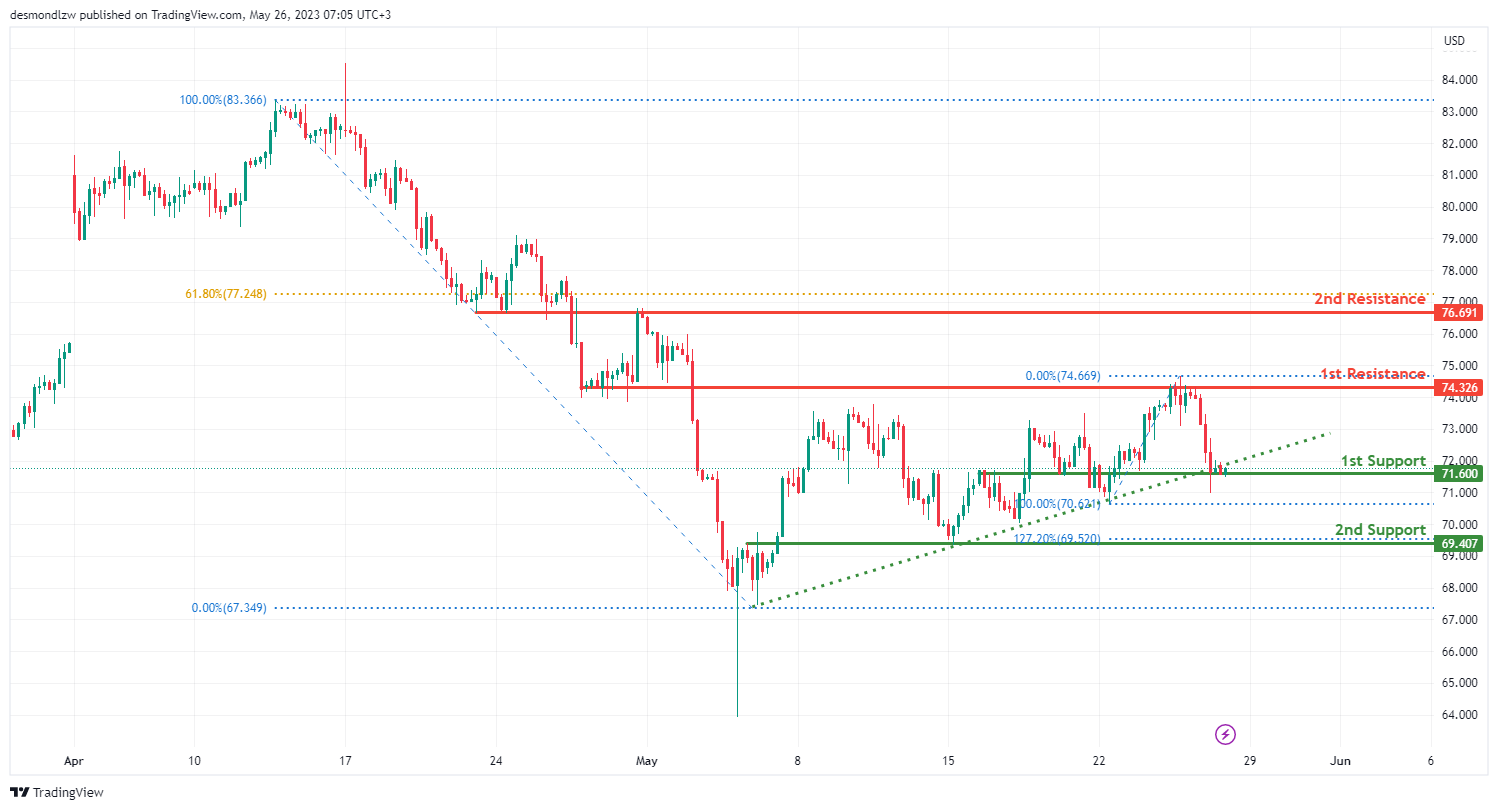
WTI/USD:
The WTI chart currently shows a bullish momentum, which seems to be reinforced by the price being above a major ascending trend line, indicating a potential for further upward movement.
In the near term, we could see a bullish bounce off the first support level at 71.60, followed by an upward movement towards the first resistance level at 74.32. This first support level is identified as a pullback support, suggesting its potential to act as a solid base to prevent further price decreases.
A second support level exists at 69.40, also recognized as an overlap support, which could further bolster the potential for price support in the event of a downward shift in price.
On the other hand, the first resistance level at 74.32, classified as an overlap resistance, could pose a challenge to further price increases. Similarly, a second resistance level at 76.69, also identified as an overlap resistance, could pose an additional challenge to upward price movements.
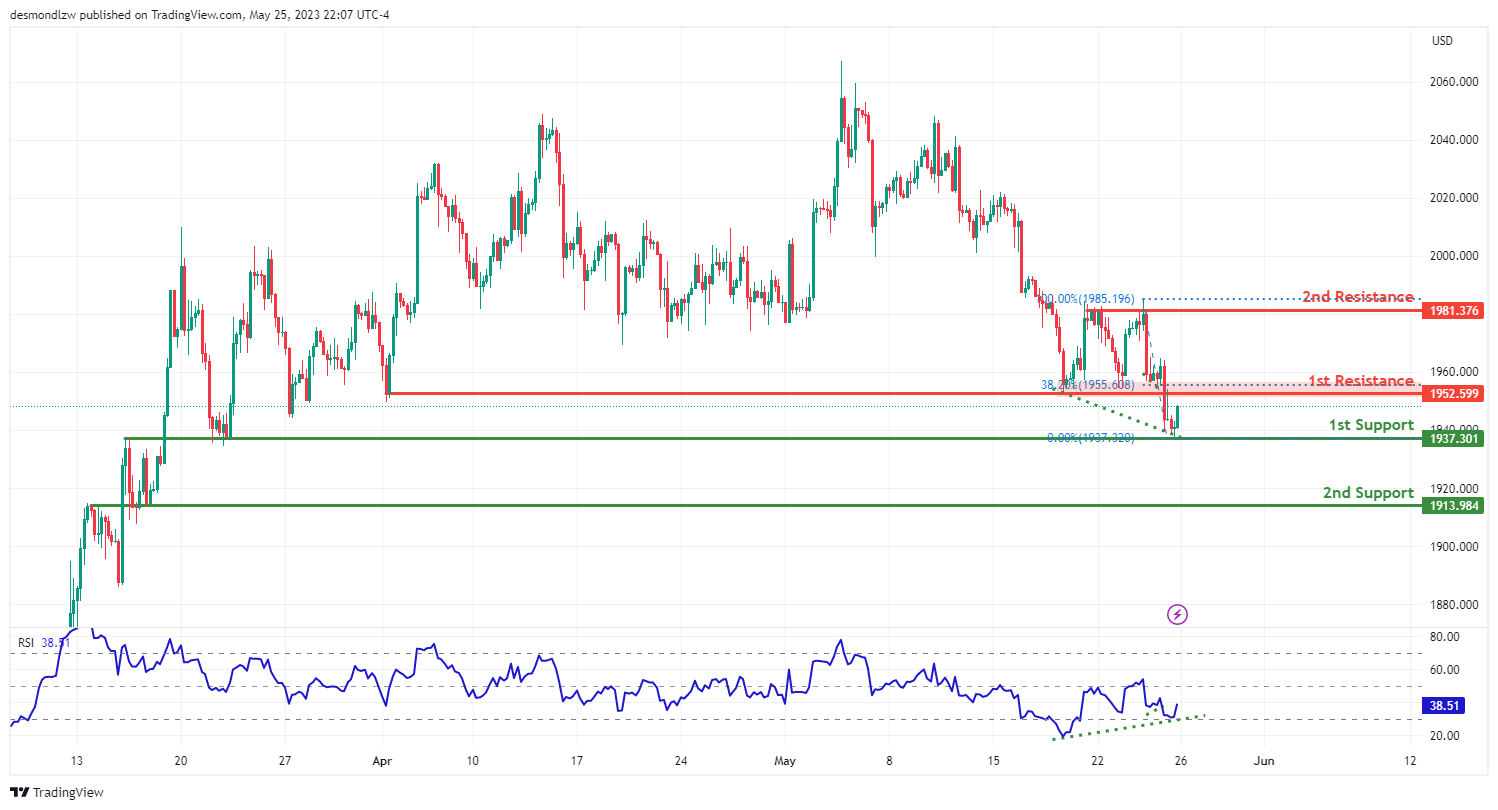
XAU/USD (GOLD):
The XAU/USD (Gold) chart currently shows bullish momentum. We could potentially see a bullish bounce off the first support level at 1937.30, leading to an increase towards the first resistance at 1952.59.
The first support level at 1937.30 is an overlap support, which could act as a solid base to prevent further price decreases. If the price drops further, a second support level exists at 1913.98, also identified as an overlap support.
On the resistance side, the first resistance level is at 1952.59, and is considered a pullback resistance and corresponds to the 38.20% Fibonacci retracement level. If the price breaks this level, it could face a second resistance at 1981.37, which is identified as a multi-swing high resistance. This is a critical level that has been tested multiple times in the past, making it a strong resistance level.
The Relative Strength Index (RSI) is also displaying bullish divergence versus price, which can often be a signal of potential bullish reversal. This suggests that the price of Gold might see a rapid increase soon. However, always consider other factors and use appropriate risk management strategies when trading.


