
DXY:
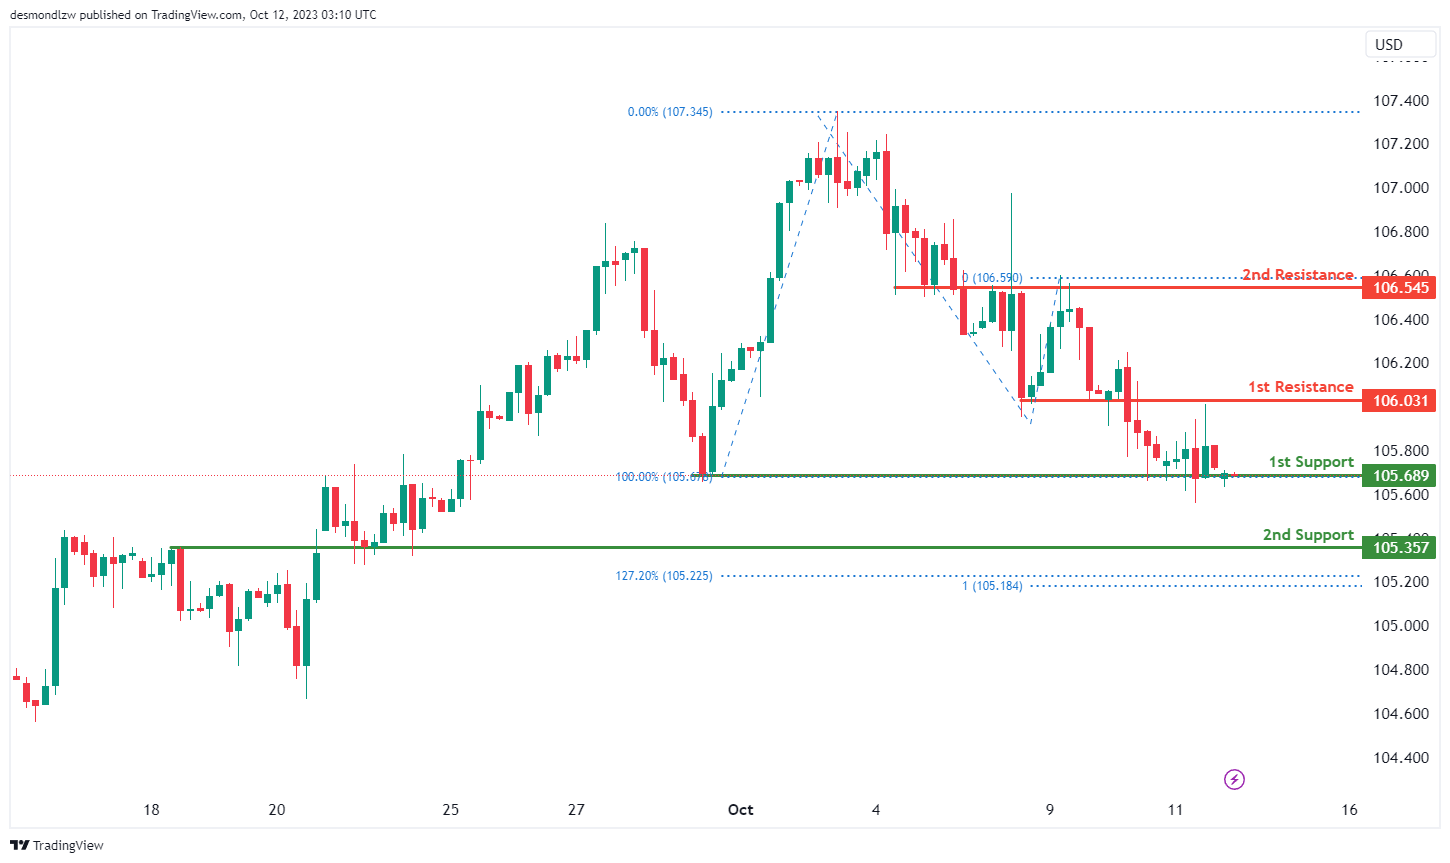
The DXY (US Dollar Index) chart currently exhibits bullish momentum, suggesting the potential scenario of a bullish bounce off the 1st support level with a subsequent move towards the 1st resistance.
The 1st support at 105.68 is considered significant as it is identified as a multi-swing low support, indicating a potential area where buying interest may emerge. Additionally, the 2nd support at 105.36 is characterized as an overlap support, further reinforcing its importance as a potential level for price rebounds.
On the resistance side, the 1st resistance level at 106.03 is identified as an overlap resistance, suggesting it could act as a strong barrier to upward price movement. Beyond this, the 2nd resistance at 106.54 is also characterized as an overlap resistance, adding to its significance as a potential area where selling pressure may emerge.
EUR/USD:
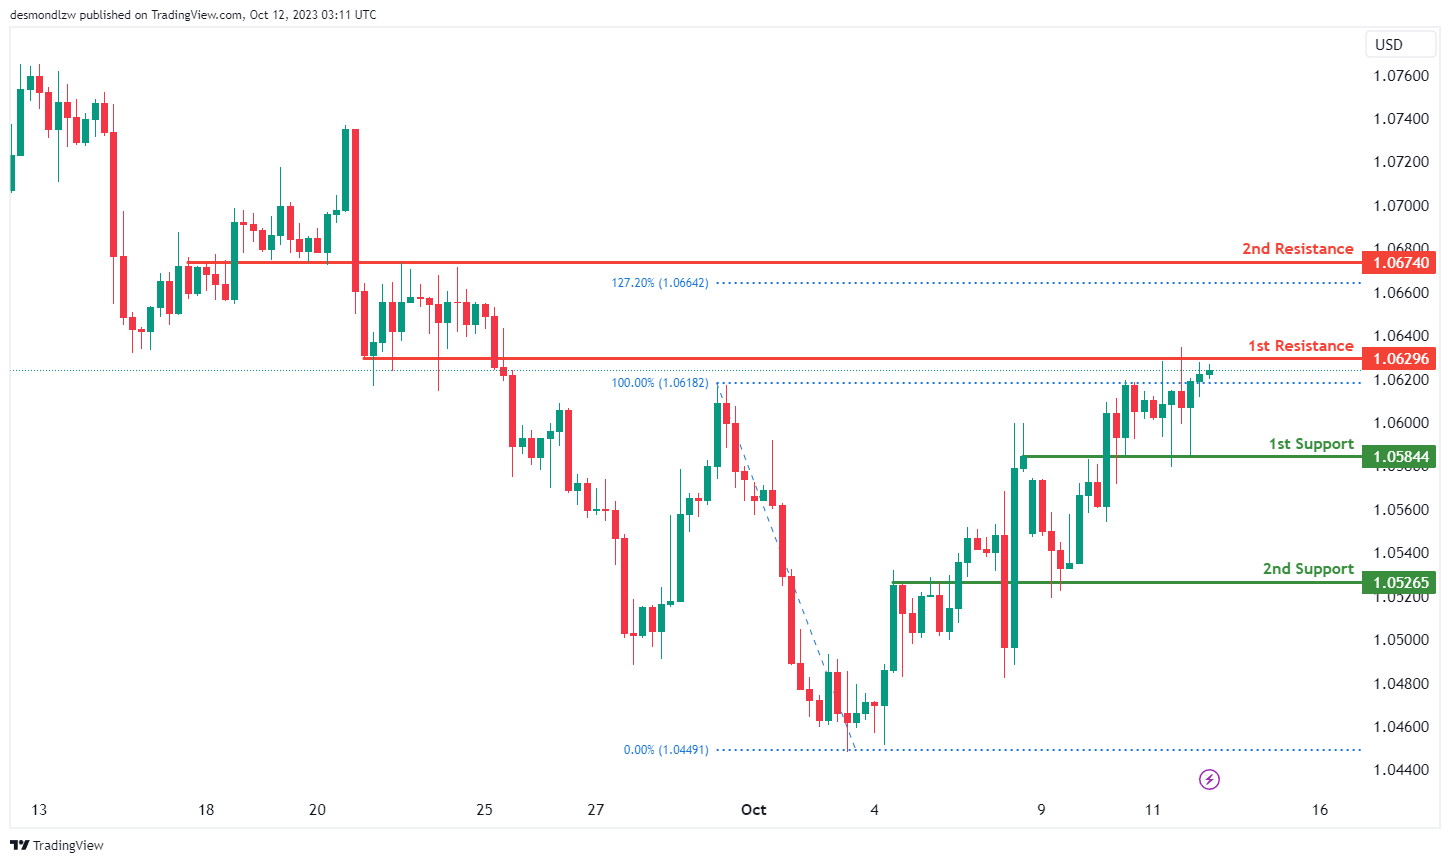
The EUR/USD chart currently shows a bearish momentum, indicating the potential scenario of a bearish reaction off the 1st resistance level, followed by a drop towards the 1st support.
The 1st support at 1.0584 is considered significant as it is identified as an overlap support, suggesting it may act as a level where buying interest could emerge. Additionally, the 2nd support at 1.0526 is also characterized as an overlap support, reinforcing its importance as a potential level for price rebounds.
On the resistance side, the 1st resistance level at 1.0629 is identified as an overlap resistance, indicating it could serve as a strong barrier to upward price movement. Beyond this, the 2nd resistance at 1.0674 is also characterized as an overlap resistance and coincides with the 127.20% Fibonacci Extension level, further adding to its significance as a potential area where selling pressure may emerge.
EUR/JPY:
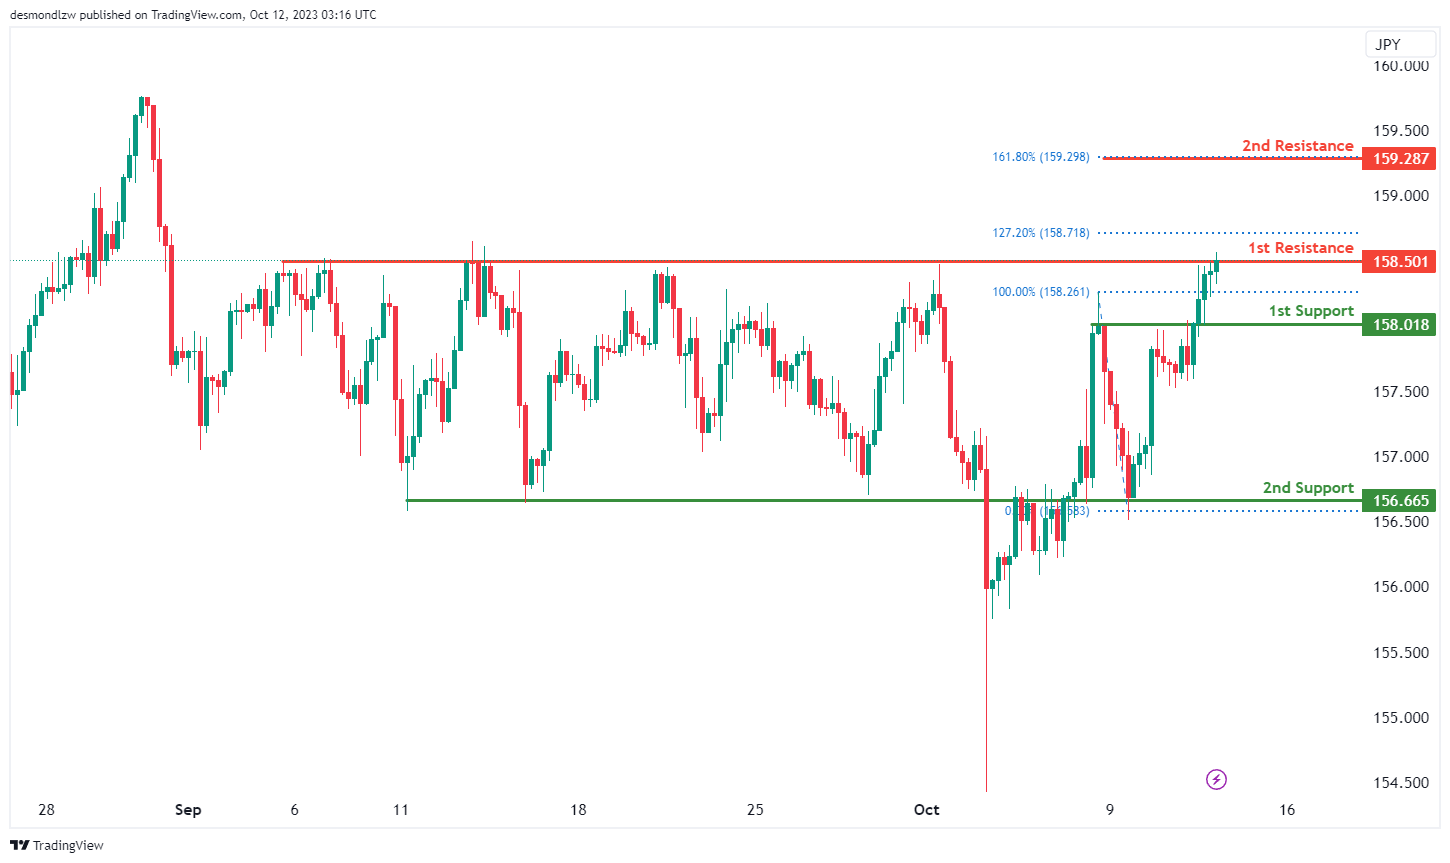
The EUR/JPY chart currently demonstrates a bearish momentum, suggesting a potential scenario of a bearish reaction off the 1st resistance level, followed by a drop towards the 1st support.
The 1st support at 158.01 is considered significant as it’s identified as an overlap support, indicating a potential area where buying interest could materialize. Additionally, the 2nd support at 156.66 is also characterized as an overlap support, reinforcing its importance as a potential level for price rebounds.
On the resistance side, the 1st resistance level at 158.50 is identified as a multi-swing high resistance, making it a robust level where selling pressure may intensify, leading to a bearish reaction. Beyond this, the 2nd resistance at 159.28 is associated with the 161.80% Fibonacci Retracement, adding to its significance as a potential area where selling pressure may emerge.
EUR/GBP:
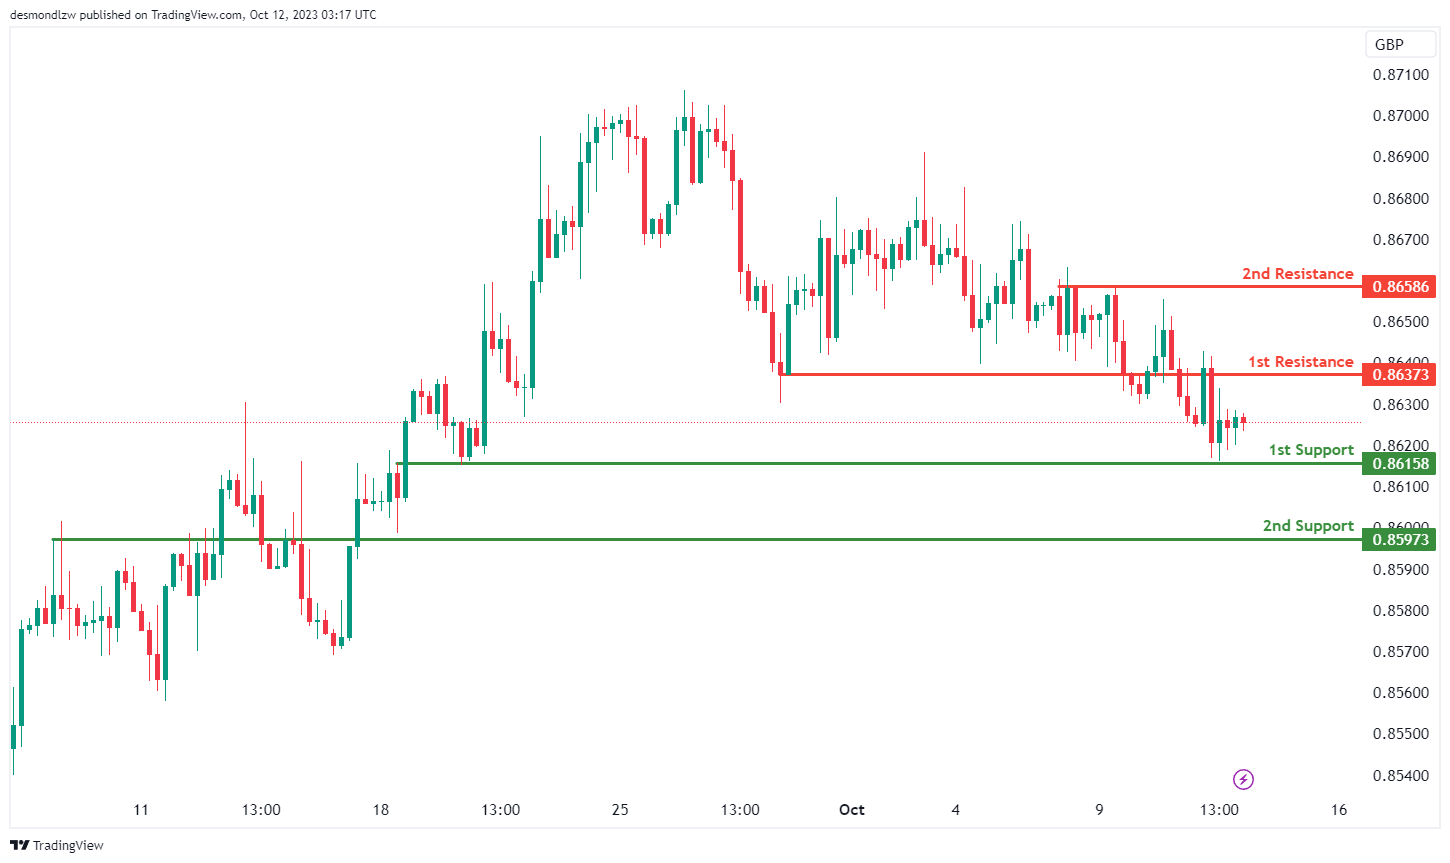
The EUR/GBP chart is currently exhibiting a neutral momentum, indicating the potential scenario of price fluctuating between the 1st resistance and the 1st support level.
The 1st support at 0.8615 is considered significant as it’s identified as an overlap support. This level may attract buying interest and act as a potential area for price bounce. Additionally, the 2nd support at 0.8597 is also characterized as an overlap support, reinforcing its importance as a level where price could find support.
On the resistance side, the 1st resistance level at 0.8637 is identified as an overlap resistance, indicating a zone where selling pressure may increase. Beyond this, the 2nd resistance at 0.8658 is associated with multi-swing high resistance, making it another key level where sellers may become more active.
GBP/USD:
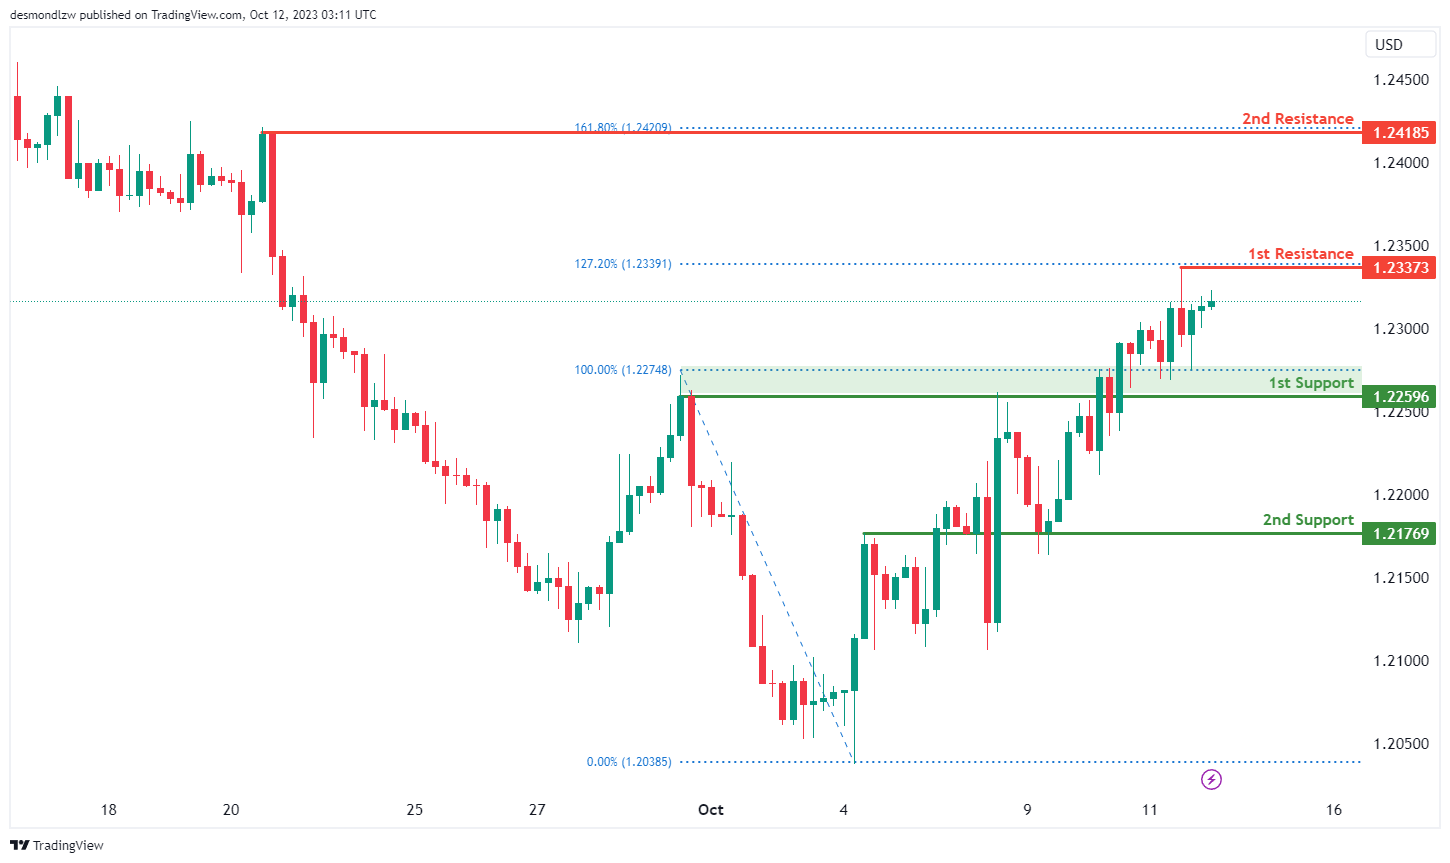
The GBP/USD chart currently exhibits bearish momentum, suggesting a potential scenario of a bearish reaction off the 1st resistance level, followed by a drop towards the 1st support.
The 1st support at 1.2259 is considered significant as it’s identified as an overlap support, indicating that it may act as a level where buying interest could emerge. Additionally, the 2nd support at 1.2176 is also characterized as an overlap support, reinforcing its importance as a potential level for price rebounds.
On the resistance side, the 1st resistance level at 1.2337 is identified as a swing high resistance, and it’s noteworthy for being located at the 127.20% Fibonacci Extension level, suggesting it could serve as a strong barrier to upward price movement. Beyond this, the 2nd resistance at 1.2418 is also characterized as a swing high resistance and is positioned at the 161.80% Fibonacci Extension level, further adding to its significance as a potential area where selling pressure may emerge.
GBP/JPY:
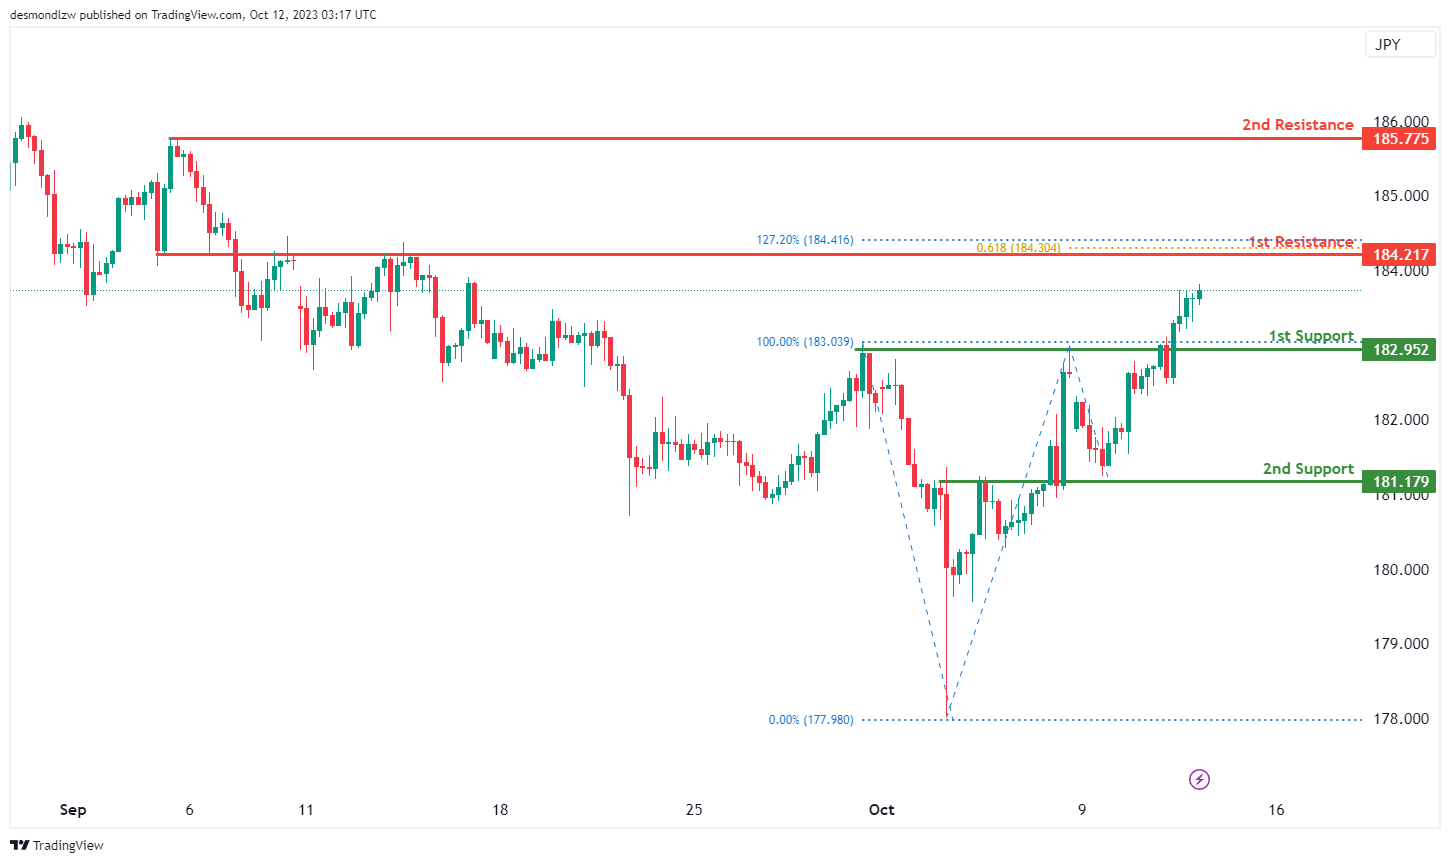
The GBP/JPY chart currently exhibits a bullish momentum, suggesting the potential scenario of a bullish continuation towards the 1st resistance.
The 1st support at 182.95 is considered significant as it’s identified as a pullback support level. This support area may attract buying interest and provide a potential bounce for the price. Additionally, the 2nd support at 181.17 is characterized as an overlap support, reinforcing its importance as a level where price could find support.
On the resistance side, the 1st resistance level at 194.21 is identified as an overlap resistance, indicating a zone where selling pressure may increase. This level also coincides with both the 127.20% Fibonacci Extension and the 61.80% Fibonacci Projection, signifying a potential Fibonacci confluence zone, which could make it a strong resistance area. Beyond this, the 2nd resistance at 185.77 is associated with swing high resistance.
USD/CHF:
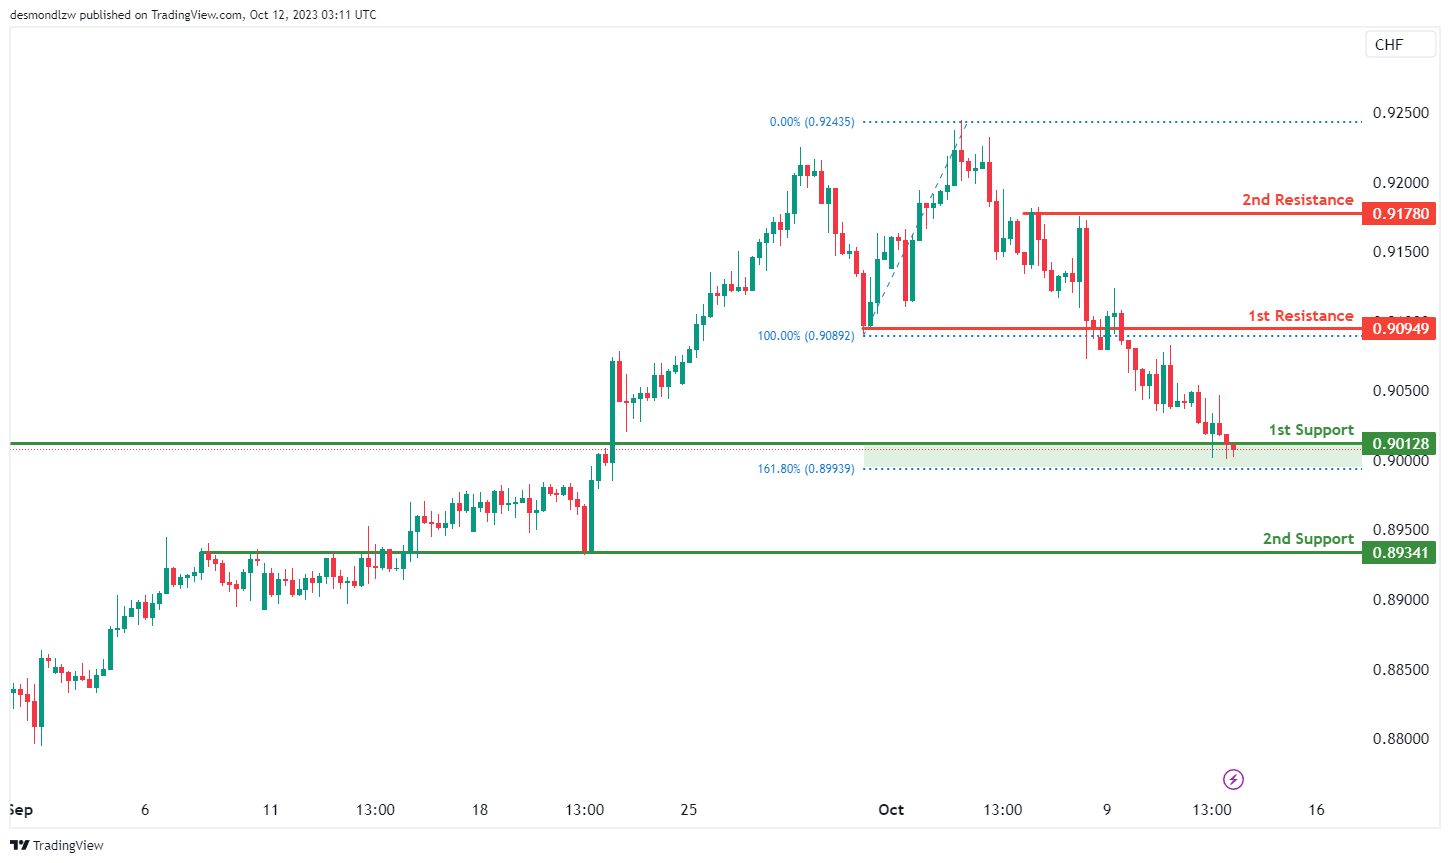
The USD/CHF chart currently exhibits bullish momentum, suggesting a potential scenario of a bullish bounce off the 1st support level, followed by a move towards the 1st resistance.
The 1st support at 0.9012 is considered significant as it’s identified as a pullback support, and it coincides with the 161.80% Fibonacci Extension level. This suggests that it may act as a strong level of support where buying interest could emerge. Additionally, the 2nd support at 0.8934 is characterized as an overlap support, reinforcing its importance as a potential level for price rebounds.
On the resistance side, the 1st resistance level at 0.9094 is identified as an overlap resistance, indicating that it may serve as a barrier to upward price movement. Beyond this, the 2nd resistance at 0.9178 is characterized as a multi-swing high resistance, further adding to its significance as a potential area where selling pressure may emerge.
USD/JPY:
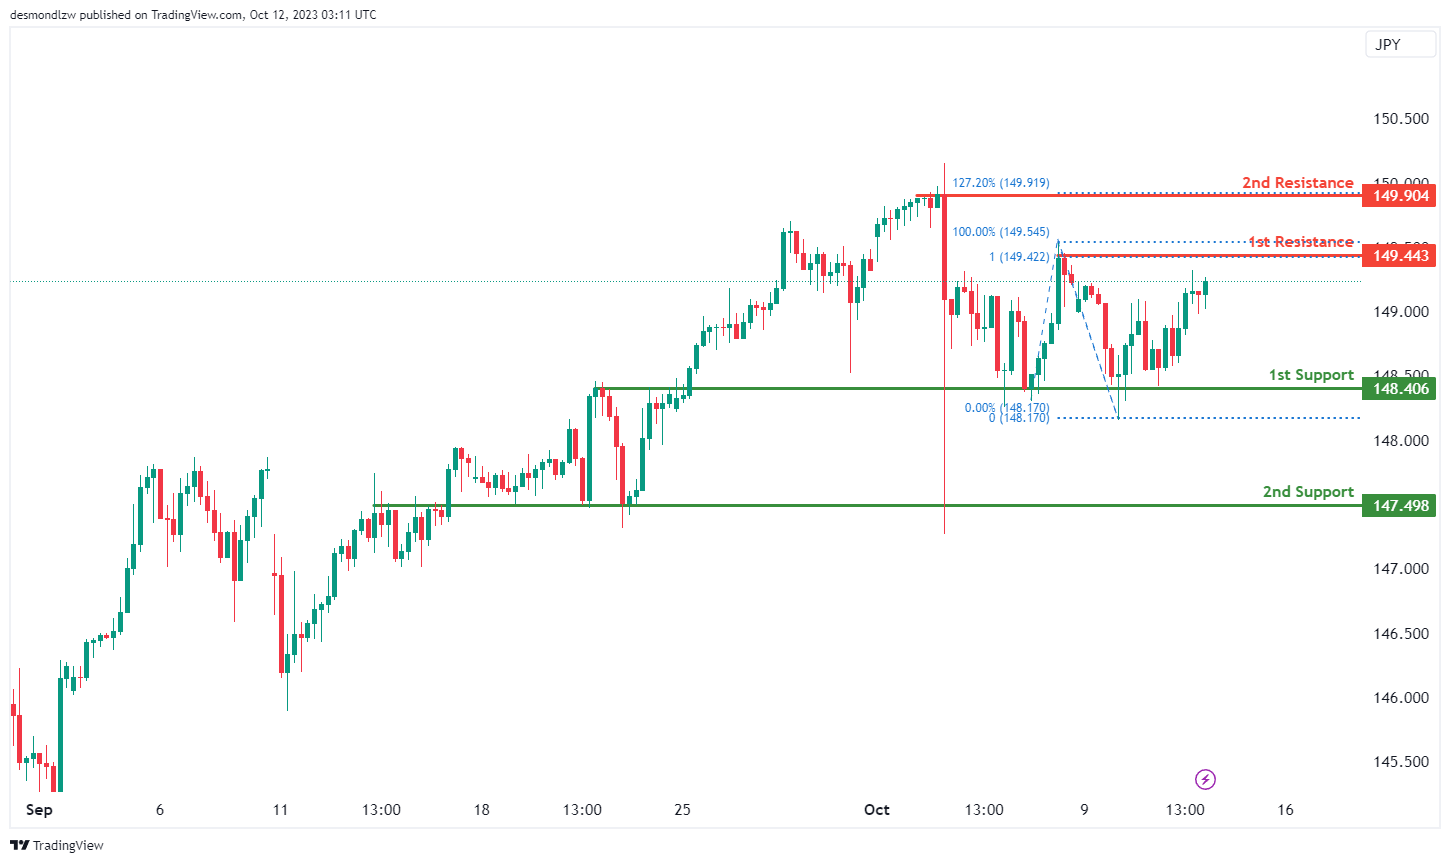
The USD/JPY chart currently exhibits bearish momentum, suggesting a potential scenario of a bearish reaction off the 1st resistance level, followed by a drop towards the 1st support.
The 1st support at 148.40 is considered significant as it’s identified as an overlap support, potentially acting as a strong level where buying interest could emerge. Additionally, the 2nd support at 147.49 is characterized as an overlap support, reinforcing its importance as a potential level for price rebounds.
On the resistance side, the 1st resistance level at 149.44 is identified as a swing high resistance, and it coincides with the 100% Fibonacci Projection, making it a robust level of resistance where selling pressure may intensify. Beyond this, the 2nd resistance at 149.90 is characterized as a multi-swing high resistance and aligns with the 127.20% Fibonacci Extension, further adding to its significance as a potential area where selling pressure may emerge.
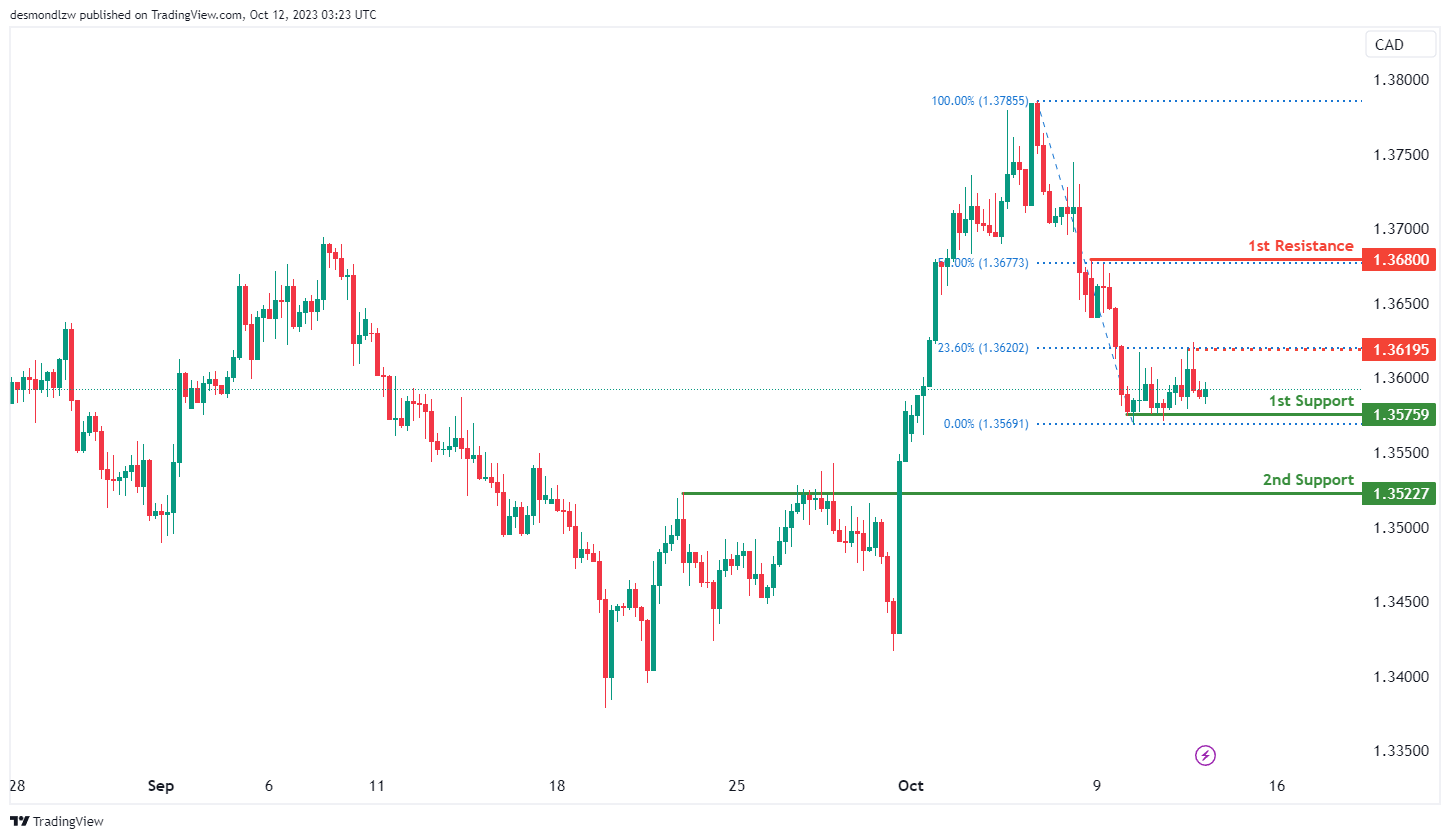
USD/CAD:
The USD/CAD chart is currently showing a neutral momentum with a potential scenario for price to fluctuate between the intermediate resistance and the 1st support levels.
The 1st support level at 1.3576 is identified as a pullback support. Additionally, the 2nd support level at 1.3523 is also noted as a pullback support, further reinforcing its significance as an area where the price may find support.
To the upside, the intermediate resistance at 1.3619 is identified as a pullback resistance that aligns with the 23.60% Fibonacci retracement level. Higher up, the 1st resistance level at 1.3680 is also marked as a pullback resistance that aligns with the 50.00% Fibonacci retracement level, further emphasizing its significance as a barrier for future price increases.
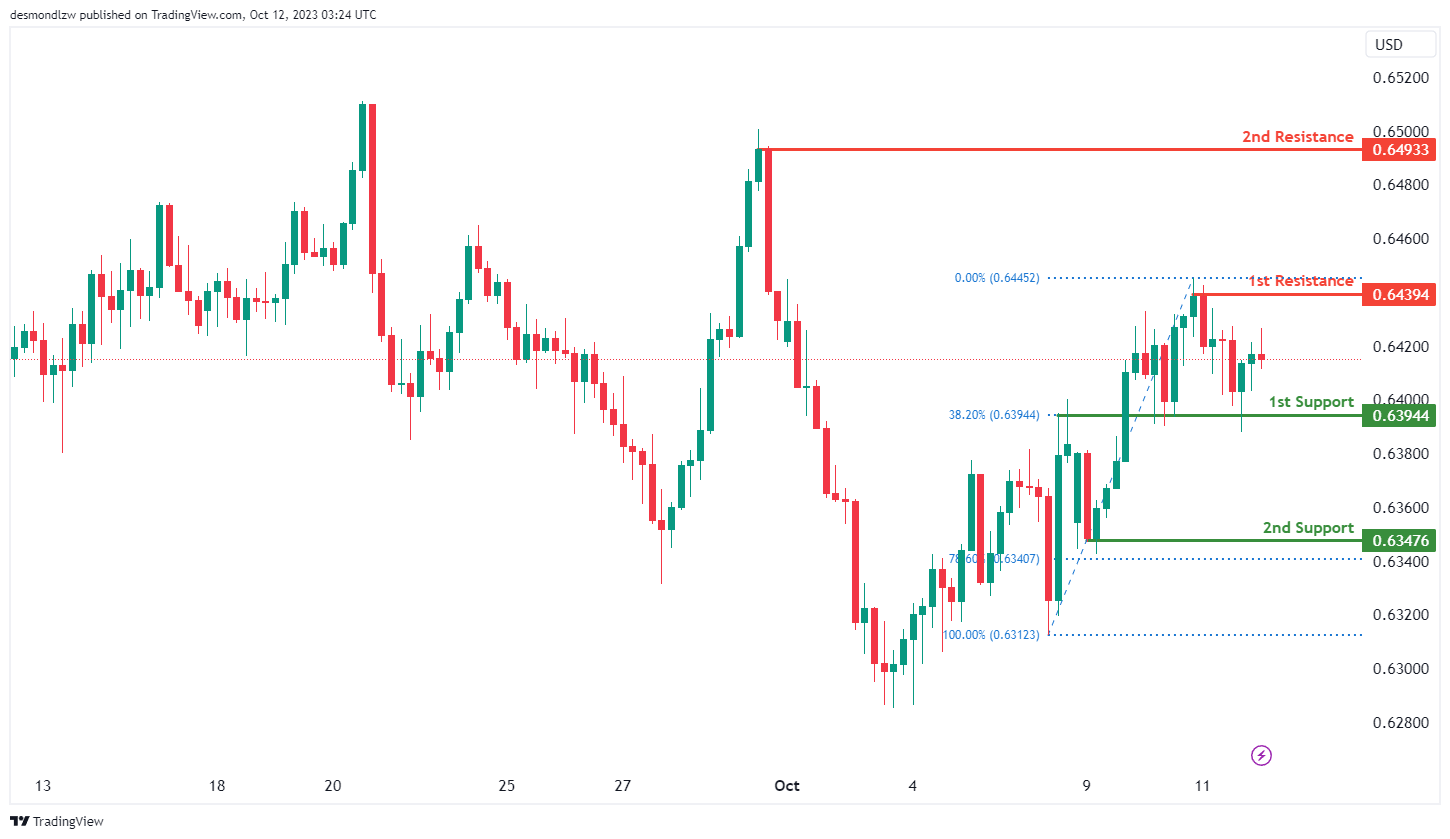
AUD/USD:
The AUD/USD chart currently exhibits a neutral momentum with a potential scenario for price to fluctuate between the 1st resistance and the 1st support levels.
The 1st support level at 0.6394 is identified as an overlap support that aligns with the 38.20% Fibonacci retracement level. Further below, the 2nd support level at 0.6348 is marked as a pullback support that aligns with the 78.60% Fibonacci retracement level, reinforcing its importance as a potential support level.
To the upside, the 1st resistance level at 0.6439 is identified as a pullback resistance. Additionally, the 2nd resistance level at 0.6493 is noted as a swing-high resistance, further emphasizing its significance as a barrier for future price increases.
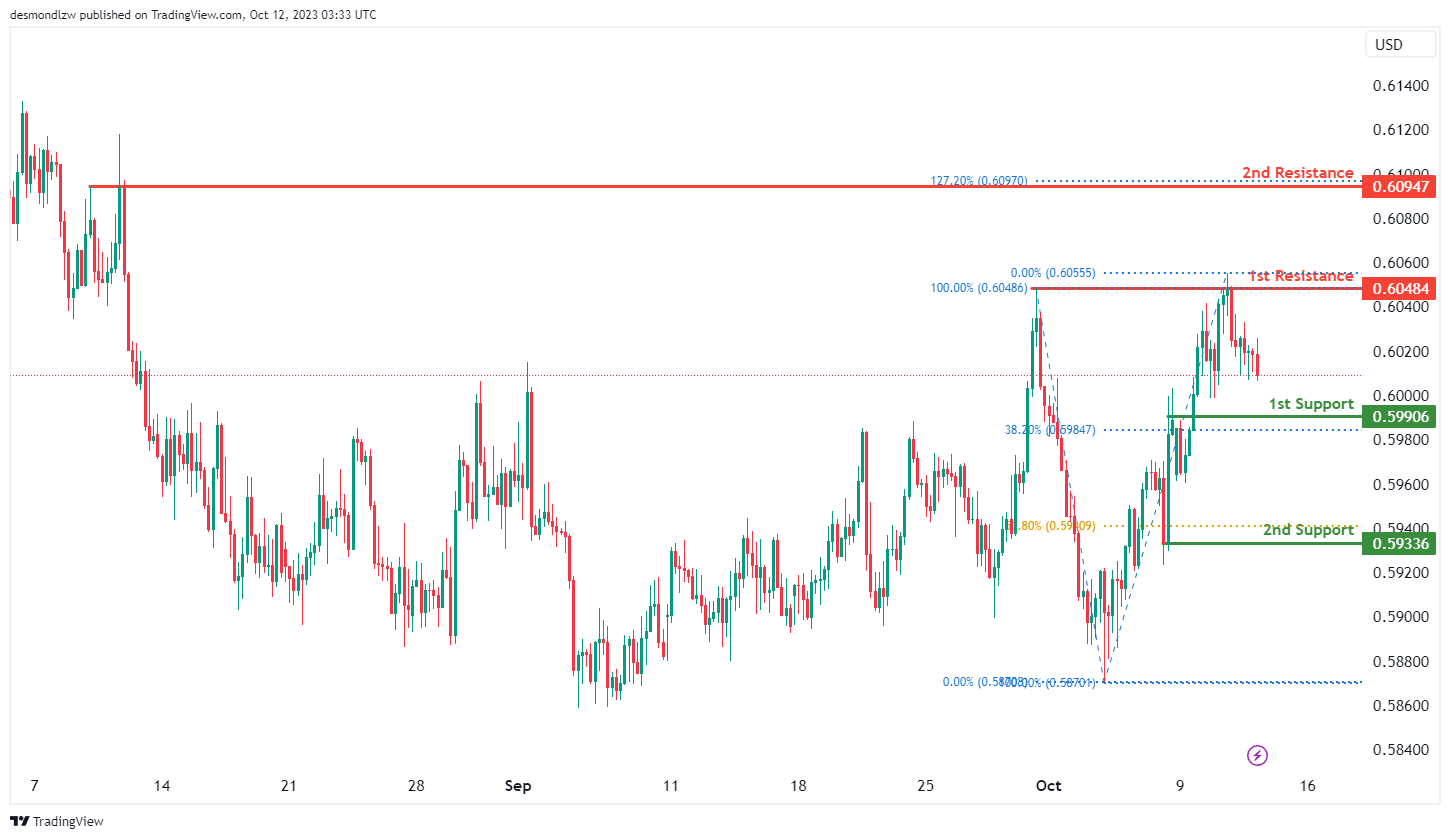
NZD/USD
The NZD/USD chart currently exhibits an overall bearish momentum with a potential scenario for price to make a bearish continuation towards the 1st support level.
The 1st support level at 0.5991 is identified as a pullback support that aligns with the 38.20% Fibonacci retracement level. Further below, the 2nd support level at 0.5934 is also noted as a pullback support that aligns with the 61.80% Fibonacci retracement level, further reinforcing its significance as an area where price may find support.
The 1st resistance level at 0.6048 is identified as a pullback resistance. Additionally, the 2nd resistance level at 0.6095 is also marked as a pullback resistance that aligns with the 127.20% Fibonacci extension level, further emphasizing its significance as a barrier for future price increases.
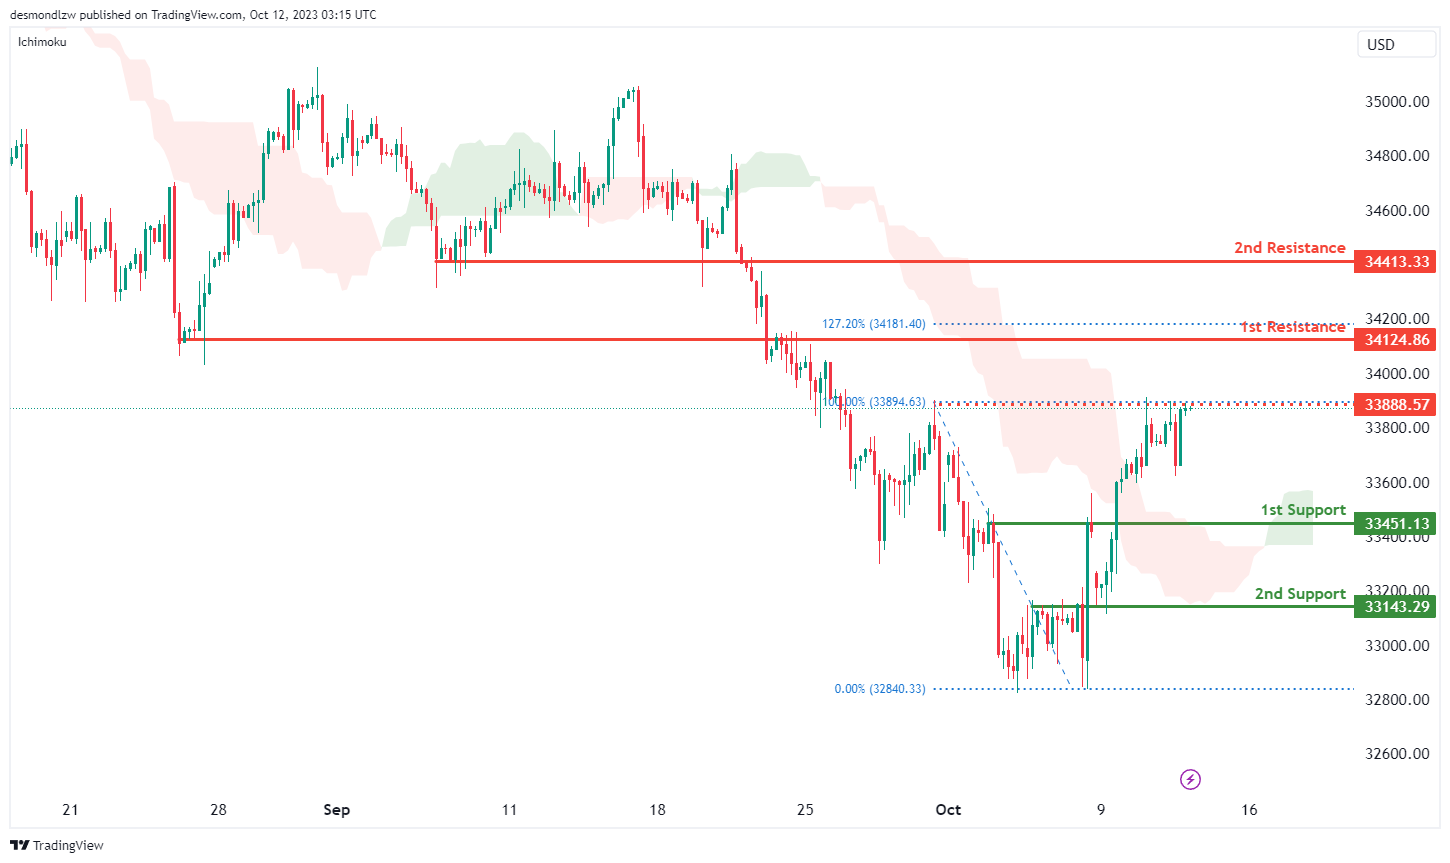
DJ30:
The DJ30 (Dow Jones Industrial Average) chart currently exhibits a bullish momentum, suggesting the potential scenario of a bullish continuation towards the 1st resistance.
The 1st support at 33451.13 is considered significant as it’s identified as a pullback support level. This support area may attract buying interest and provide a potential bounce for the price. Additionally, the 2nd support at 33143.29 is characterized as an overlap support, reinforcing its importance as a level where price could find support.
On the resistance side, the 1st resistance level at 34124.86 is identified as an overlap resistance, indicating a zone where selling pressure may increase. This level also coincides with the 127.20% Fibonacci Extension, signifying a potential Fibonacci confluence zone, which could make it a strong resistance area. Beyond this, the 2nd resistance at 34413.33 is associated with pullback resistance. There’s also an intermediate resistance at 33888.57, characterized as multi-swing high resistance.
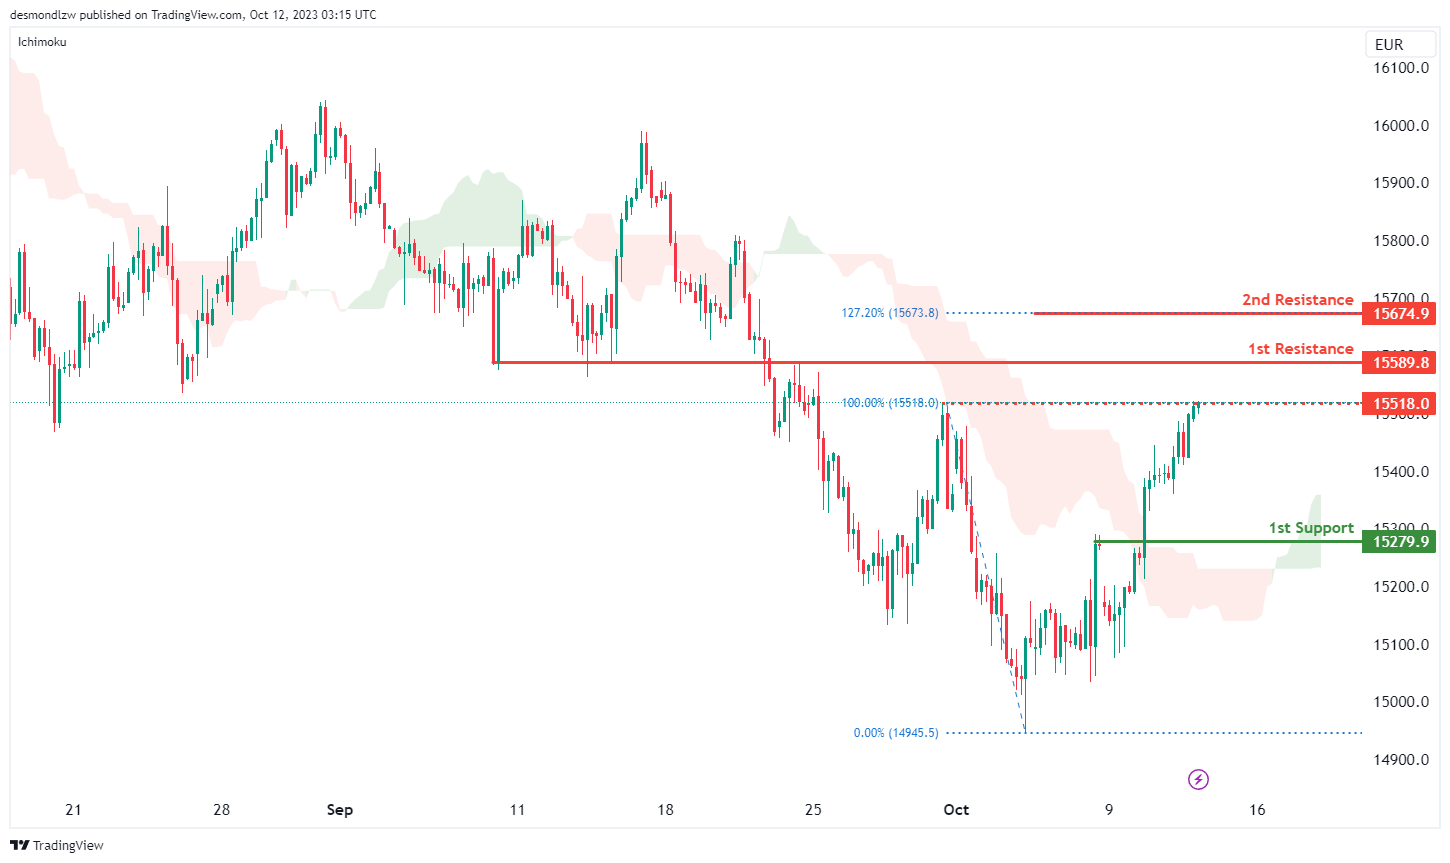
GER40:
The GER40 (DAX) chart currently exhibits a bullish momentum, with price trading above the bullish Ichimoku cloud. This suggests a positive outlook for the chart.
The 1st support at 15279.90 is identified as a pullback support level, indicating that it could act as a significant area of price support, potentially preventing sharp declines.
On the resistance side, the 1st resistance level at 15589.80 is considered an overlap resistance. This level may present a zone where selling interest could emerge. Additionally, the 2nd resistance at 15674.90 is noted, and it coincides with the 127.20% Fibonacci Extension, which may act as a strong resistance area due to this Fibonacci confluence. There is also an intermediate resistance at 15518.00, characterized as a swing high resistance.
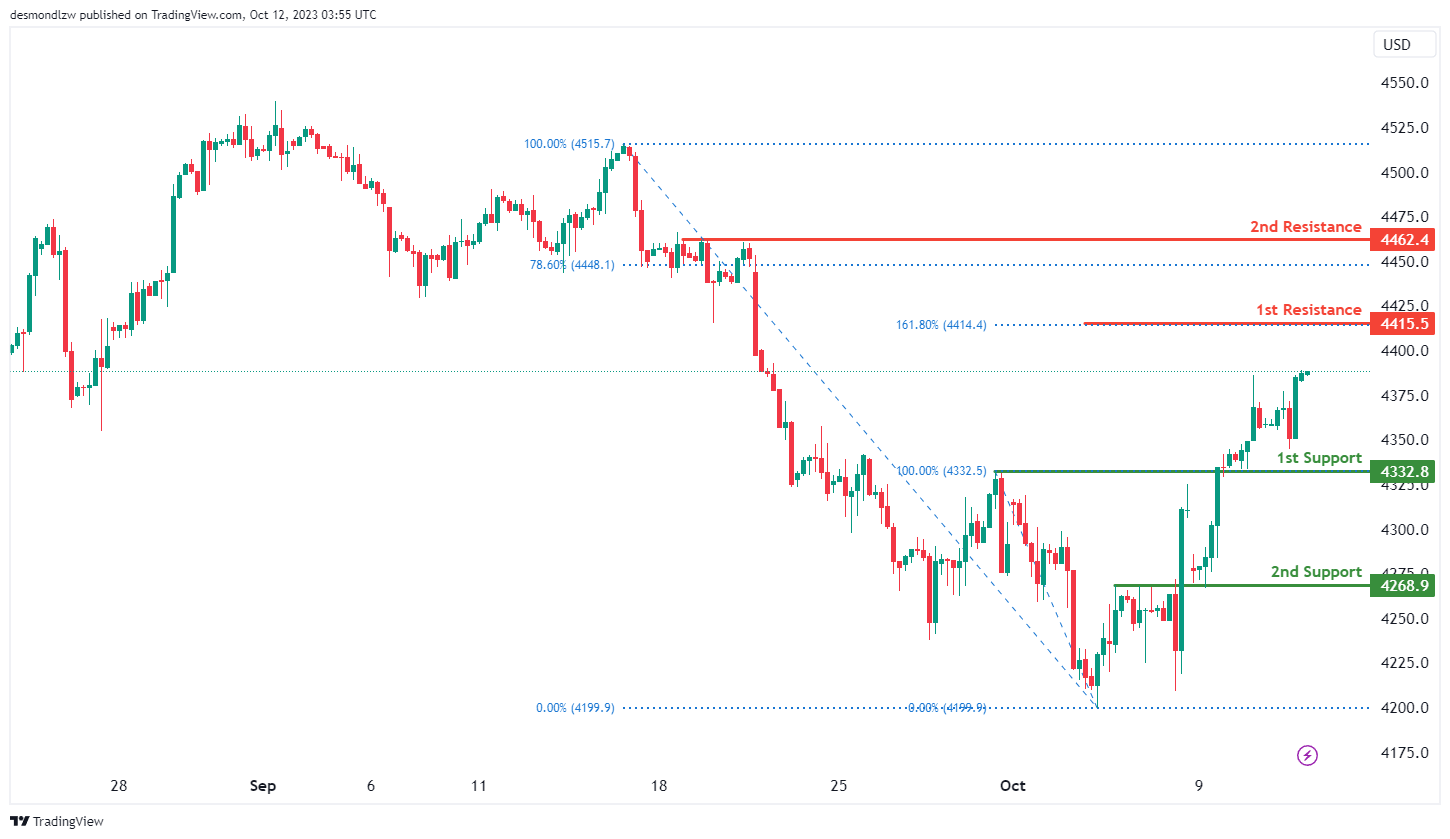
US500
The S&P 500 (US500) chart is currently showing an overall bullish momentum with a potential for price to make a bullish continuation towards the 1st resistance level.
The 1st resistance level at 4,415.50 is identified as a resistance that aligns with the 161.80% Fibonacci extension level. Higher up, the 2nd resistance level at 4,462.40 is noted as a pullback resistance that aligns close to the 78.60% Fibonacci retracement level.
To the downside, the 1st support level at 4,332.80 is identified as an overlap support. Additionally, the 2nd support level at 4,268.90 is also marked as an overlap support.
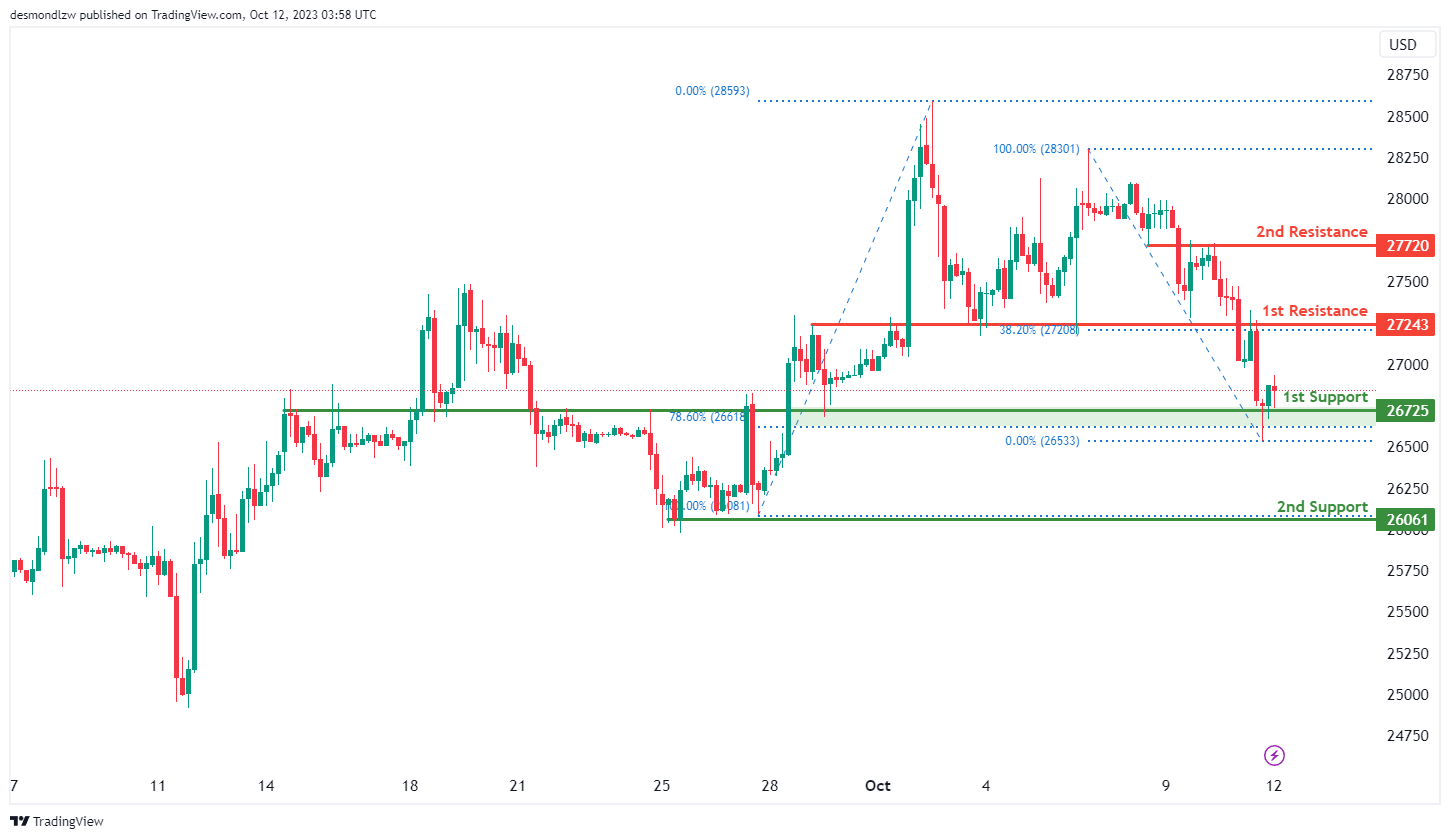
BTC/USD:
The Bitcoin (BTC/USD) chart currently exhibits an overall bearish momentum with a potential scenario for price to make a bearish continuation towards the 1st support level.
The 1st support level at 26,725.00 is identified as an overlap support that aligns with the 78.60% Fibonacci retracement level. Further below, the 2nd support level at 26,061.00 is noted as a pullback support.
To the upside, the 1st resistance level at 27,243.00 is identified as an overlap resistance that aligns with the 38.20% Fibonacci retracement level. Higher up, the 2nd resistance level at 27,720.00 is also marked as an overlap resistance.
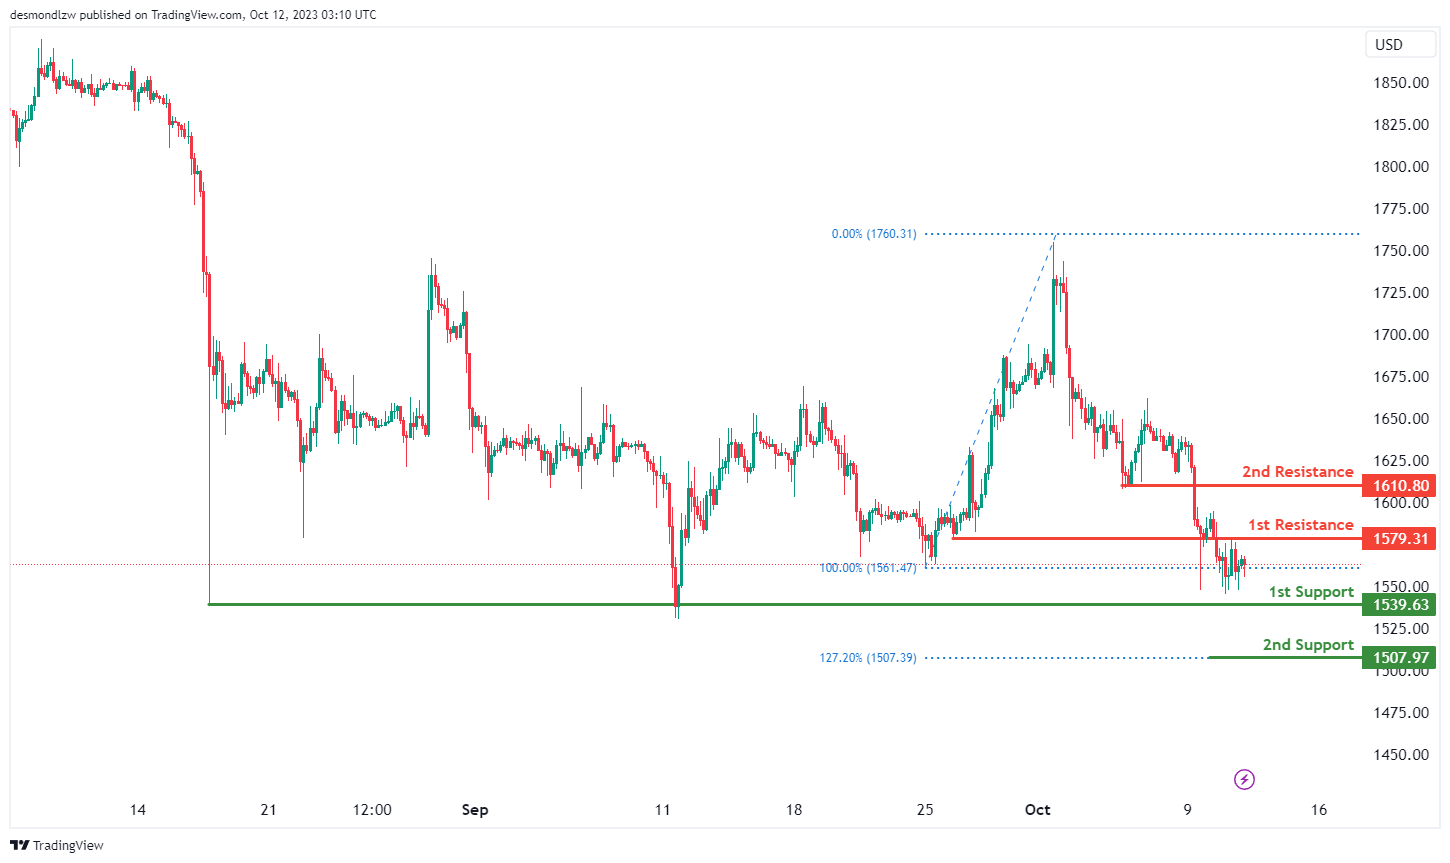
ETH/USD:
The Ethereum (ETH/USD) chart currently exhibits a neutral momentum with a potential scenario for price to fluctuate between the 1st resistance and the 1st support levels.
The 1st support level at 1,539.63 is identified as a pullback support. Further below, the 2nd support level at 1,507.97 is noted as a support level that aligns with the 127.20% Fibonacci extension level.
To the upside, the 1st resistance level at 1,579.31 is identified as an overlap resistance. Higher up, the 2nd resistance level at 1,610.80 is marked as a pullback resistance.
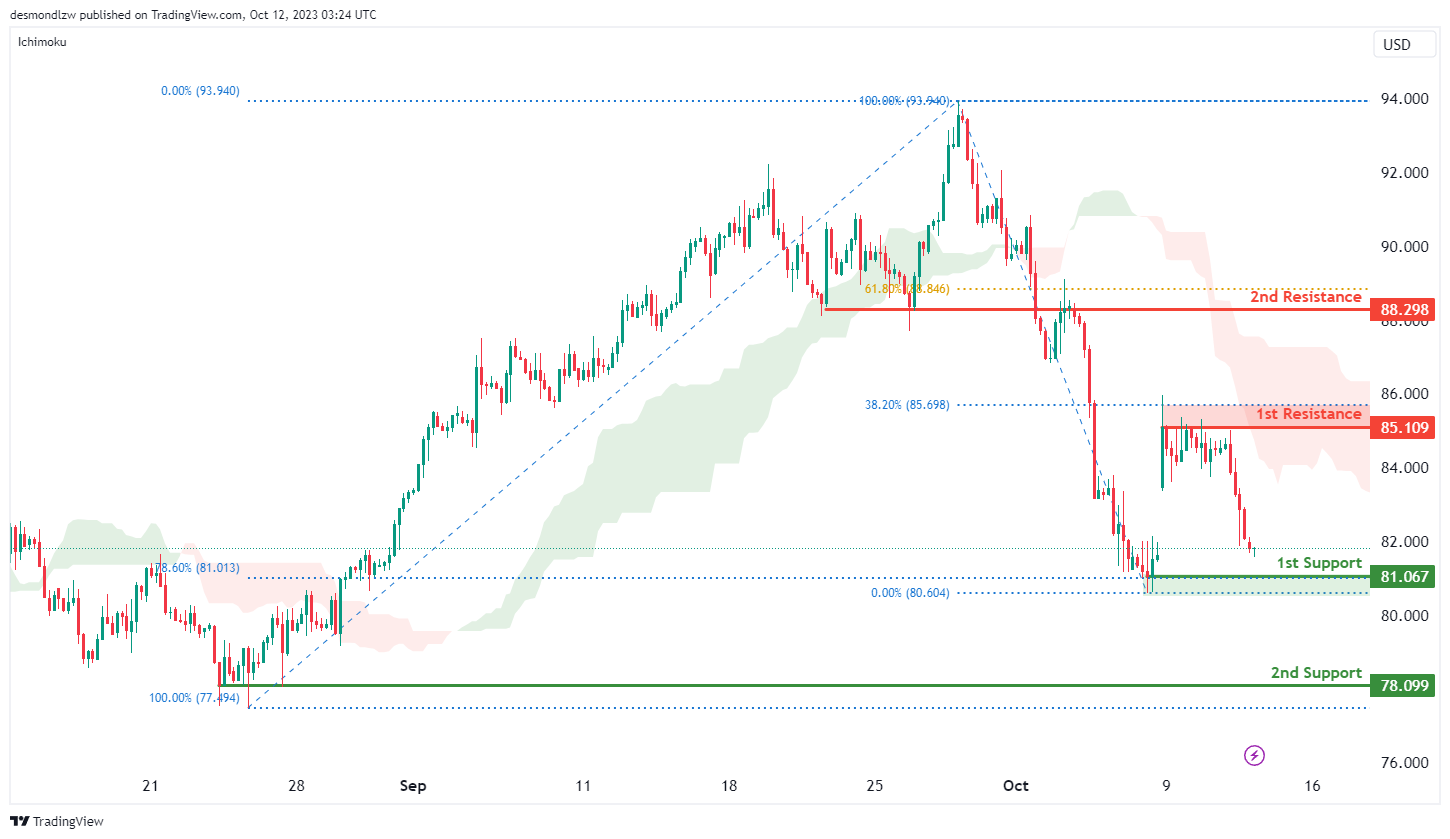
WTI/USD:
The WTI chart currently exhibits an overall bearish momentum with price trading under the bearish Ichimoku cloud. There is a potential scenario for price to make a bearish continuation towards the 1st support level.
The 1st support level at 81.07 is identified as a pullback support that aligns with the 78.60% Fibonacci retracement level. Additionally, the 2nd support level at 78.09 is also noted as pullback support, further reinforcing its significance as an area where price may find support.
The 1st resistance level at 85.11 is identified as a pullback resistance that aligns close to the 38.20% Fibonacci retracement level. Higher up, the 2nd resistance level at 88.29 is noted as an overlap resistance that aligns close to the 61.80% Fibonacci retracement level, potentially acting as a barrier to further upward movement.
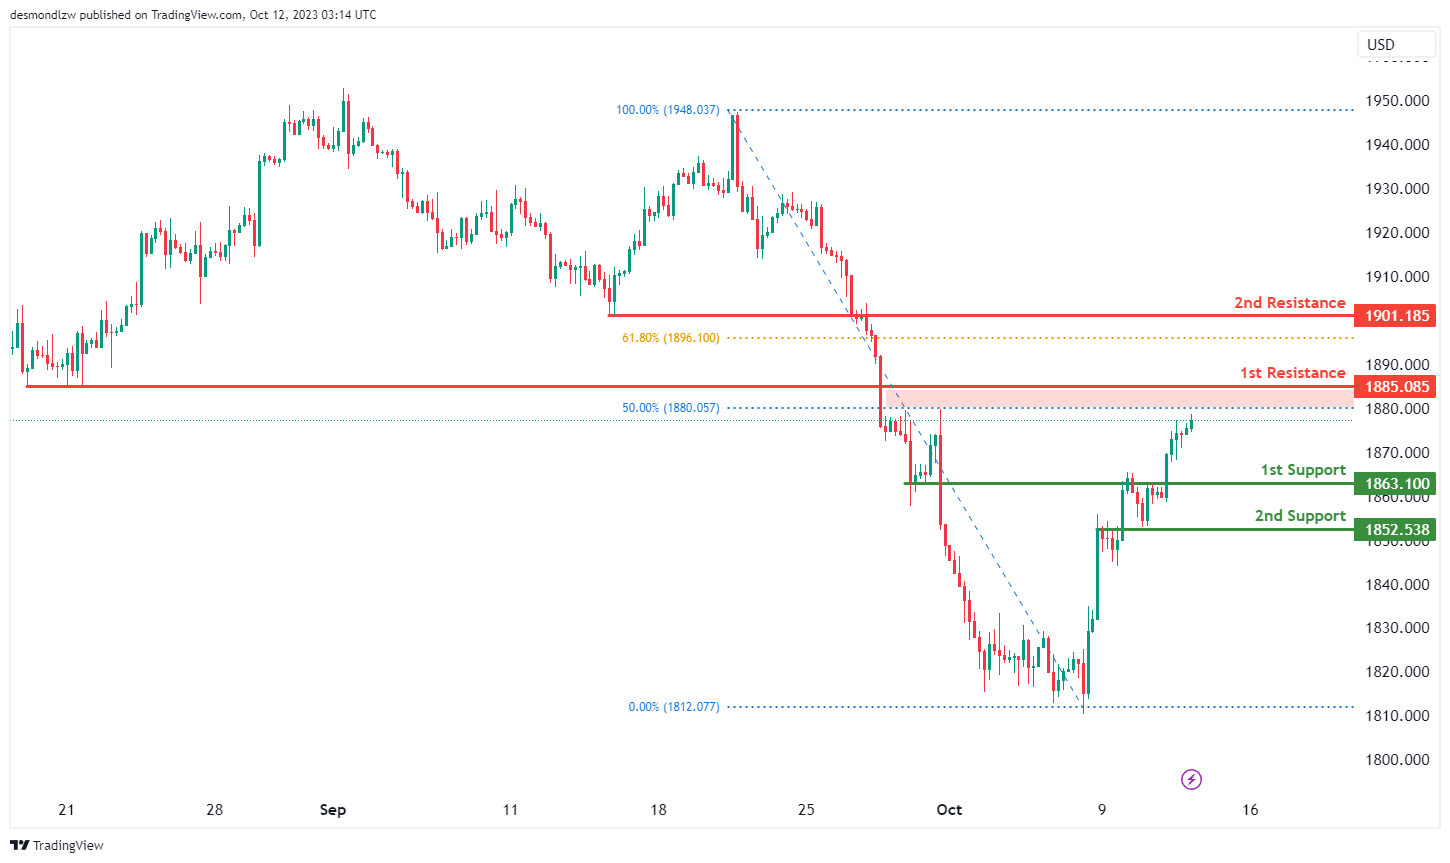
XAU/USD (GOLD):
The XAU/USD chart currently exhibits a bearish momentum, indicating a potential scenario of a bearish reaction off the 1st resistance level, followed by a drop towards the 1st support.
The 1st support at 1863.10 is considered significant as it’s identified as a pullback support, potentially acting as a strong level where buying interest could emerge. Additionally, the 2nd support at 1852.53 is characterized as an overlap support, reinforcing its importance as a potential level for price rebounds.
On the resistance side, the 1st resistance level at 1885.08 is identified as a pullback resistance, and it coincides with the 50% Fibonacci Retracement level, making it a robust level of resistance where selling pressure may intensify. Beyond this, the 2nd resistance at 1901.18 is characterized as an overlap resistance, further adding to its significance as a potential area where selling pressure may emerge.


