
DXY:
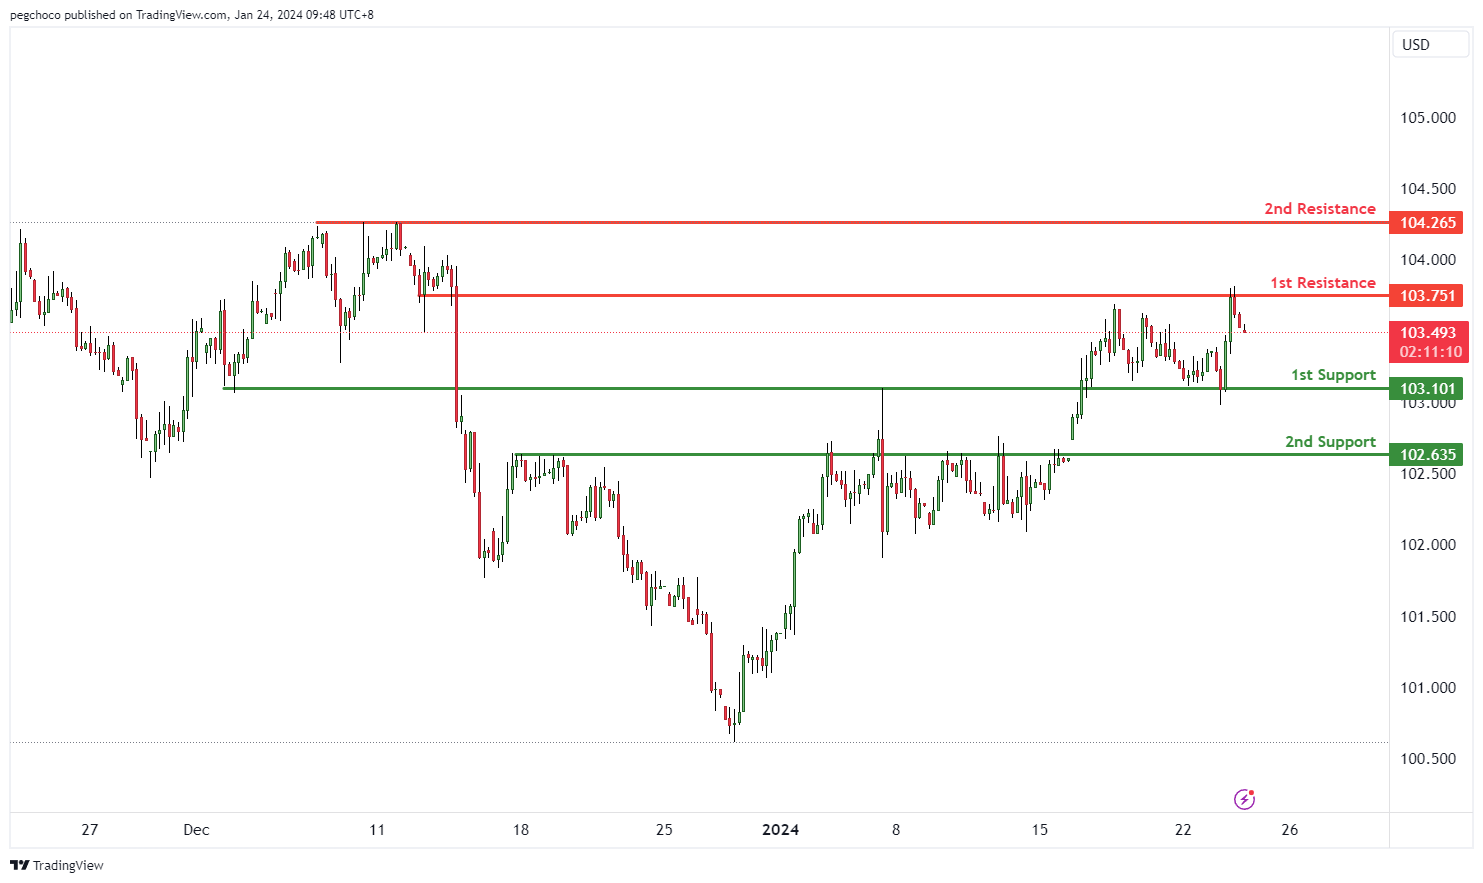
The DXY (US Dollar Currency Index) chart is currently displaying a bearish overall momentum, indicating weakness in the US Dollar. There is a potential for a bearish continuation in the price towards the 1st support level.
The 1st support level at 103.10 is considered significant as it represents an overlap support, indicating that this price level has previously acted as both support and resistance. This suggests that it may be a strong area where price could potentially find support during a bearish move.
The 2nd support level at 102.63 is identified as a pullback support, implying that it might serve as a notable support zone during price pullbacks.
On the resistance side, the 1st resistance level at 103.75 is recognized as an overlap resistance, signifying that this price level has historically served as both support and resistance. This historical significance makes it a potential barrier where selling pressure could emerge.
The 2nd resistance level at 104.26 is categorized as a multi-swing high resistance, indicating that it represents a historical point where the price has encountered resistance and potential selling interest.
EUR/USD:
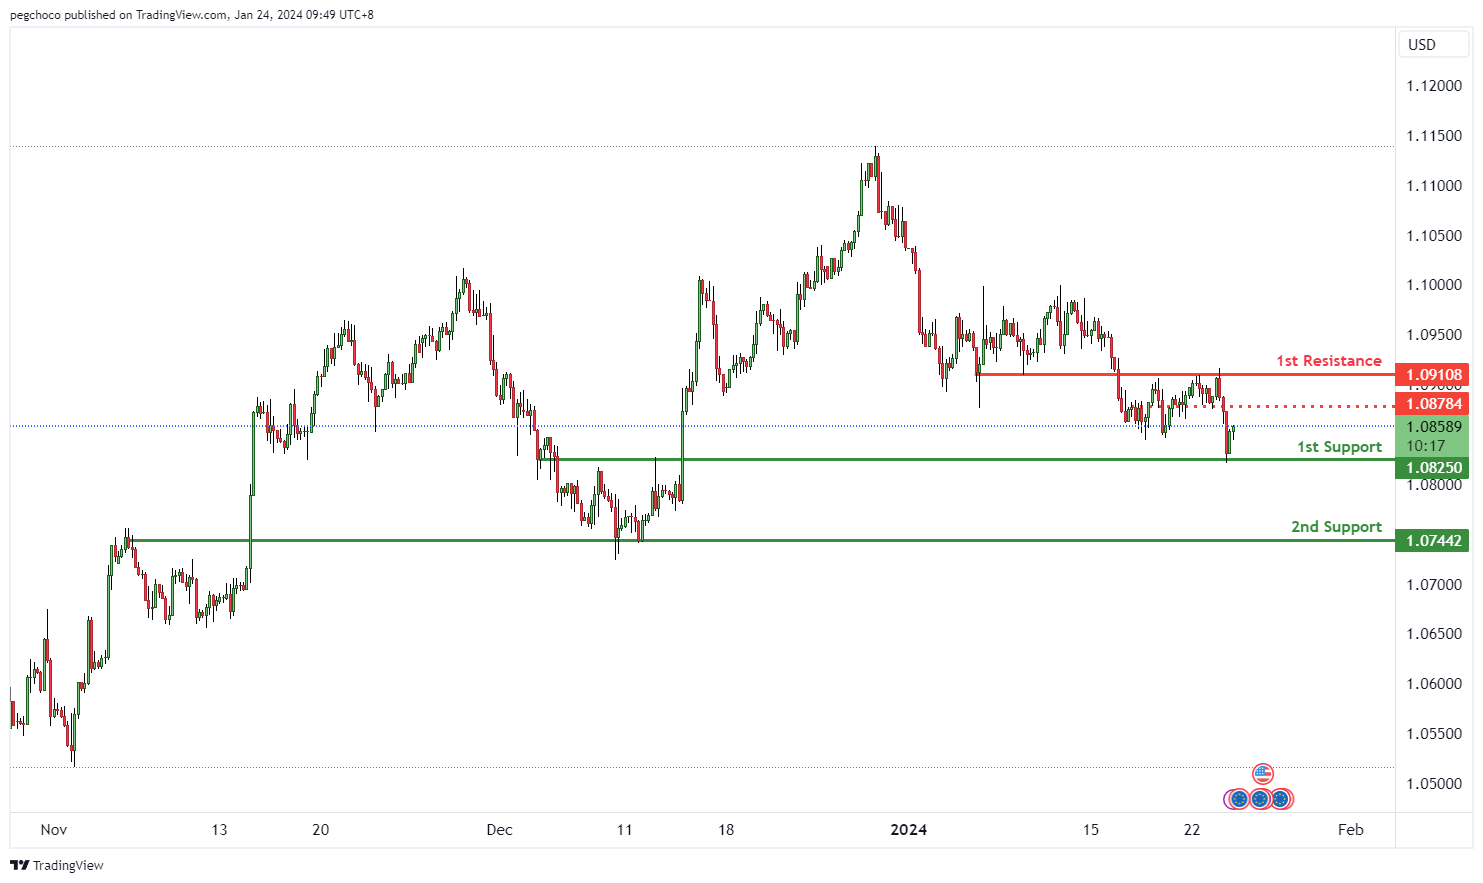
The EUR/USD trading pair is currently exhibiting a bullish overall momentum, indicating strength in the Euro relative to the US Dollar. Your analysis suggests that there is potential for a bullish continuation in the price towards the 1st resistance level.
The 1st support level at 1.0825 is considered significant as it represents an overlap support, indicating that this price level has previously acted as both support and resistance. This suggests that it may be a strong area where price could potentially find support during a bullish move.
The 2nd support level at 1.0744 is also identified as an overlap support, further emphasizing its historical significance as a level where price has previously found support.
On the resistance side, the 1st resistance level at 1.0910 is recognized as an overlap resistance, signifying that this price level has historically served as both support and resistance. This makes it a potential barrier where selling pressure may emerge.
Additionally, there is an intermediate resistance level at 1.0878, characterized as pullback resistance. This suggests that it might act as a notable resistance point during price pullbacks.
EUR/JPY:
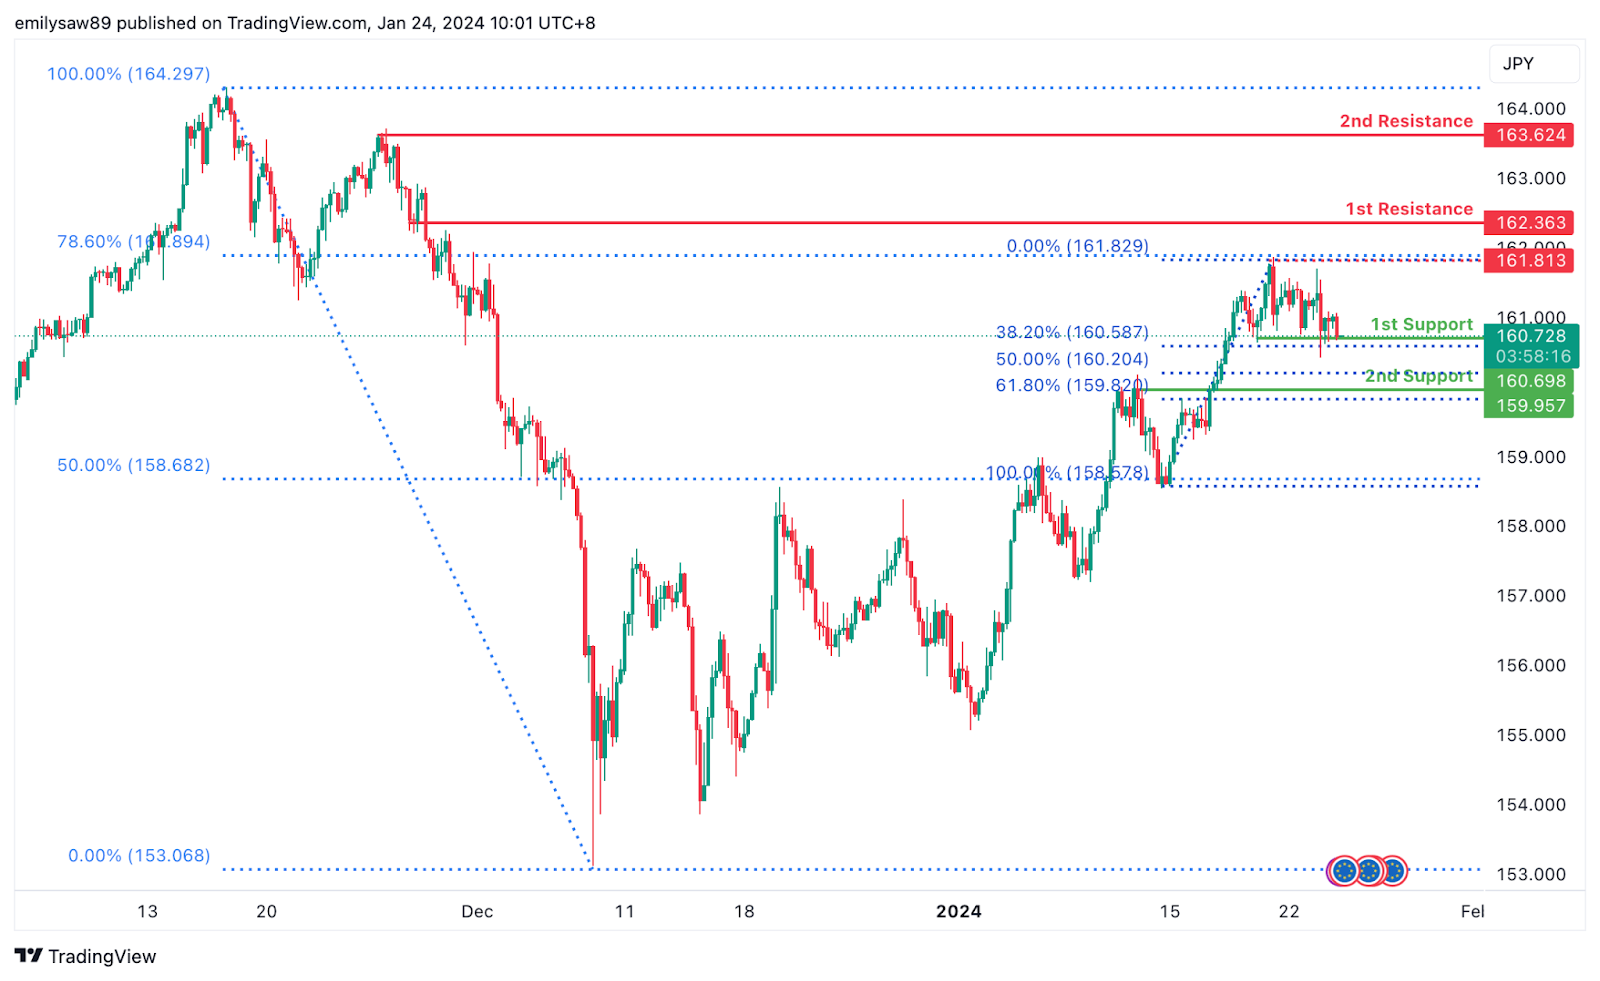
The EUR/JPY chart currently exhibits a bearish overall momentum, indicating a downward trend in prices. Traders should consider potential levels for a bearish continuation.
The 1st support at 160.70 is identified as a pullback support and coincides with the 38.20% Fibonacci Retracement. This level is historically significant, representing a zone where buying interest has previously emerged. Additionally, the 2nd support at 159.96 is recognized as an overlap support and aligns with the 61.80% Fibonacci Retracement, providing added confluence to the support zone.
On the resistance side, the 1st resistance at 162.36 represents a level where selling interest may intensify, acting as a pullback resistance. The 2nd resistance at 163.62 is noteworthy for being a swing high resistance, indicating a potential barrier to upward movement.
An intermediate resistance level at 161.81 is also highlighted as a point where the price may encounter selling pressure, aligning with both swing high resistance and the 78.60% Fibonacci Retracement.
EUR/GBP:
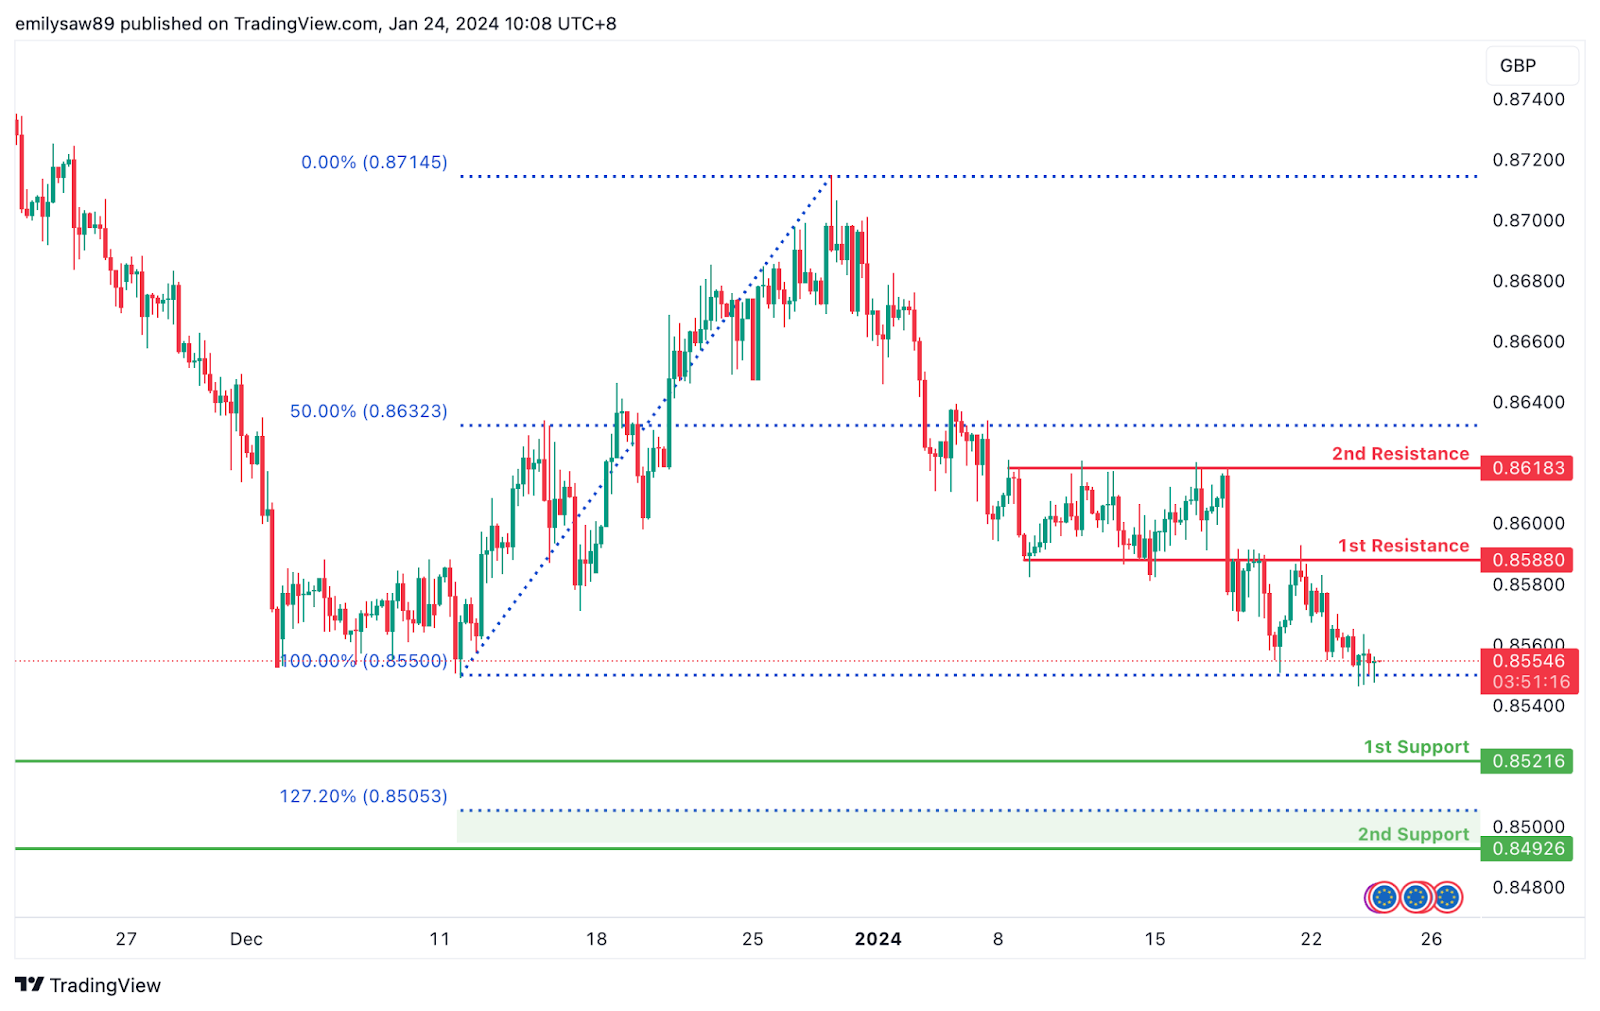
The EUR/GBP chart currently indicates a bearish overall momentum, signaling a downward trend in prices. Traders should consider potential levels for a bearish continuation.
The 1st support at 0.8522 is identified as a swing low support, suggesting historical significance as a level where buying interest has previously emerged. Additionally, the 2nd support at 0.8493 aligns with both swing low support and the 127.20% Fibonacci Extension, adding confluence to the potential support zone.
On the resistance side, the 1st resistance at 0.8588 is recognized as an overlap resistance, indicating a level where selling interest may intensify. The 2nd resistance at 0.8618 represents a multi-swing high resistance, suggesting a potential barrier to upward movement.
GBP/USD:
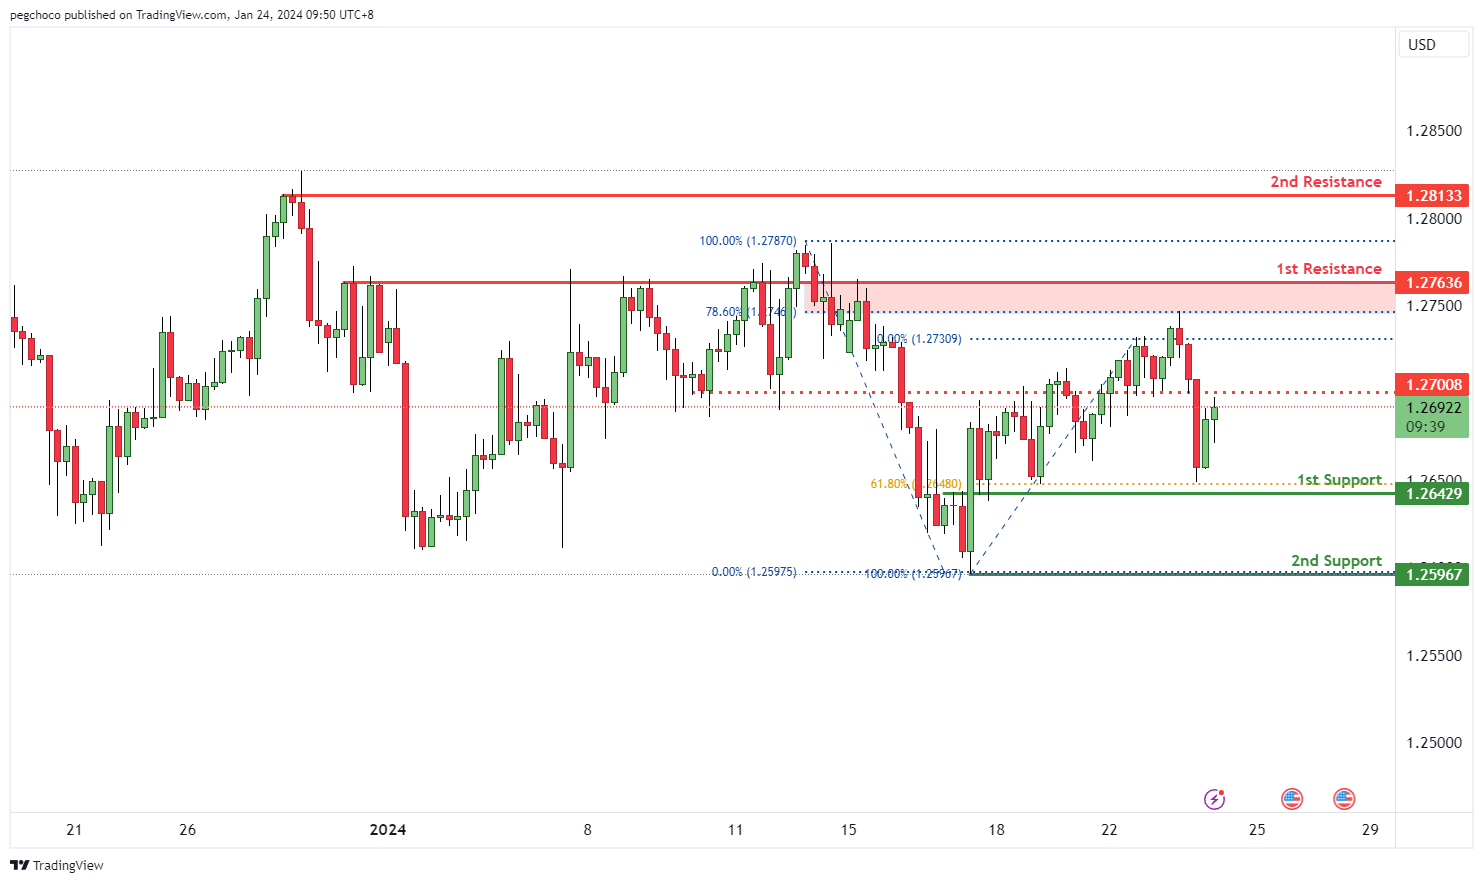
The GBP/USD trading pair is currently experiencing a bullish overall momentum, indicating strength in the British Pound relative to the US Dollar. According to your analysis, there is potential for a bullish continuation in the price towards the 1st resistance level.
The 1st support level at 1.2642 is considered significant due to it being an overlap support, suggesting that this price level has historically acted as both support and resistance. Additionally, it aligns with the 61.80% Fibonacci Retracement level, adding further significance to this support zone.
The 2nd support level at 1.2596 is identified as a swing low support, indicating that this level corresponds to a previous significant low point on the chart and reinforcing its importance as a support level.
On the resistance side, the 1st resistance level at 1.2763 is recognized as a multi-swing high resistance. It also coincides with the 78.60% Fibonacci Retracement level, making it a potential strong resistance point where selling pressure may emerge.
The 2nd resistance level at 1.2813 is characterized as a swing high resistance, indicating its historical significance as a point where the price has encountered resistance.
Additionally, there is an intermediate resistance level at 1.2700, identified as pullback resistance. This level suggests that it might act as a notable resistance point during price pullbacks.
GBP/JPY:
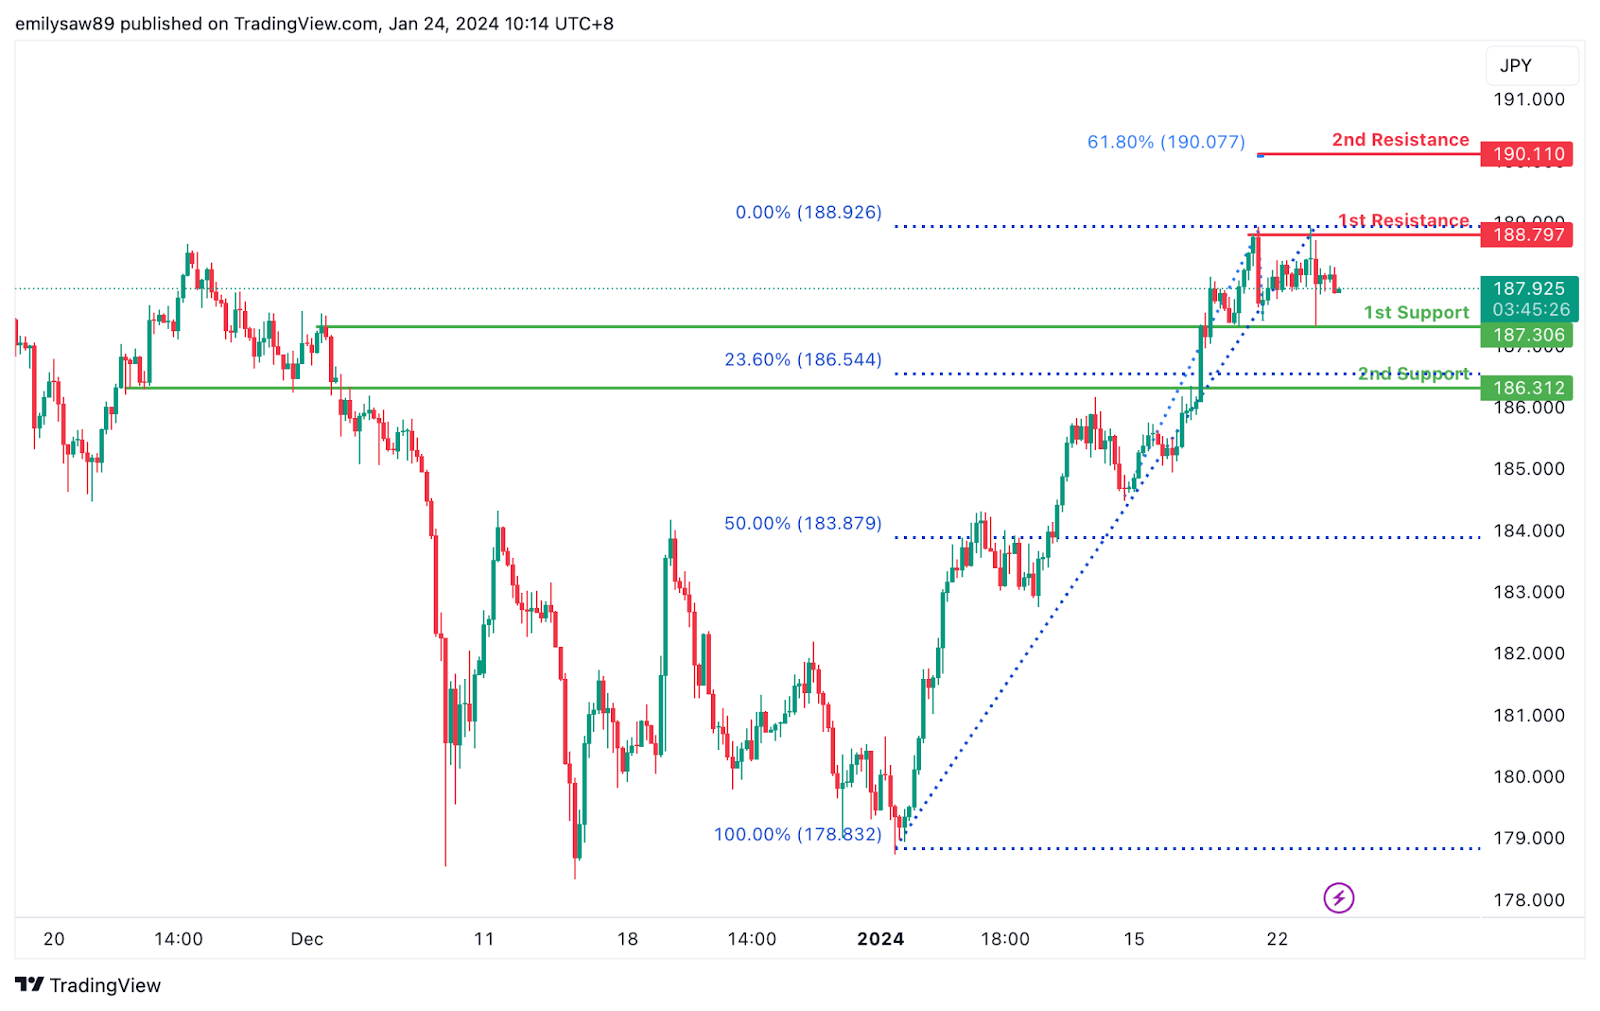
The GBP/JPY chart currently demonstrates a neutral overall momentum, indicating a lack of a clear trend direction. Traders should be aware of potential fluctuations between the 1st resistance and 1st support levels.
The 1st support at 187.31 is identified as an overlap support, suggesting historical significance and a level where buying interest may emerge. Additionally, the 2nd support at 186.31 aligns with both overlap support and the 23.60% Fibonacci Retracement, providing additional strength to the support zone.
On the resistance side, the 1st resistance at 188.80 is recognized as a swing high resistance, representing a level where selling interest may intensify. The 2nd resistance at 190.11 corresponds to the 61.80% Fibonacci Projection, adding significance to this potential resistance level.
USD/CHF:
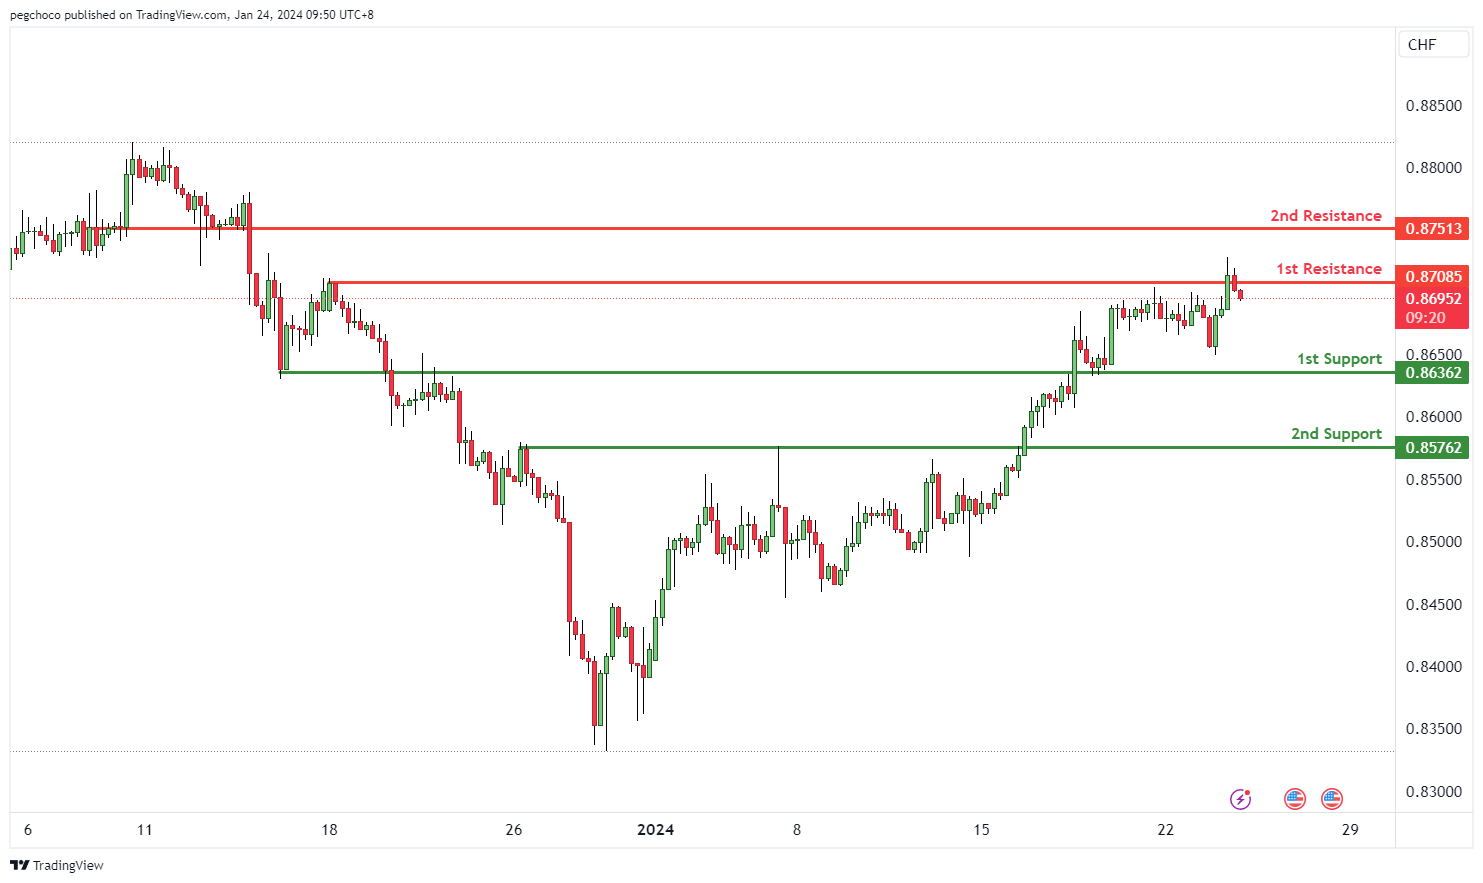
The USD/CHF trading pair is currently showing a bearish overall momentum, indicating weakness in the US Dollar relative to the Swiss Franc. According to your analysis, there is potential for a bearish reaction off the 1st resistance level followed by a drop towards the 1st support level.
The 1st support level at 0.8636 is considered significant due to its categorization as an overlap support, suggesting that this price level has previously acted as both support and resistance. This historical significance makes it a potential area where price could find support during a bearish move.
The 2nd support level at 0.8576 is identified as a pullback support, implying that it might serve as a notable support zone during price pullbacks.
On the resistance side, the 1st resistance level at 0.8708 is recognized as a swing high resistance, indicating that it has historically served as a point of resistance where selling pressure may emerge.
The 2nd resistance level at 0.8751 is characterized as a pullback resistance, suggesting that it might act as a strong resistance point during price pullbacks.
USD/JPY:
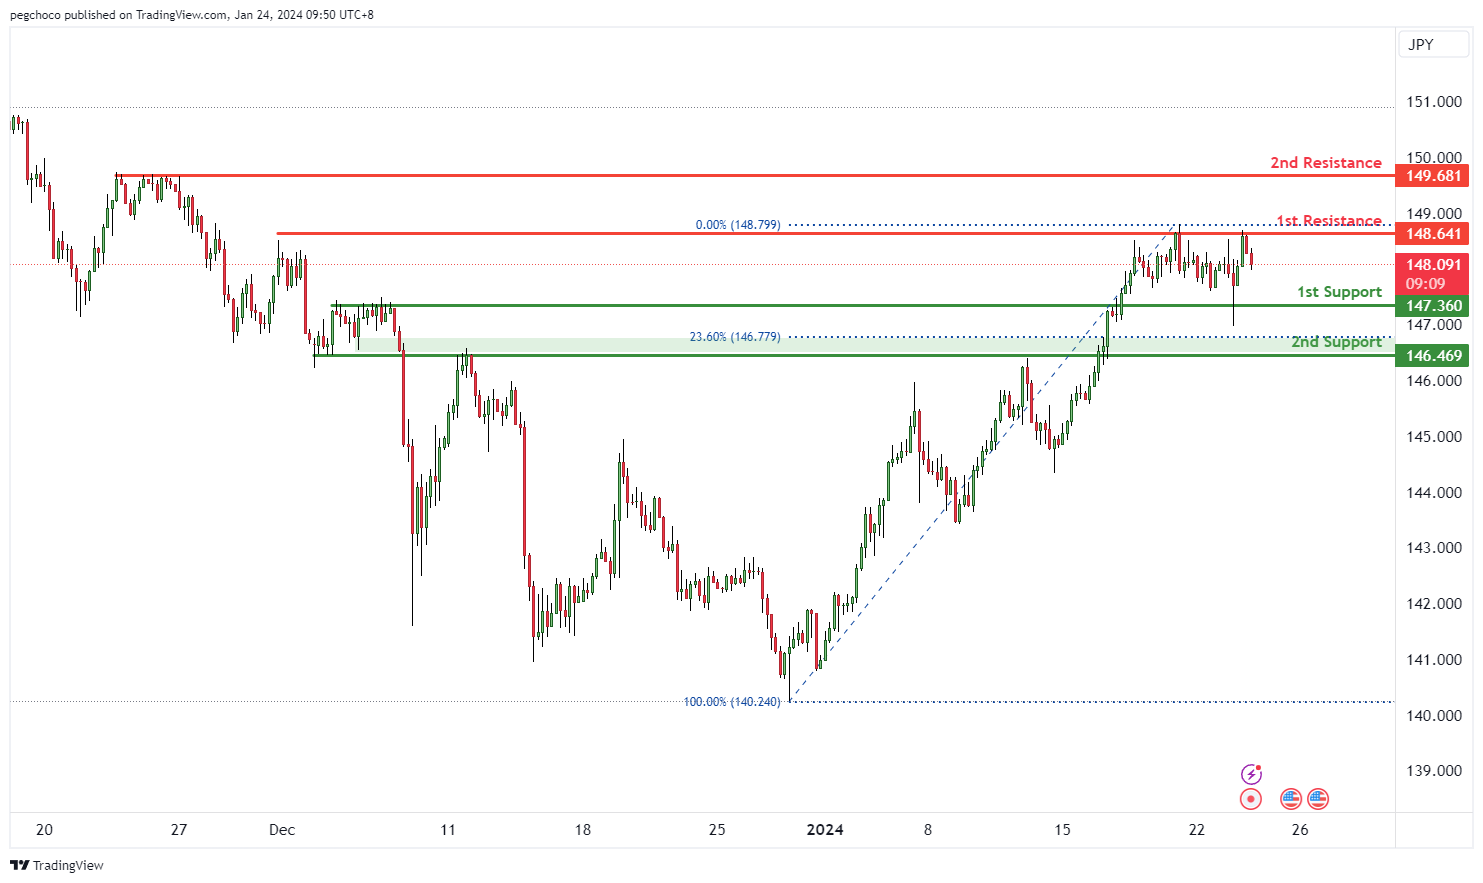
The USD/JPY trading pair is currently experiencing a bearish overall momentum, indicating weakness in the US Dollar relative to the Japanese Yen. Your analysis suggests that there is potential for a bearish break off the 1st support level, followed by a drop towards the 2nd support level.
The 1st support level at 147.36 is considered significant due to its classification as an overlap support, indicating that this price level has historically acted as both support and resistance. This suggests that it may be a strong area where price could potentially find support during a bearish move.
The 2nd support level at 146.46 is also identified as an overlap support, further reinforcing its importance as a level where price has previously found both support and resistance.
On the resistance side, the 1st resistance level at 148.64 is recognized as a multi-swing high resistance. This implies that it represents a historical point where the price has encountered resistance and potential selling interest.
The 2nd resistance level at 149.68 is categorized as a multi-swing high resistance, indicating its significance as a point where the price has historically faced resistance.
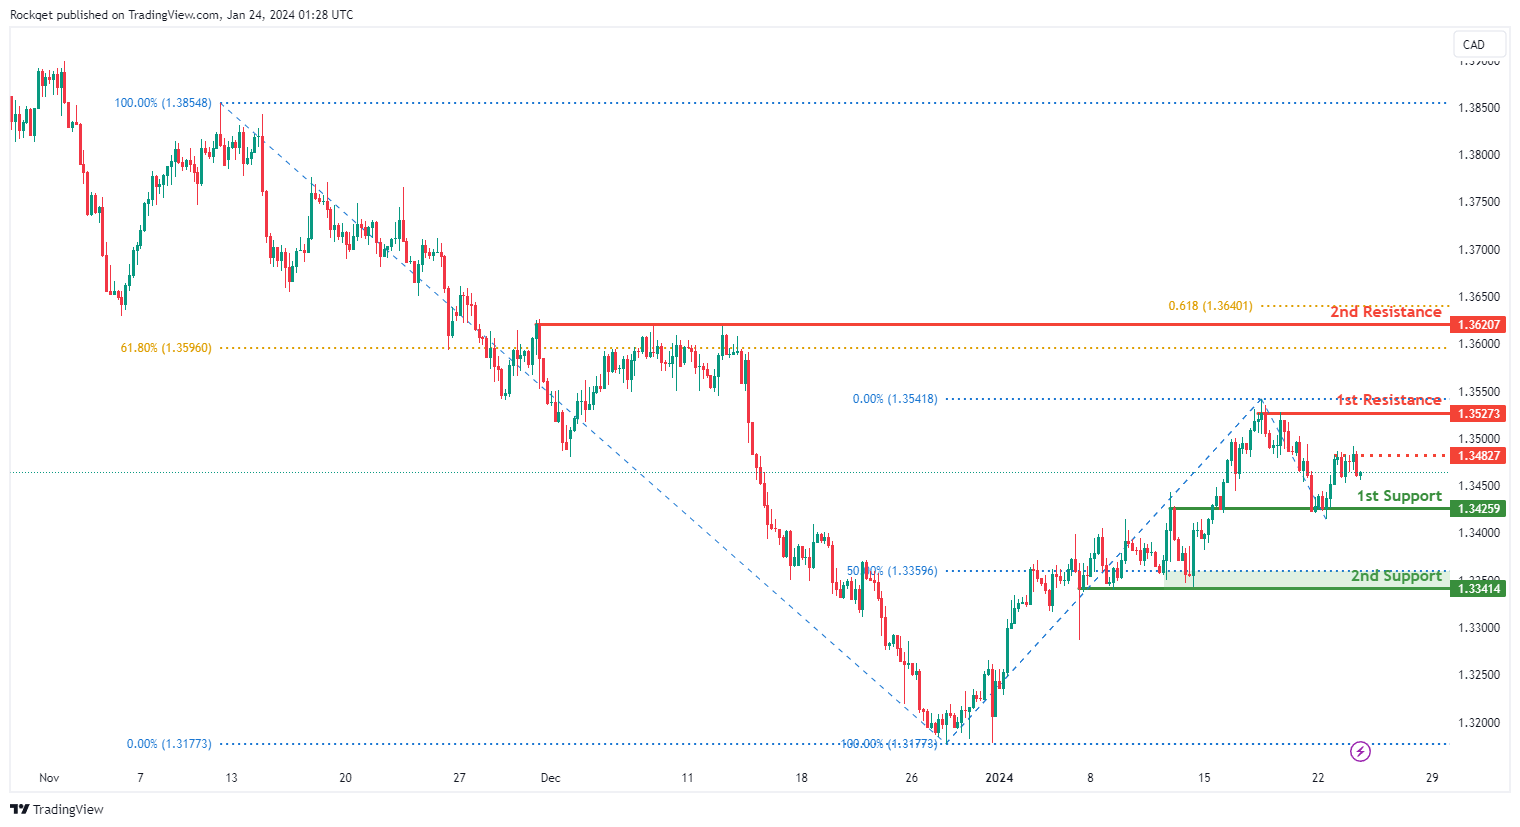
USD/CAD:
The USD/CAD chart currently exhibits an overall bullish momentum. In this context, there is a potential scenario for price to rise towards the 1st resistance.
The 1st resistance level at 1.3527 is identified as a pullback resistance. Higher up, the 2nd resistance level at 1.3620 is also noted as a pullback resistance that aligns close to a confluence of Fibonacci levels i.e. the 61.80% retracement and the 61.80% projection, further reinforcing its significance as a potential resistance zone.
To the downside, the 1st support level at 1.3425 is identified as an overlap support. Further below, the 2nd support level at 1.3341 is marked as a pullback support that aligns close to the 50.00% Fibonacci retracement level, further reinforcing its importance as a key support level.
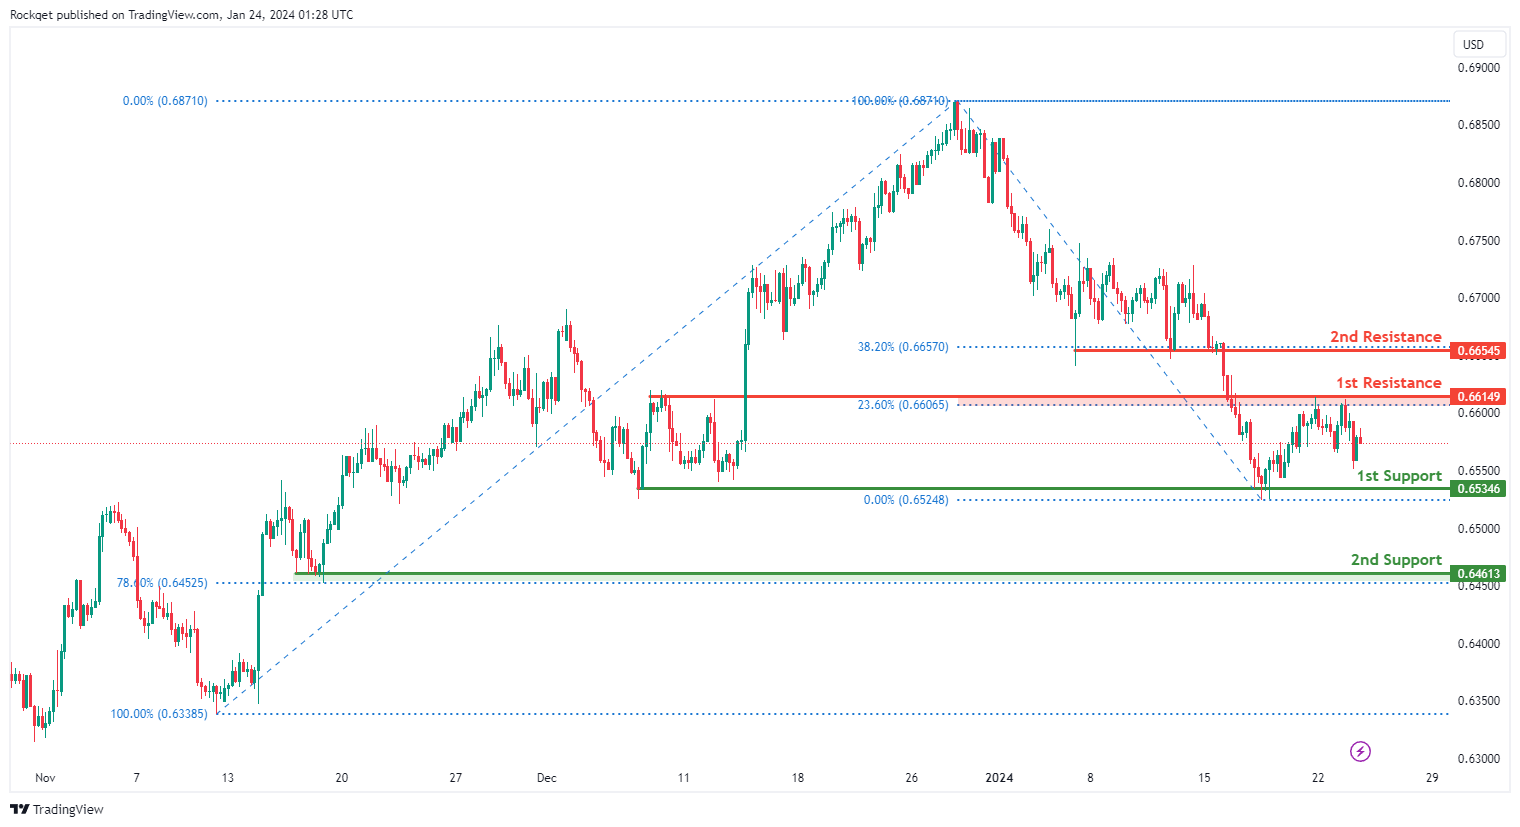
AUD/USD:
The AUD/USD chart currently exhibits an overall bearish momentum. In this context, there is a potential scenario for price to drop towards the 1st support.
The 1st support level at 0.6534 is identified as a pullback support. Further below, the 2nd support level at 0.6461 is also marked as a pullback support that aligns with the 78.60% Fibonacci retracement level, further reinforcing its importance as a key support level.
To the upside, the 1st resistance level at 0.6614 is identified as a pullback resistance that aligns with the 23.60% Fibonacci retracement level. Higher up, the 2nd resistance level at 0.6654 is also noted as a pullback resistance that aligns with the 38.20% Fibonacci retracement level, suggesting a potential barrier for further upside movement.
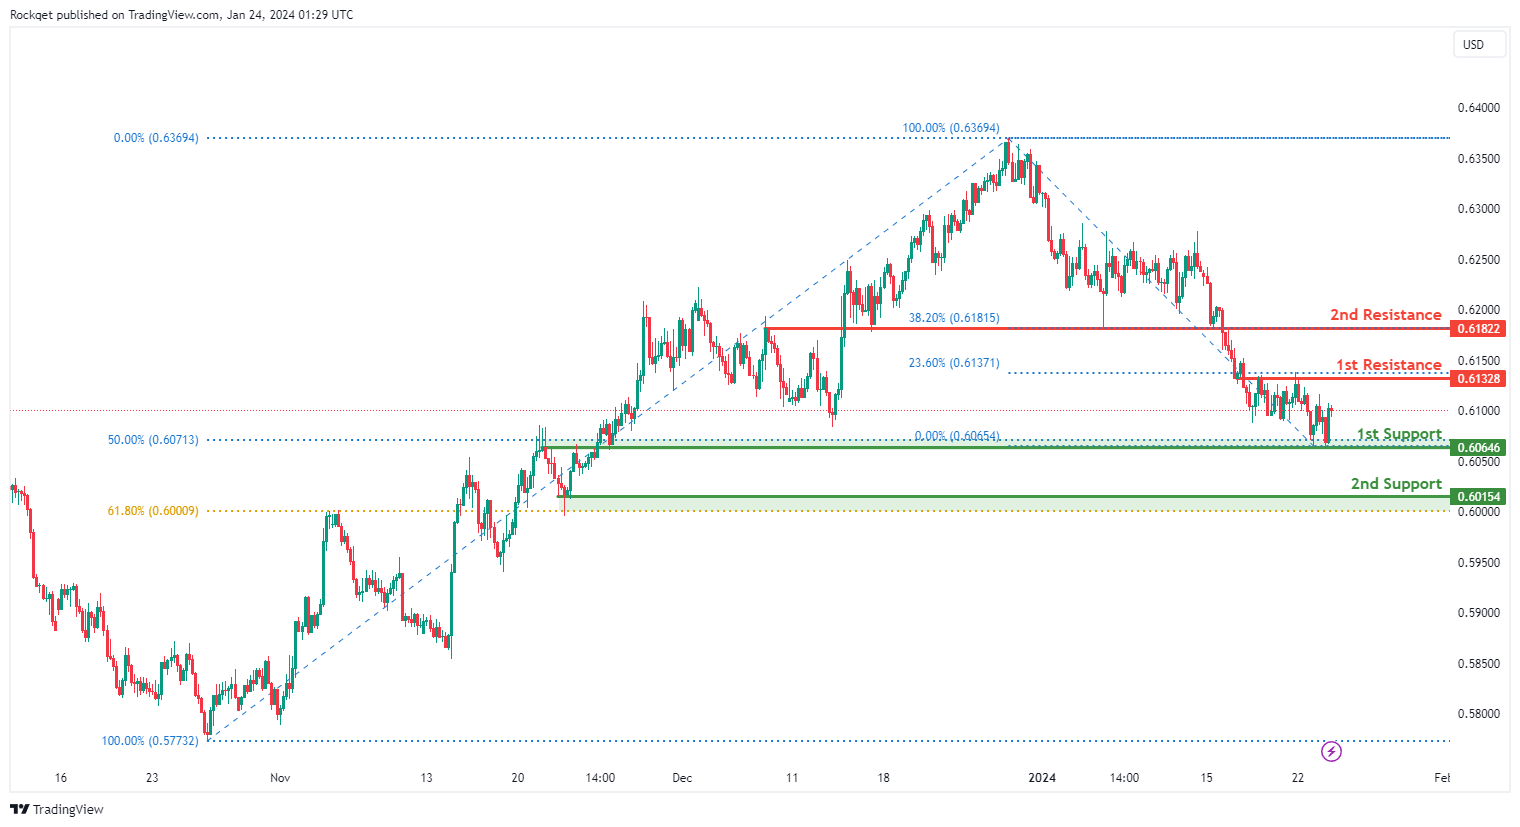
NZD/USD
The NZD/USD chart currently exhibits an overall bearish momentum. In this context, there is a potential scenario for price to drop towards the 1st support.
The 1st support level at 0.6064 is identified as an overlap support that aligns close to the 50.00% Fibonacci retracement level. Further below, the 2nd support level at 0.6015 is marked as a pullback support that aligns close to the 61.80% Fibonacci retracement level, further reinforcing its importance as a key support level.
To the upside, the 1st resistance level at 0.6132 is identified as an overlap resistance that aligns with the 23.60% Fibonacci retracement level. Higher up, the 2nd resistance level at 0.6182 is also noted as an overlap resistance that aligns with the 38.20% Fibonacci retracement level, suggesting a potential barrier for further upside movement.
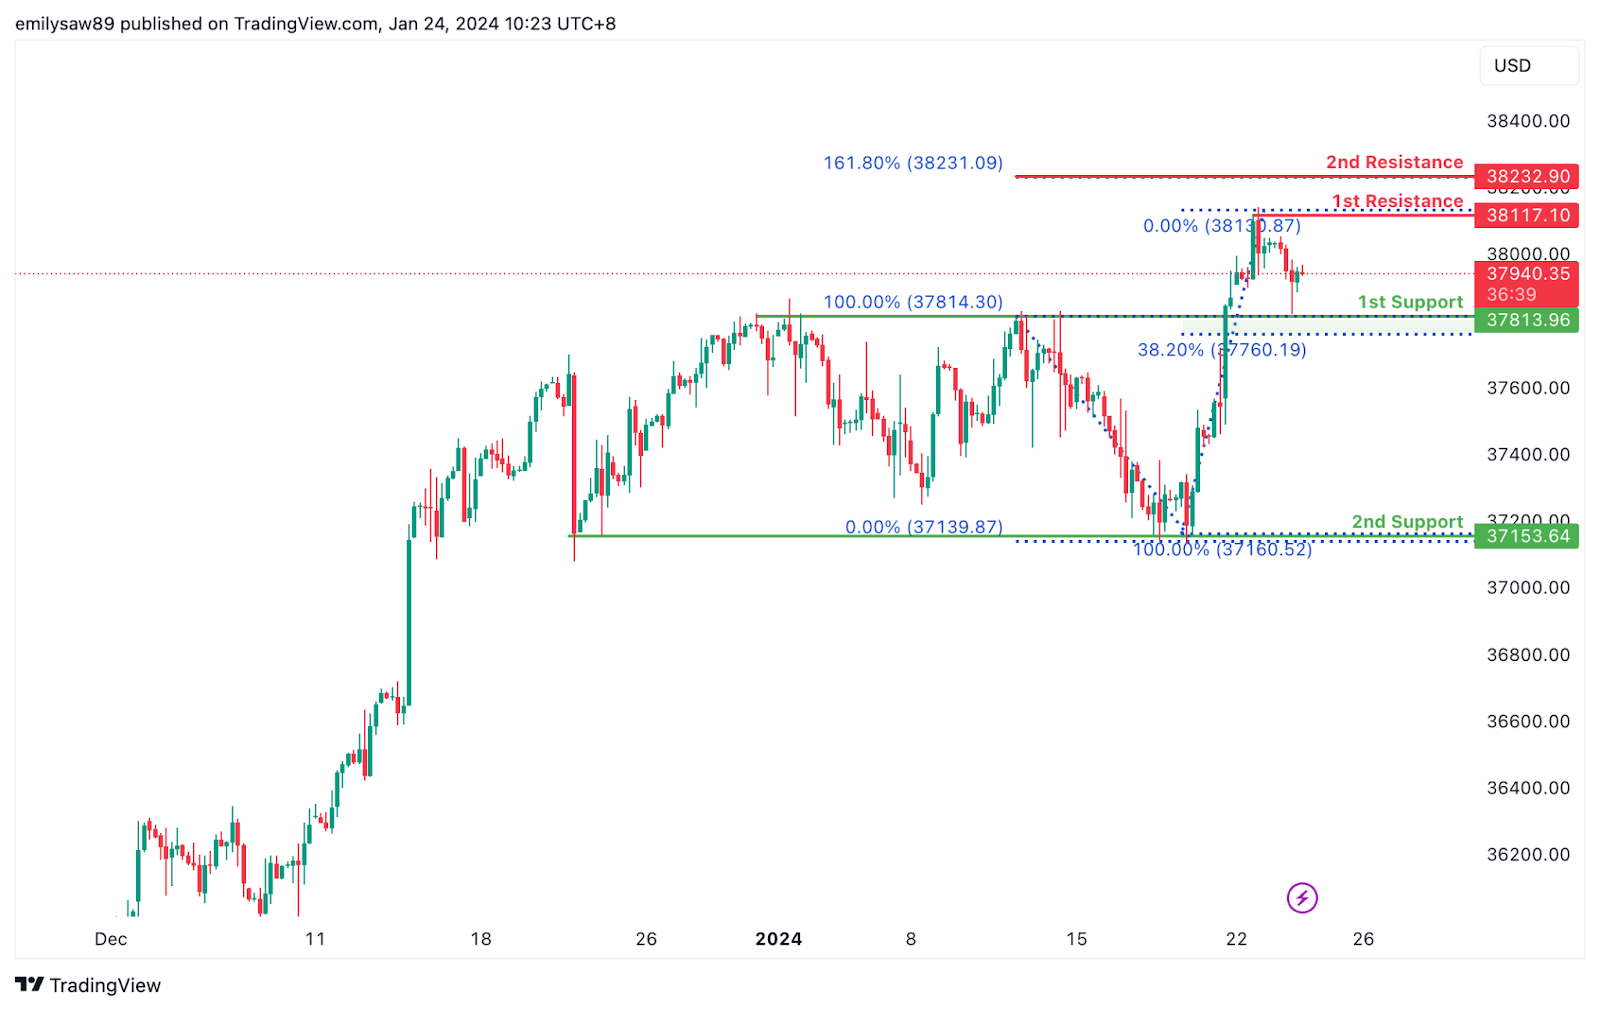
DJ30:
The DJ30 (Dow Jones Industrial Average) chart currently indicates a bearish overall momentum, suggesting a downward trend. Considering this momentum, there is a possibility of a bearish reaction off the 1st resistance, leading to a potential drop to the 1st support.
The 1st support at 37813.96 is considered favorable for several reasons. It is identified as an overlap support, indicating historical significance and a level where buying interest has emerged before. Additionally, this support aligns with the 38.20% Fibonacci Retracement, providing confluence and strengthening the support level. The 2nd support at 37153.64 is recognized as a multi-swing low support, adding further significance to the potential support zone.
On the resistance side, the 1st resistance at 38232.90 is acknowledged as a level where selling interest may intensify. This resistance is strengthened by the presence of the 161.80% Fibonacci Extension, adding significance to the potential resistance level. The intermediate resistance at 38117.10 is identified as a swing high resistance, contributing to the overall resistance zone.
GER40:
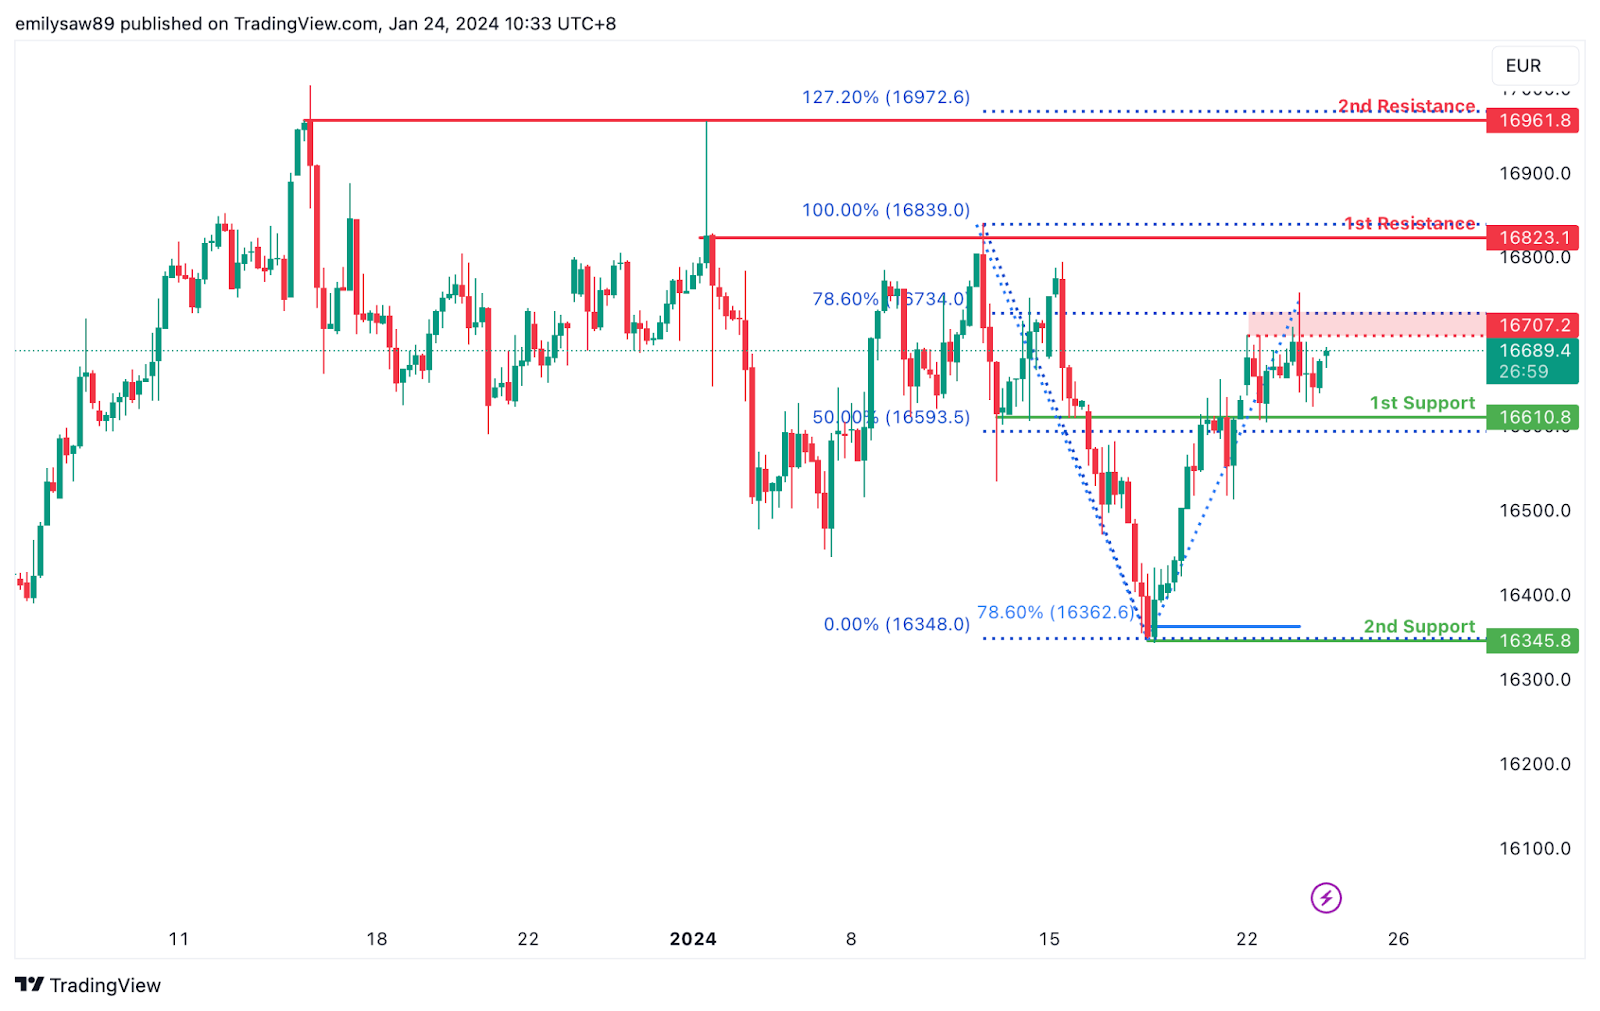
The GER40 chart currently exhibits a weak bullish overall momentum with low confidence, suggesting uncertainty in the trend direction. Several factors contribute to this weak bullish momentum, and as a result, the price could potentially make a bullish continuation towards the 1st resistance.
The intermediate support at 16610.80 is considered favourable as it represents a pullback support, indicating a level where buying interest has emerged during corrective phases. The 1st support at 16345.80 is recognized as a swing low support and coincides with the 78.60% Fibonacci Projection, adding confluence to its potential as a support level.
On the resistance side, the 1st resistance at 16823.10 is identified as a multi-swing high resistance, suggesting a historical level where selling interest has been prominent. The 2nd resistance at 16961.80 is noteworthy for the presence of the 127.20% Fibonacci Extension, adding significance to this potential resistance level. The intermediate resistance at 16707.20 is recognized as a pullback resistance and aligns with the 78.60% Fibonacci Retracement, contributing to the overall resistance zone.
US500:
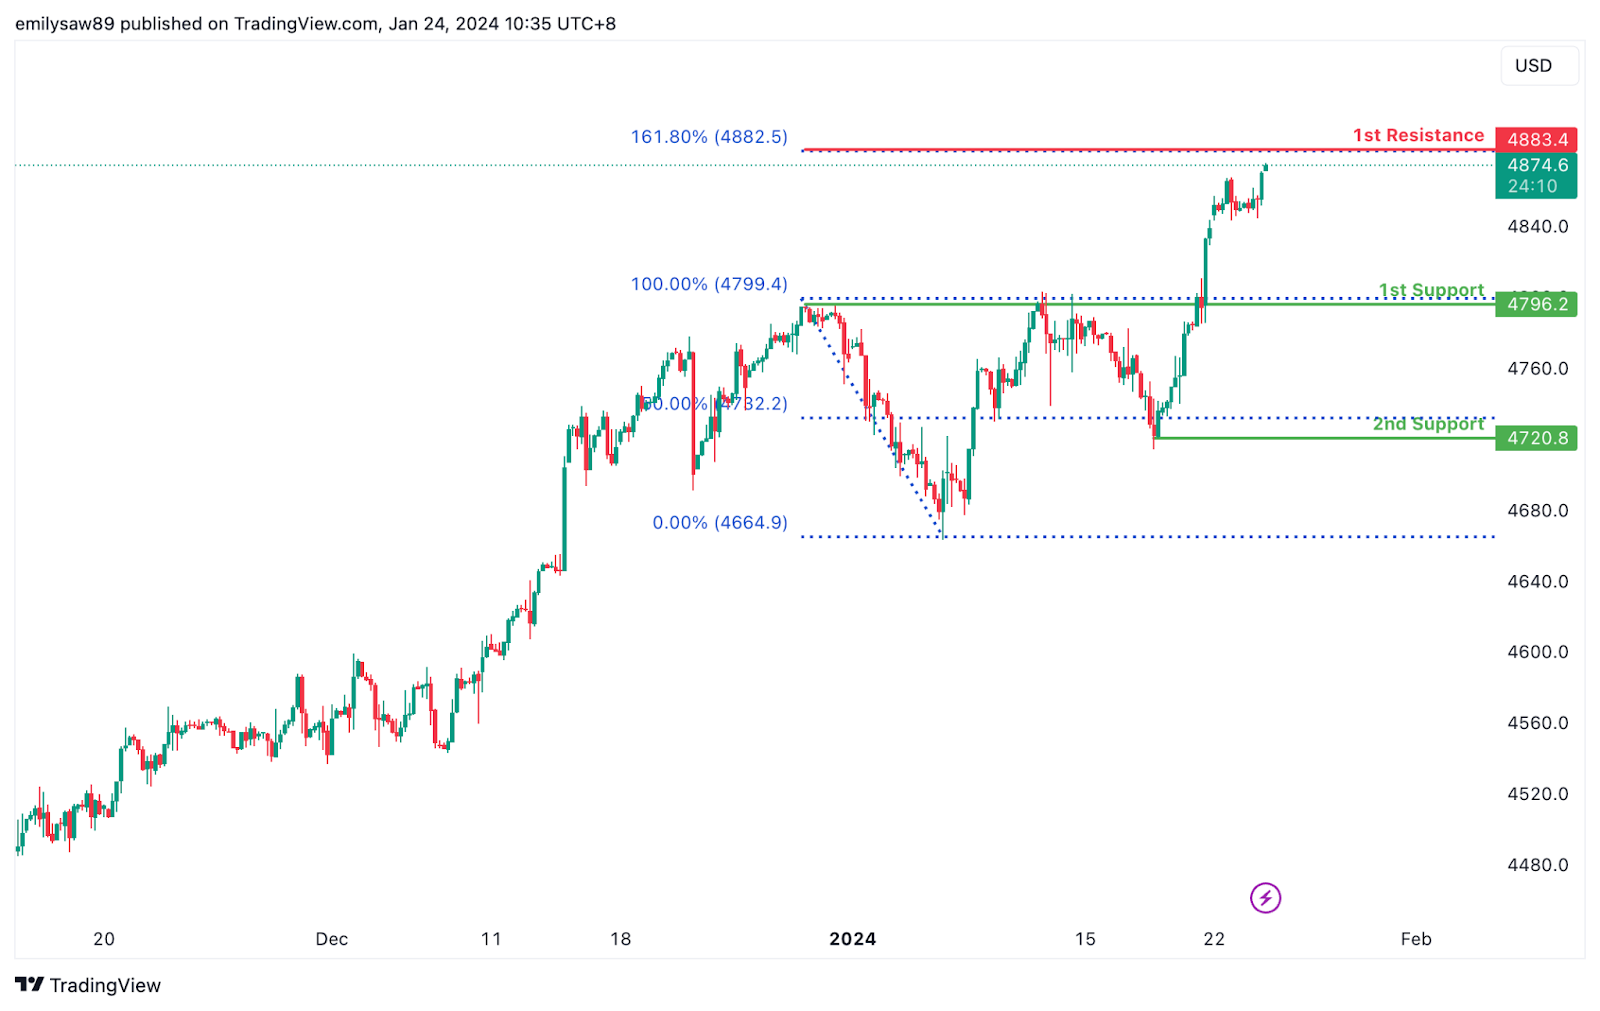
The US500 chart currently exhibits a bullish overall momentum, indicating a positive trend direction. Several factors contribute to this bullish momentum, suggesting potential upward movement in the price.
The 1st support at 4796.2 is considered favorable due to its identification as an overlap support, indicating a level where buying interest has previously emerged. Additionally, the 2nd support at 4720.8 is recognized as a swing low support, providing additional strength to the support zone.
On the resistance side, the 1st resistance at 4883.4 is noteworthy for the presence of the 161.80% Fibonacci Extension, adding significance to this potential resistance level.
BTC/USD:
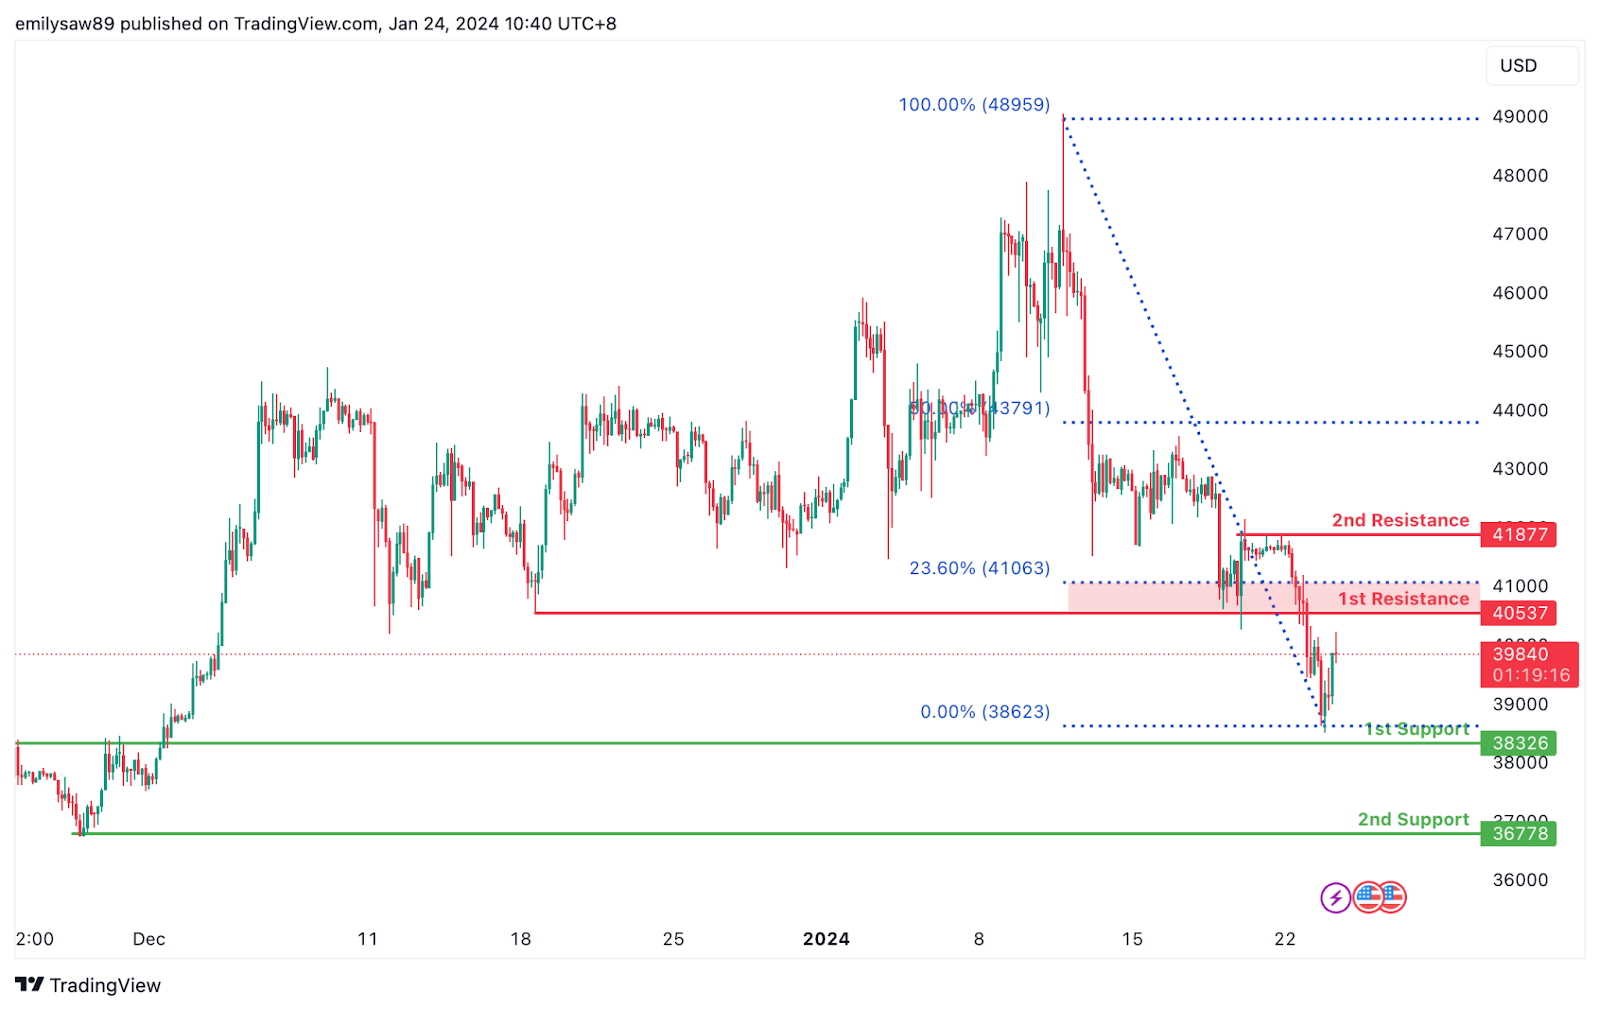
The BTC/USD chart currently exhibits a weak bullish overall momentum with low confidence, indicating a tentative upward trend. Several factors contribute to this weak bullish momentum, suggesting potential upward movement in the price.
The 1st support at 38326 is considered favorable due to its identification as an overlap support, indicating a historical level where buying interest has emerged. Additionally, the 2nd support at 36678 is recognized as a swing low support, providing additional strength to the support zone.
On the resistance side, the 1st resistance at 40537 is noteworthy for the presence of the 23.60% Fibonacci Retracement, adding significance to this potential resistance level. Furthermore, the 2nd resistance at 41877 is acknowledged as a multi-swing high resistance, contributing to the overall resistance zone.
ETH/USD:
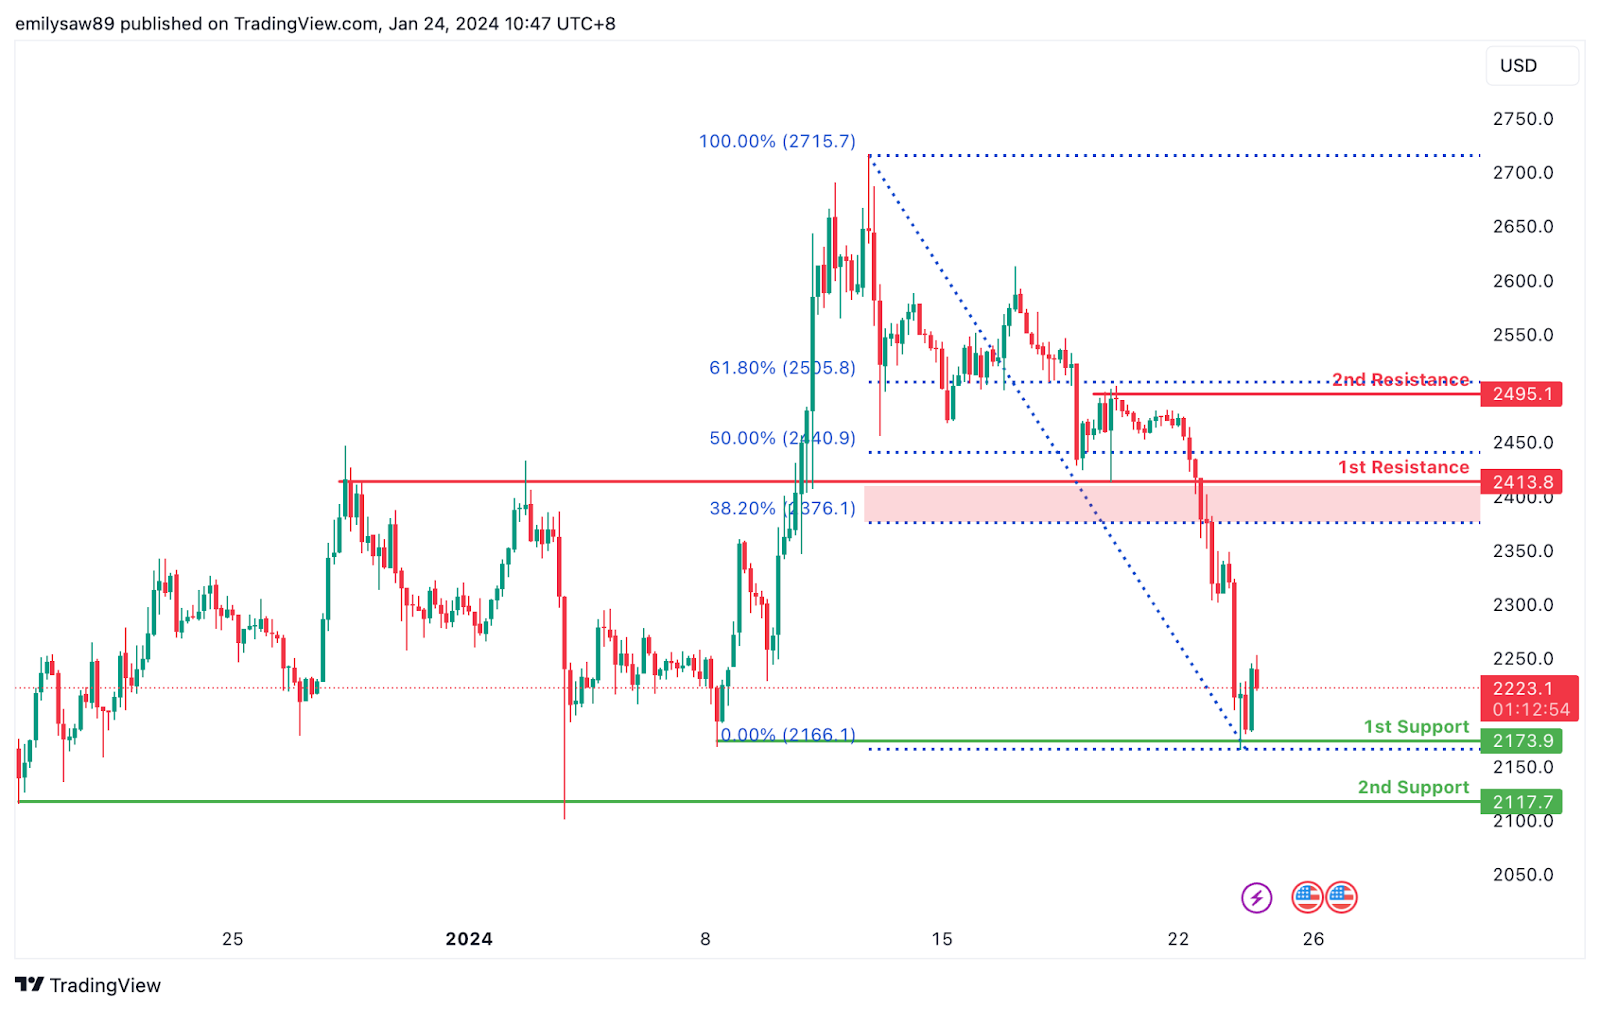
The ETH/USD chart currently displays a weak bullish overall momentum with low confidence, suggesting a hesitant upward trend. Several factors contribute to this weak bullish momentum, indicating the potential for upward movement in the price.
The 1st support at 2173.90 is considered favorable as it is identified as a swing low support, representing a historical level where buying interest has previously emerged. Additionally, the 2nd support at 2117.70 is recognized as a multi-swing low support, providing additional strength to the support zone.
On the resistance side, the 1st resistance at 2413.80 is noteworthy for the presence of an overlap resistance and the 38.20% Fibonacci Retracement, adding significance to this potential resistance level. Furthermore, the 2nd resistance at 2495.10 is acknowledged as a pullback resistance and aligns with the 61.80% Fibonacci Retracement, contributing to the overall resistance zone.
WTI/USD:
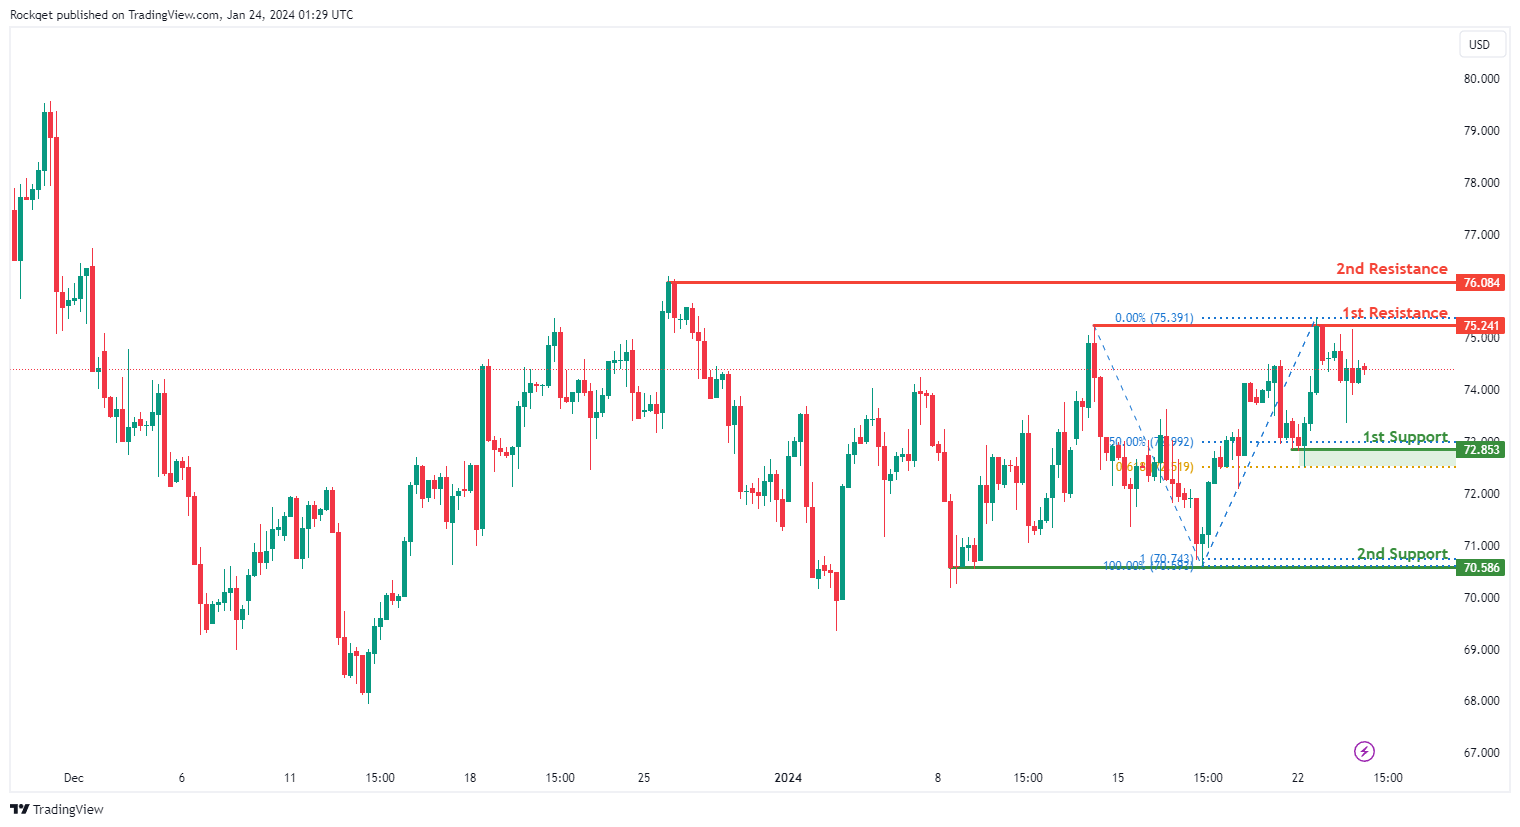
The WTI (West Texas Intermediate) chart currently exhibits a neutral bias. In this context, there is a potential scenario for price to fluctuate between the 1st resistance and the 1st support.
The 1st resistance level at 75.24 is identified as a pullback resistance. Higher up, the 2nd resistance level at 76.08 is also noted as a swing-high resistance, suggesting a potential barrier for further upside movement.
To the downside, the 1st support level at 72.85 is identified as a pullback support that aligns with a confluence of Fibonacci levels i.e. the 50.0% retracement and the 61.80% projection. Further below, the 2nd support level at 70.58 is marked as a pullback support, further reinforcing its importance as a key support level.
XAU/USD (GOLD):
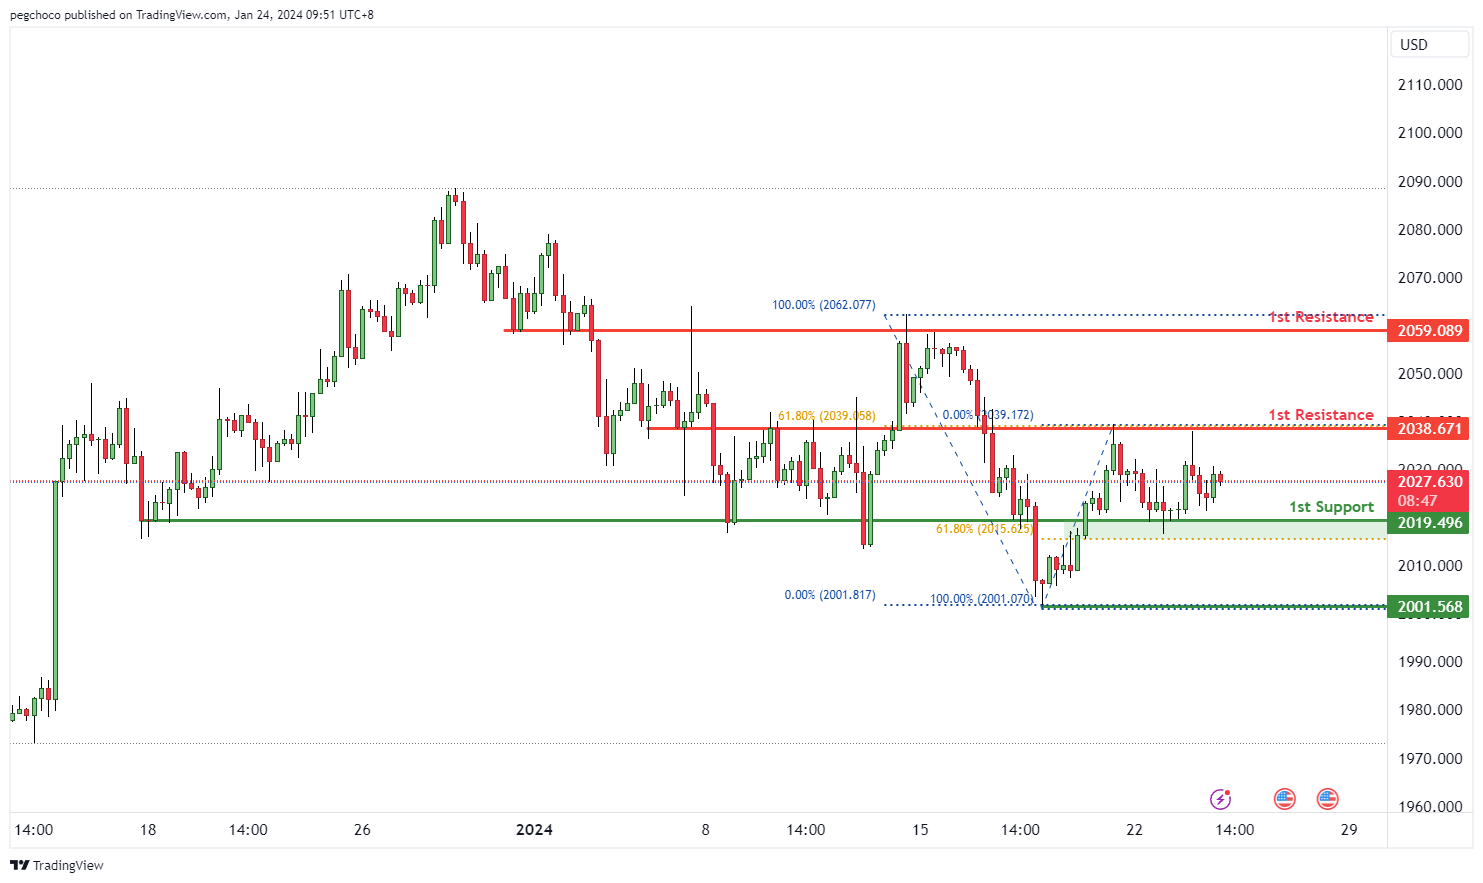
The XAUUSD (Gold/US Dollar) chart is currently exhibiting a neutral overall momentum, indicating a lack of a strong directional bias in the market. Your analysis suggests that there is potential for price to fluctuate between the 1st resistance and the 1st support level.
The 1st support level at 2019.00 is considered significant due to its classification as an overlap support. Additionally, it coincides with the 61.80% Fibonacci Retracement level, adding further significance to this support zone. This implies that it has historically acted as both support and resistance and may serve as an important area where price could potentially find support during periods of price fluctuation.
The 2nd support level at 2001.56 is identified as a swing low support, indicating that this level corresponds to a previous significant low point on the chart. This reinforces its importance as a potential support level during price fluctuations.
On the resistance side, the 1st resistance level at 2038.67 is recognized as an overlap resistance and also coincides with the 61.80% Fibonacci Retracement level. This suggests that it may be a strong resistance point where selling pressure could emerge during price fluctuations.
The 2nd resistance level at 2059.08 is also identified as an overlap resistance, emphasizing its historical significance as a potential barrier for further upward price movement.


