
- Bitcoin really stood dominant in the past 6 months while Ethereum was lagging against other cryptocurrencies such as Solana and XRP.
- Is Ether going to play catch-up? An in-depth technical analysis is due for the second biggest crypto.
- ETH Revisits levels last seen in February 2025 around the $2600 mark.
An Overview on the Cryptocurrencies Market
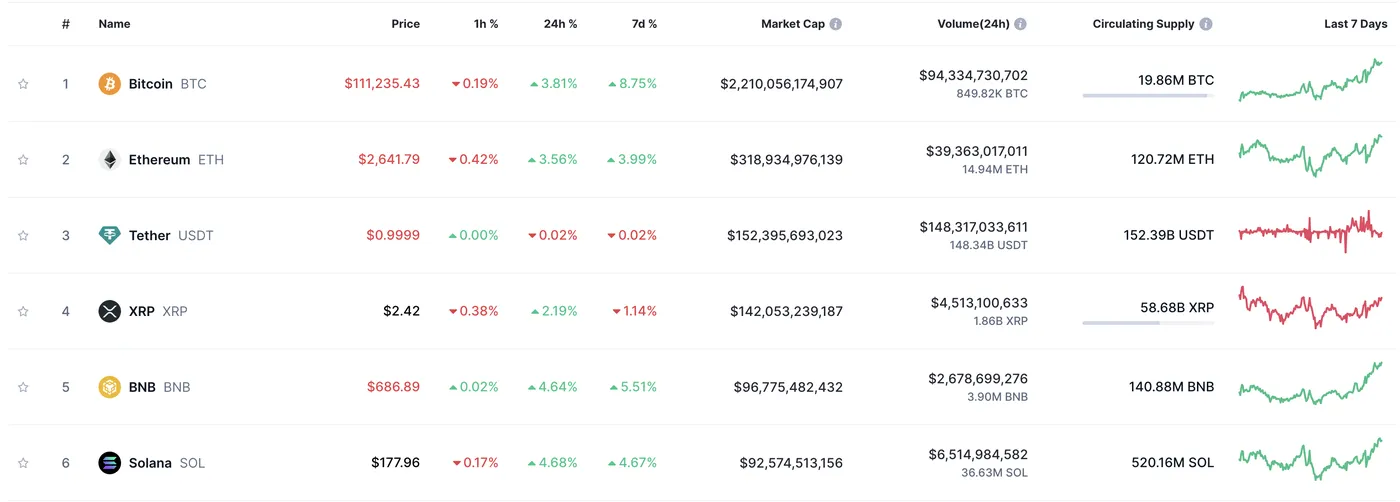
Top 6 Cryptocurrencies by their Market Cap. Source — coinmarketcap.com
Ethereum still stands as the second biggest cryptocurrency even after lagging on the rally that took Bitcoin and Solana to their own all-time highs.
There are concerns surrounding the cryptocurrency that pioneered smart contracts, as it faces higher transaction costs and slower processing speeds compared to its closest competitor, Solana (SOL).
It is important to note though that the development of ETFs for the Cryptocurrency tends to boost its performance, as we have seen with the past year introduction of BTC ETFs.
Besides, Bitcoin hitting fresh all-time highs in today’s overnight session tends to provide a boost to the overall crypto market.
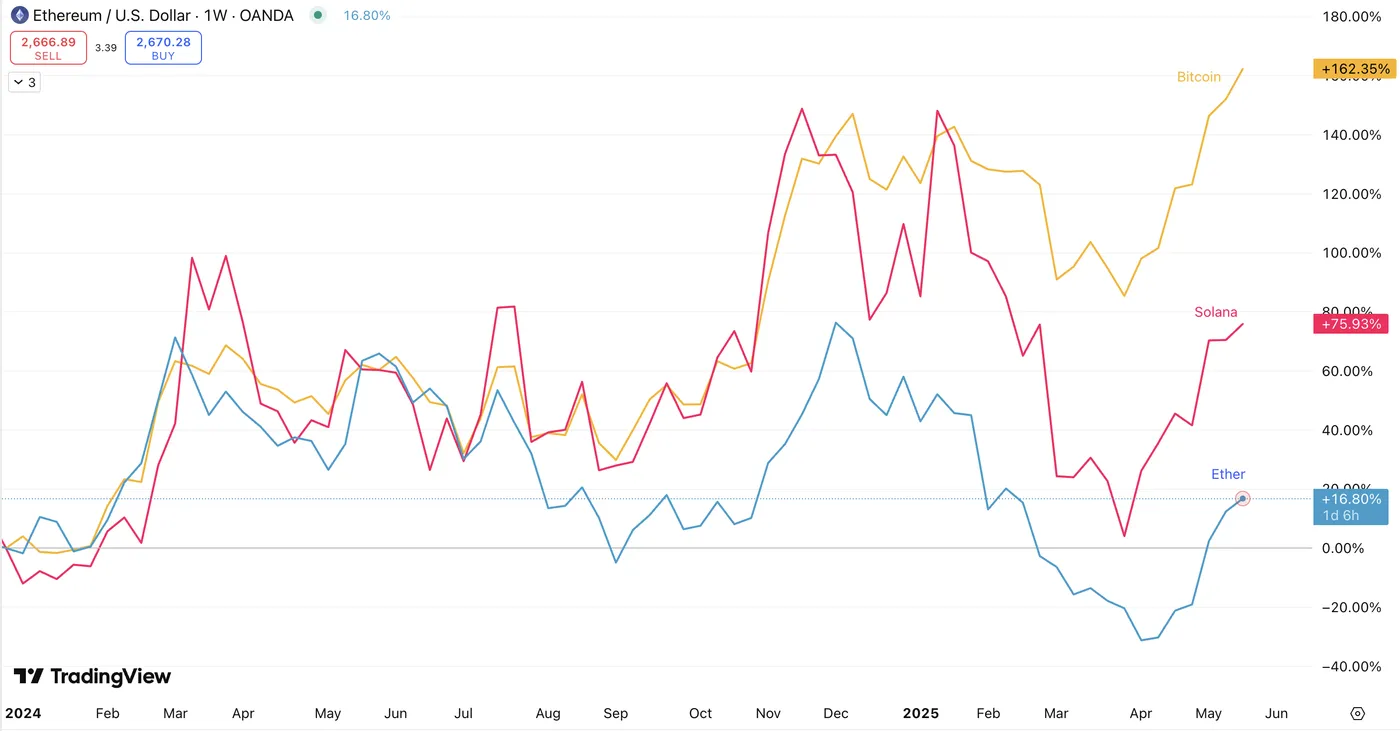
ETH performance vs BTC and SOL, Jan 2024 to today. Source – TradingView.
Ethereum in-depth Technical Analysis
ETH Weekly Levels
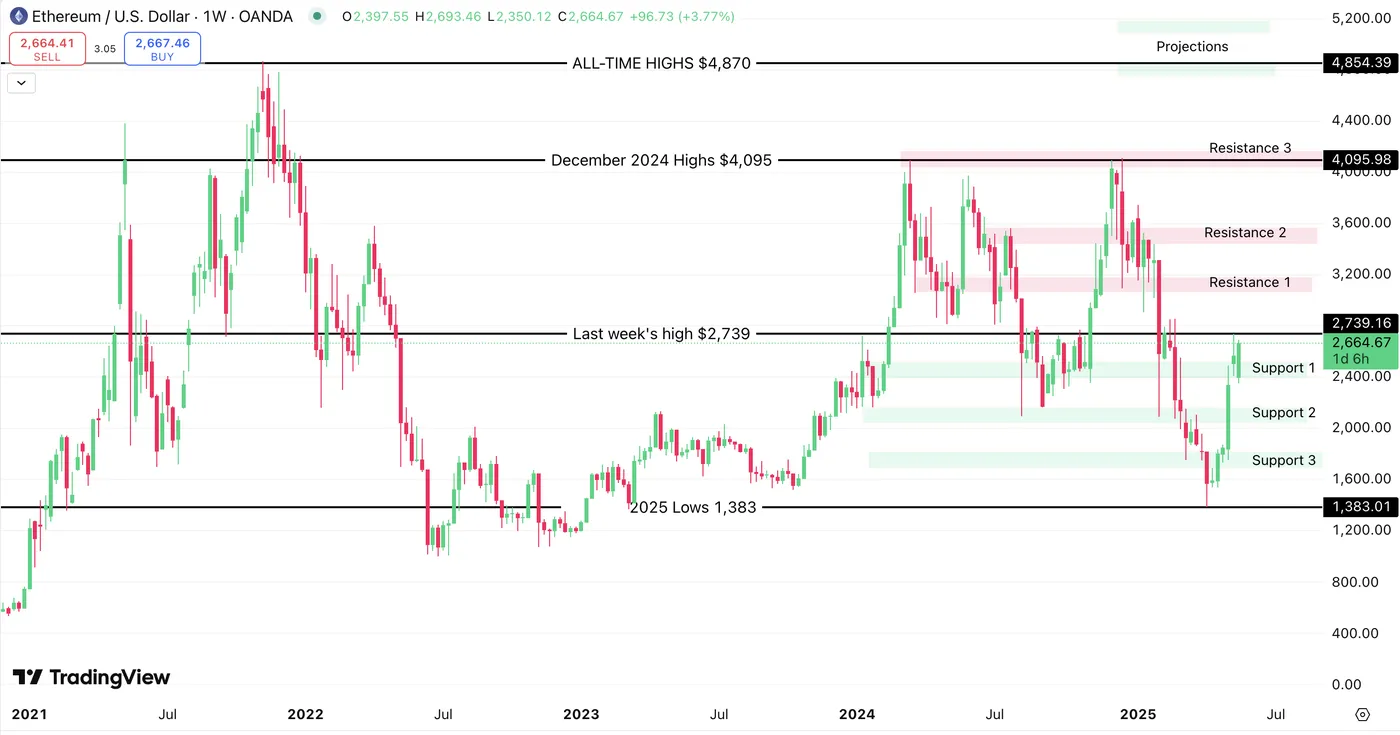
Ethereum Weekly Chart, 2021 to May 22, 2025. Source – TradingView
The weekly charts point to a decent comeback from the crypto with strong bullish candles the past 4 weeks.
We are currently in a support zone on the weekly timeframe, though prices will have to consolidate here to avoid it becoming a bearish pivot zone.
Resistance and Support Zones to look for on the weekly:
- S1: 2,385 – 2,525
- S2: 2,035 – 2,167
- S3: 1,700 – 1,825
Note that prices will already have to break last week highs of $2,739
- R1: 2,850 – 2,992
- R2: 3,225 – 3,363
- R3: 3,660 – 3,800
- December 2024 highs: $4,095
ETH Daily Levels
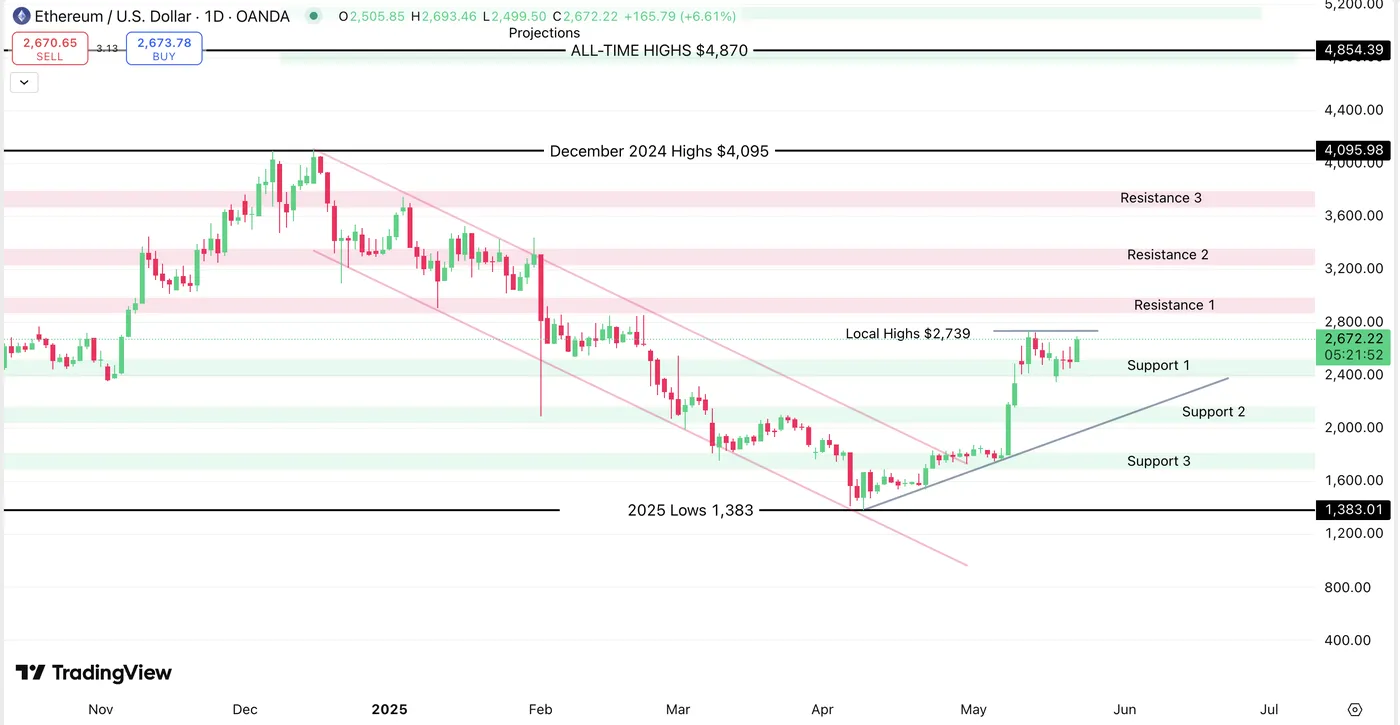
Ethereum Daily Chart, November 2024 to May 22, 2025. Source – TradingView
Daily support and resistance zones for the ETH are similar to the ones found on the weekly timeframe.
ETH has to break above the 14th of May 2025 Highs at $2,739 for a further bullish breakout – though the trend is still bullish as long as we maintain above S1.
ETH Closer View – 4H Chart
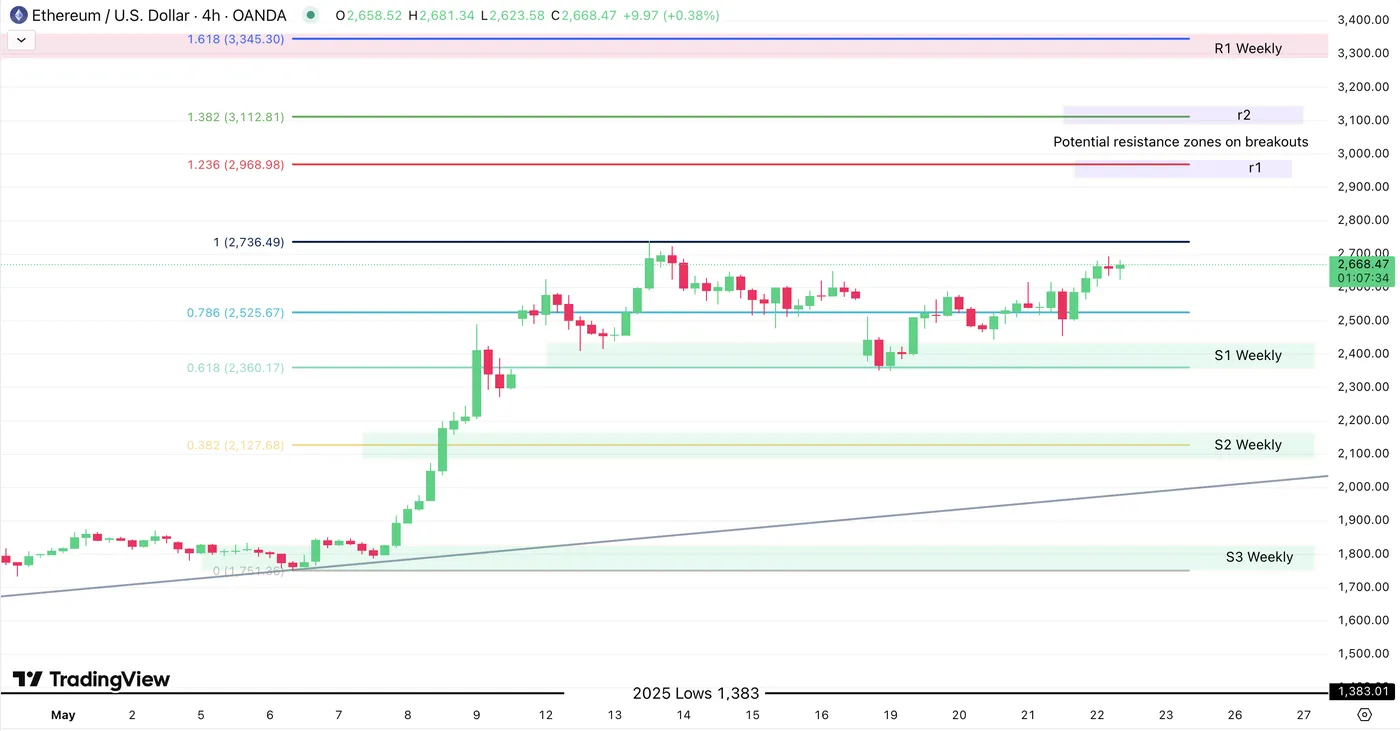
Ethereum 4H Chart, May 2025. Source – TradingView
Ethereum is consolidating at its local highs, a good sign generally as the local top at $2,739 did not form clear lower highs. Prices are now looking to retest the last week highs.
Fibonacci Levels on this 4h charts are key to spot potential support and resistance zones for entry and/or position closes.
Observe how levels on this tool coincide with Support and Resistance zones from bigger timeframes.
r1 and r2 on the chart indicate potential resistance zones to expect on a breakout.
- r1: 2,926 – 3,000
- r2: 3,086 – 3,150
Safe trades!


