
A note on lower timeframe confirming price action…
Waiting for lower timeframe confirmation is our main tool to confirm strength within higher timeframe zones, and has really been the key to our trading success. It takes a little time to understand the subtle nuances, however, as each trade is never the same, but once you master the rhythm so to speak, you will be saved from countless unnecessary losing trades. The following is a list of what we look for:
- A break/retest of supply or demand dependent on which way you’re trading.
- A trendline break/retest.
- Buying/selling tails … essentially we look for a cluster of very obvious spikes off of lower timeframe support and resistance levels within the higher timeframe zone.
- Candlestick patterns. We tend to only stick with pin bars and engulfing bars as these have proven to be the most effective.
EUR/USD
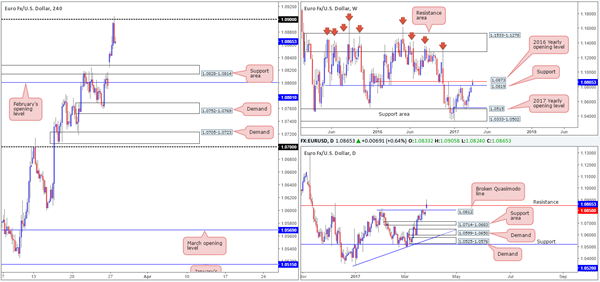
The EUR started the week off on a strong footing, gapping around 50 pips north at the open which remains unfilled at this point. Strong buying, as you can see, took place throughout Asia and London. It was only once price crossed swords with the 1.09 handle going into the US session did we see the bears make an appearance, which has so far erased 50% of the day’s gains. Alongside the 1.09 handle, the 2016 yearly opening level at 1.0873 and the daily resistance level coming in at 1.0850 have both been brought into play.
Despite the impressive H4 bearish rotation candle printed from 1.09, the bears have little space to stretch their legs at the moment. Collectively, the following zones are likely to become problematic down the road: the H4 support area at 1.0828-1.0814, the weekly support at 1.0819 and the daily broken Quasimodo line at 1.0812.
Our suggestions: Given the above points, neither a long nor short seems attractive at this time. Therefore, we’ll remain on the sidelines during today’s action.
Data points to consider: US consumer confidence at 3pm along with FOMC member Kaplan speaking at 6pm GMT.
Levels to watch/live orders:
- Buys: Flat (stop loss: N/A).
- Sells: Flat (stop loss: N/A).
GBP/USD
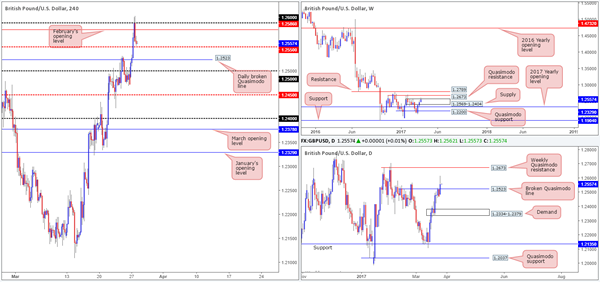
Kicking this morning’s report off with a look at the weekly timeframe, we can see that price briefly spiked above supply coming in at 1.2569-1.2404 yesterday. While this move has likely triggered a truckload of buy stops, which the big boys look to be selling into as we write, there is still a chance that the Quasimodo resistance barrier seen overhead at 1.2673 may come into the picture sometime this week.
Over on the daily candles, the pair closed beyond the Quasimodo resistance level at 1.2523 yesterday. Assuming that the bulls defend this line as support, the next upside hurdle to keep an eyeball on here is the aforementioned weekly Quasimodo resistance base.
The 1.09 handle, alongside February’s opening line at 1.2586, elbowed its way into the spotlight on Monday, consequently forcing the piece to close just ahead of the H4 mid-way support at 1.2550.
Our suggestions: Through the simple lens of a technical trader, we see the following:
Selling this market is backed by the current weekly supply. However, seeing as how this would entail shorting into the H4 mid-way support and daily broken Quasimodo line, we would prefer not to get involved here.
Although price is currently trading nearby both the H4 mid-way support and daily broken Quasimodo line, buying this unit is also a tad tricky given that price is circulating within weekly supply!
Much like the EUR/USD, this market is quite restricted. As such, remaining on the sidelines for the time being seems the better path to take right now.
Data points to consider: US consumer confidence at 3pm along with FOMC member Kaplan speaking at 6pm GMT.
Levels to watch/live orders:
- Buys: Flat (stop loss: N/A).
- Sells: Flat (stop loss: N/A).
AUD/USD
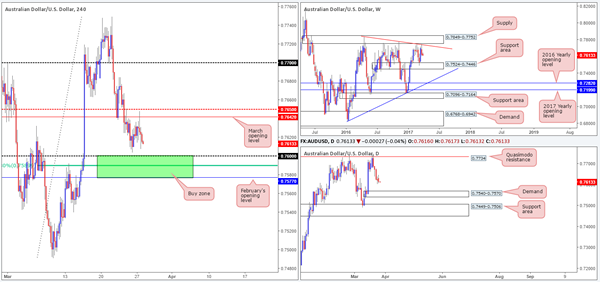
During the course of yesterday’s sessions the commodity currency struck March’s opening level at 0.7642, following an extension of Friday’s bounce from just ahead of the 0.76 handle. The response seen from 0.7642 has so far been solid, and technically speaking, there’s very little seen stopping the H4 candles striking the 0.76 boundary today. As mentioned in Monday’s report, this psychological level is also positioned nearby February’s opening level at 0.7577 and a 61.8% Fib support at 0.7589, forming a rather interesting base of support (painted in green).
What is also notable from this H4 zone is that the daily demand area at 0.7540-0.7570 (positioned just ahead of the weekly support area at 0.7524-0.7446) sits only 7 pips below this area! Therefore, one should prepare for the possibility of a fakeout here!
Our suggestions: While our team is interested in buying from the above noted H4 buy zone, we would still prefer to enter long within the lower limits of its range. That way, we can place stops beyond the daily demand! Should price reach this point and print a reasonably sized H4 bullish rotation candle, then our team would look to buy from here, targeting March’s opening level at 0.7642 as an initial take-profit target.
Data points to consider: US consumer confidence at 3pm along with FOMC member Kaplan speaking at 6pm GMT.
Levels to watch/live orders:
- Buys: 0.7577/0.76 ([waiting for a reasonably sized H4 bullish candle to form before pressing the buy button is advised] stop loss: Ideally beyond the trigger candle).
- Sells: Flat (stop loss: N/A).
USD/JPY
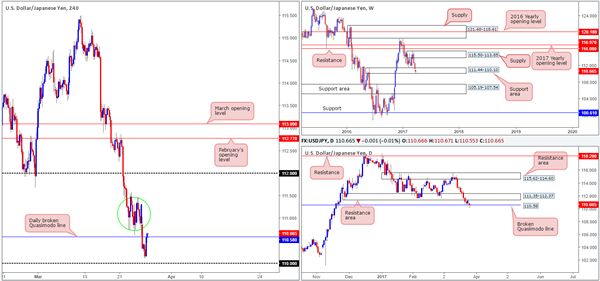
Leaving the psychological handle 110 unchallenged, the pair gravitated north going into the early hours of yesterday’s US segment. This, as you can see, eventually forced H4 price back above the daily broken Quasimodo line at 110.58, consequently forming a reasonably nice-looking daily buying tail. The other key thing to note here is that the weekly candles remain trading within the walls of a support area fixed at 111.44-110.10.
While we would agree that the above points suggest further buying could transpire today, the sellers may still have a hand in this fight! Directly above current price on the H4 scale, there’s a lot of wood to chop through seen between the 111.50/111 handle (green circle). On top of this, there’s also a daily resistance area pegged at 111.35-112.37 to take into consideration.
Our suggestions: Should the current H4 candle print a buying tail off 110.58, we may look to take an aggressive long from here with stops below the candle’s tail, targeting the 111 neighborhood. Here we’d look to reduce risk to breakeven and take 70% off the table, leaving the remaining 30% to run.
Data points to consider: US consumer confidence at 3pm along with FOMC member Kaplan speaking at 6pm GMT.
Levels to watch/live orders:
- Buys: Watch for H4 price to form a buying tail off 110.58 and then look to trade the break of the candle’s high (stop loss: ideally planted beyond the rejection candle’s tail).
- Sells: Flat (stop loss: N/A).
USD/CAD
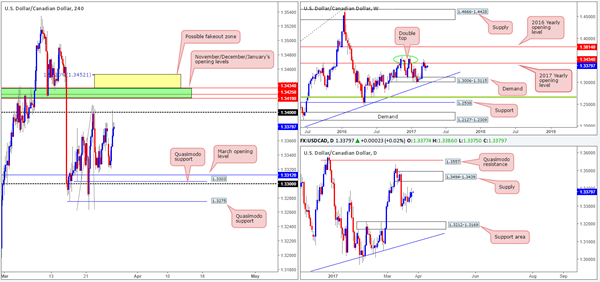
The USD/CAD began the week in a rather negative climate, gapping 22 pips south at the open and collapsing to a session low of 1.3321 going into the London segment. Shortly after, however, the loonie managed to catch a healthy bid just ahead of March’s opening level at 1.3312, and aggressively advance up to the 1.34 boundary. Apart from 1.34, the next H4 resistance on tap can be seen at 1.3434/1.3419 (November, December and January’s opening levels marked in green). It might also be worth noting that directly above here there is a possible H4 fakeout area painted in yellow at 1.3452/1.3434 (the top edge denotes a 127.2% Fib ext. taken from the low 1.3263), which happens to register nicely with the lower limits of a daily supply at 1.3494-1.3439.
Looking over to the bigger picture, weekly action is seen trading within shouting distance of the 2017 yearly opening base line at 1.3434. Daily flow, nonetheless, still offers very little in terms of direction at the moment. The unit is seen meandering mid-range between the aforementioned supply and a support area at 1.3212-1.3169.
Our suggestions: We still have a keen interest in The H4 1.3434/1.3419 region for shorts. Here’s why:
Of note is the 1.34 handle. Psychological levels are prone to fakeouts, and with 1.3434/1.3419 lurking just above 1.34, we feel it’d be a fantastic barrier to help facilitate a fakeout.
When these monthly levels converge, we typically find that they hold firm the majority of the time offering at least a bounce.
In that these monthly levels form a rather small zone, however, and with a somewhat attractive H4 fakeout zone seen above it (attractive due to it being located within daily supply) there is also a chance that price could whipsaw through the monthly levels before turning lower.
To short, we are looking for a H4 bearish selling wick to form that pierces into our pre-determined H4 yellow zone discussed above. With this, a sell from here would be a valid call, in our opinion. From this point, 1.34 could be a potentially troublesome level, so we’d be looking for this base to be consumed, which would in turn be our cue to reduce risk to breakeven.
Data points to consider: US consumer confidence at 3pm along with FOMC member Kaplan speaking at 6pm. BoC Gov. Poloz speaks at 3.10pm GMT.
Levels to watch/live orders:
- Buys: Flat (stop loss: N/A).
- Sells: 1.3452/1.3419 ([watch for a H4 bearish selling wick to form within this range before considering a short] stop loss: ideally beyond the candle’s wick).
USD/CHF
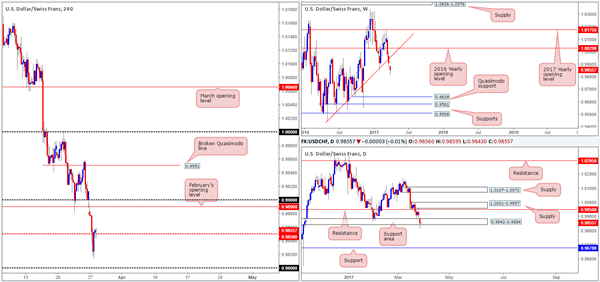
The Swissy, as you can see, opened the week on a bearish note, gapping 30 pips south. Following a retest to the underside of February’s opening base line at 0.9890, the pair continued to dive lower until price stabilized a few pips ahead of the 0.98 handle during the early hours of the US segment, ending the day closing back above the H4 mid-way line 0.9850.
With this in mind, how do things stand on the bigger picture? Last week’s action saw weekly price conclude trade beyond the trendline support extended from low 0.9443. Providing that the bears continue to hold ground here, then the next support target does not come into view until the 0.9639 mark! Down on the daily chart, nevertheless, price is currently holding firm within a support area pegged at 0.9842-0.9884, despite yesterday’s aggressive spike below it. It would take a decisive close beyond this support area to convince us that price could be headed for the support line coming in at 0.9678, which sits only a few pips above the weekly support at 0.9639.
Our suggestions: Given the weekly timeframe, and considering that daily price looks as though it’s hanging on by a thread within the current support area, buying from 0.9850 is not something we’d label high probability. A close back below this number on the other hand, followed up with a retest as resistance, would be enough for us to begin considering selling this market, targeting the 0.98 handle as a first port of call.
Data points to consider: US consumer confidence at 3pm along with FOMC member Kaplan speaking at 6pm GMT.
Levels to watch/live orders:
- Buys: Flat (stop loss: N/A).
- Sells: Watch for H4 price to close back below the 0.9850 level and then look to trade any retest seen thereafter (stop loss: ideally planted beyond the rejection candle’s wick).
DOW 30
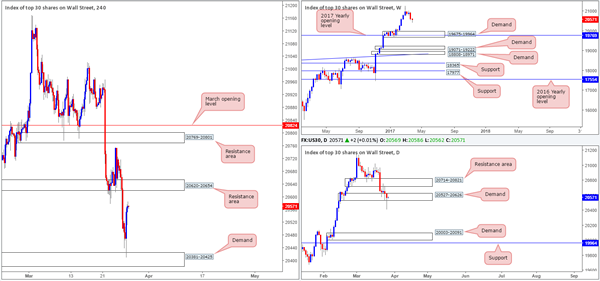
In recent sessions, H4 price shook hands with demand coming in at 20381-20425 and rallied strongly. Despite the market registering a loss yesterday, daily price printed a beautiful-looking buying tail that whipsawed through demand at 20527-20626. Buying at current price, however, would be challenging given the nearby H4 resistance zone drawn in at 20620-20654. And, of course, selling from this H4 zone would place one against potential daily buyers!
Our suggestions: Unfortunately, we see very little structure to hang our hat on this morning. As such, opting to stand on the sidelines here may very well be the better path to take today.
Data points to consider: US consumer confidence at 3pm along with FOMC member Kaplan speaking at 6pm GMT
Levels to watch/live orders:
- Buys: Flat (stop loss: N/A).
- Sells: Flat (stop loss: N/A).
GOLD
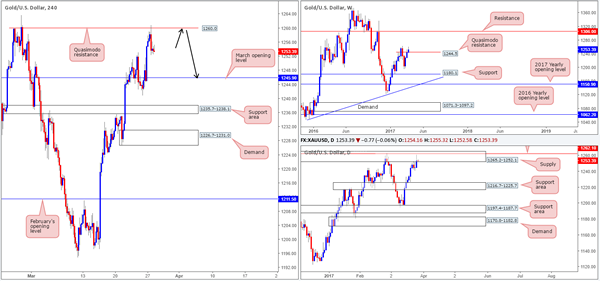
Strengthened by dollar weakness, the yellow metal shifted northbound yesterday. It was only once price crossed paths with a H4 Quasimodo resistance barrier at 1260.0 did bullion begin to stabilize and pullback. To our way of seeing things, this H4 level was helped by daily action residing within a supply area seen at 1265.2-1252.1.
Weekly movement on the other hand, shows that price is trading above a weekly Quasimodo resistance line at 1244.5. However, our desk has noted that until the high of this formation is broken (1263.7), the weekly line will remain valid. In other words, all the while the current daily supply area is in play, our team is bearish!
Our suggestions: Should the H4 candles retest the aforementioned H4 Quasimodo resistance today, we would, assuming that a reasonably sized H4 bearish candle is seen, look to short this market, targeting March’s opening level at 1245.9.
Levels to watch/live orders:
- Buys: Flat (stop loss: N/A).
- Sells: 1260.0 region ([waiting for a reasonably sized H4 bearish candle to form is advised] stop loss: ideally beyond the trigger candle’s wick).


