Sample Category Title
Dollar Caught Between Yesterday’s Disinflation and Tomorrow’s US-Iran Escalation
The Dollar ended the week without establishing a clear direction, despite a genuine shift in the US inflation picture. June CPI and PPI both surprised meaningfully to the downside, reinforcing the view that price pressures had begun to ease more broadly. Yet instead of extending lower, the Greenback stabilized as investors questioned whether the disinflation story would remain intact beyond a single month.
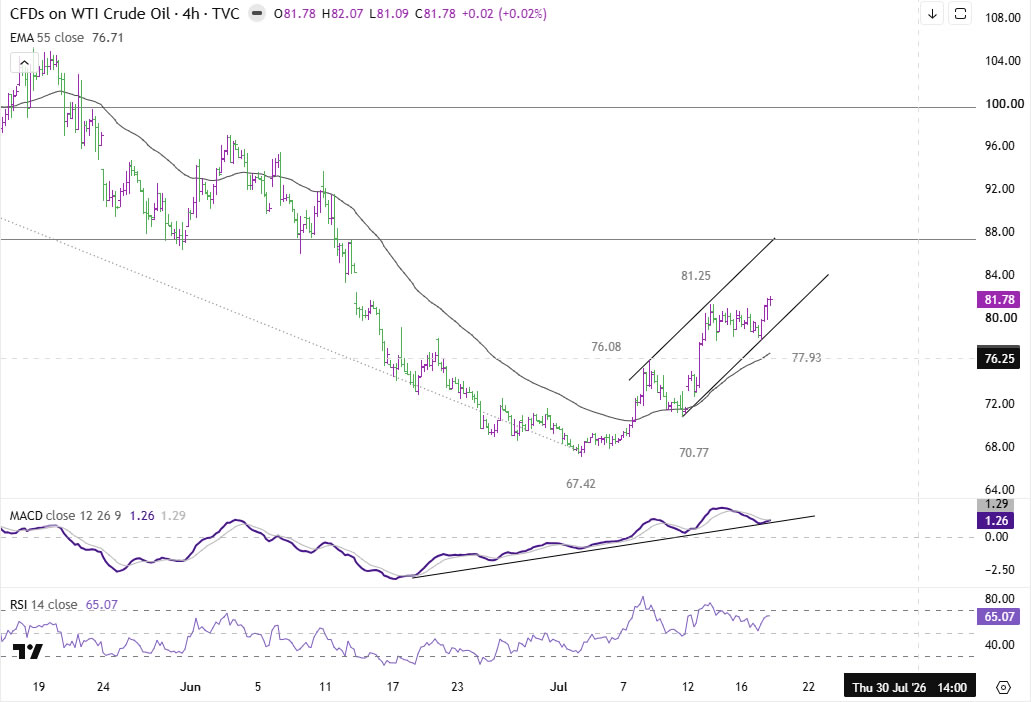
That hesitation reflected the week's second—and ultimately more forward-looking—development. A renewed escalation in the US-Iran conflict sent oil prices sharply higher, with Brent closing above $88 and WTI reclaiming the $80 level. Because June's softer inflation was driven in large part by falling energy prices, the rebound in crude immediately raised the prospect that much of that progress could unwind over the next one or two inflation reports. In other words, markets shifted their focus from what inflation had done to what it was likely to do next.
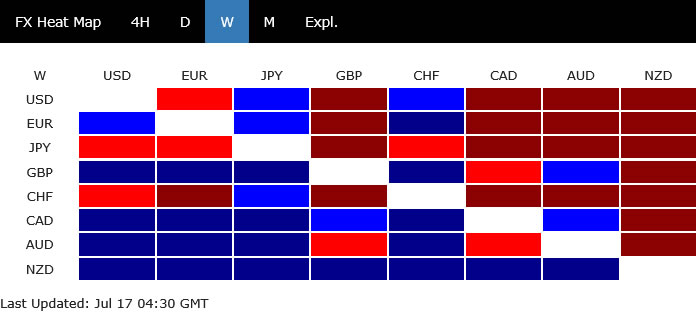
The result was a market caught between conflicting forces. Softer inflation reduced the urgency for further Fed tightening, but higher oil prices simultaneously revived the risk that inflation could accelerate again, preventing rate-hike expectations from fading. That crosscurrent was reflected in currency performance. New Zealand Dollar led gains for the week, followed by Canadian Dollar and Sterling, while Yen finished as the weakest major currency. Dollar settled near the middle of the rankings, a fitting reflection of a market still weighing yesterday's disinflation against tomorrow's inflation risk.
Soft CPI and PPI Shifted the Fed Outlook—Temporarily
June's inflation reports provided one of the strongest pieces of evidence yet that US price pressures were moderating. Headline CPI declined -0.4% mom after rising 0.5% mom in May, pulling the annual rate down from 4.2% yoy to 3.5% yoy, comfortably below market expectations. Core CPI was unchanged on the month, slowing from 2.9% yoy to 2.6% yoy on an annual basis. At the wholesale level, PPI fell -0.3% mom, its largest monthly decline in more than six years, reinforcing the view that pipeline inflation pressures were easing.
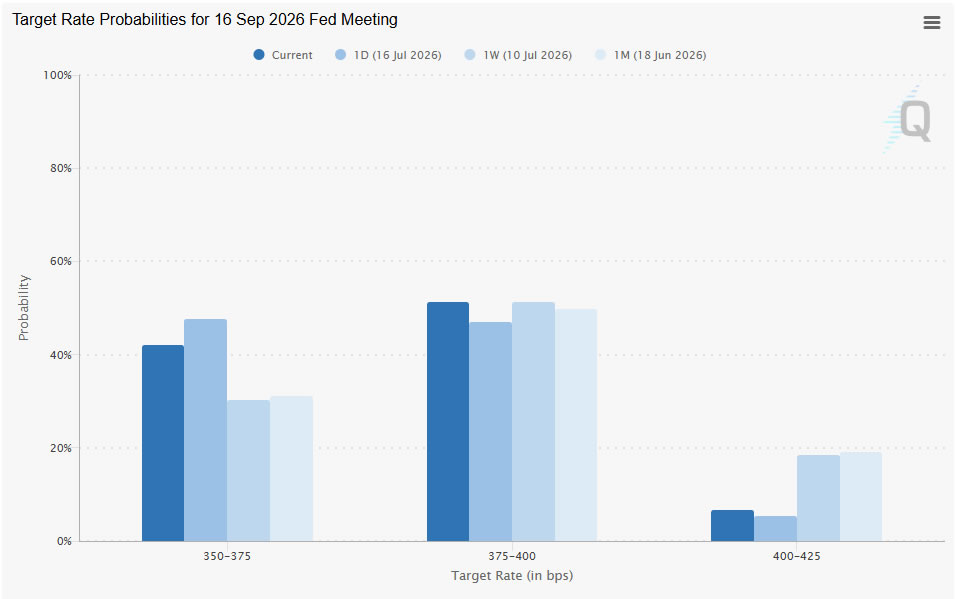
The breadth of the slowdown suggested this was more than a one-off statistical fluctuation. After months of sticky inflation, back-to-back downside surprises in both consumer and producer prices prompted investors to reassess the urgency for additional Fed tightening. Fed funds futures reacted swiftly, with the implied probability of a September rate hike dropping from around 70% a week earlier to about 58% immediately after the data.
However, the composition of the inflation slowdown offered an important caveat. Lower gasoline prices accounted for a significant share of the improvement in both CPI and PPI, reflecting a period when tensions in the Middle East briefly eased and oil prices retreated. As energy markets reversed later in the week, investors quickly recognized that June's encouraging inflation data rested on a foundation that was already beginning to shift. The result was a disinflation story that looked genuine, but also increasingly fragile.
WTI Above $80 Changes the Inflation Narrative
The week's defining market development may ultimately prove to be not the softer inflation data, but crude oil's decisive rebound. As the US-Iran conflict intensified, concerns over energy supplies escalated sharply. The conflict expanded beyond previous tit-for-tat exchanges, with strikes targeting bridges, rail infrastructure, telecommunications facilities and an airport inside Iran, while Iranian retaliation spread across Kuwait, Bahrain, Qatar, Oman and a US military position in Syria. Against that backdrop, WTI settled above USD 80 and Brent closed above USD 88, recording their strongest weekly gains since April.
The significance of WTI reclaiming USD 80 lies in what it means for the inflation outlook. June's disinflation surprise was driven in large part by lower energy prices following a temporary easing in Middle East tensions earlier in the month. Now that crude has retraced those losses, the energy component is likely to move in the opposite direction over coming months. Markets are therefore beginning to question whether June's encouraging CPI and PPI readings will prove to be the low point rather than the start of a sustained moderation in inflation.
This changing outlook also explains why expectations for another Fed rate hike did not continue falling despite the softer data. Investors have become less focused on what June inflation showed and more concerned about what July and August inflation might look like if oil prices remain elevated. With crude now acting as a renewed source of inflation risk, energy markets—not last month's economic data—have become the primary driver of Fed repricing and, by extension, the Dollar's direction.
Fed Keeps the Door Open to Further Tightening
Federal Reserve officials broadly maintained a cautious, hawkish-leaning tone throughout the week, even as June's inflation reports came in softer than expected. Testifying before Congress, Chair Kevin Warsh rejected any suggestion that the Fed's job was complete, arguing that inflation remained too high despite recent progress. He also reiterated that monetary policy was "not particularly restrictive," reinforcing the view that the Committee still sees scope to tighten further if inflation risks intensify.
Governor Christopher Waller echoed that stance. Ahead of the inflation releases, he indicated that another rate hike could be warranted in the near term if CPI and PPI surprised on the upside. While the actual data reduced the immediate case for further tightening, his comments illustrated that the Fed remains highly sensitive to any renewed inflation pressure. Dallas Fed President Lorie Logan stood out as the week's most hawkish voice, becoming the first Fed official to publicly support another interest rate increase since Warsh became chair.
The overall message from the Fed changed little despite the encouraging inflation data. Policymakers acknowledged the improvement but showed no willingness to signal that rate hikes were off the table. Instead, the Committee appears content to let incoming data—and increasingly, developments in energy markets—guide its next move. With Fed rhetoric offering few surprises, markets have become more focused on whether higher oil prices will eventually force policymakers back toward a more aggressive stance.
Technical Outlook: Dollar Awaits Confirmation from Oil and Yields
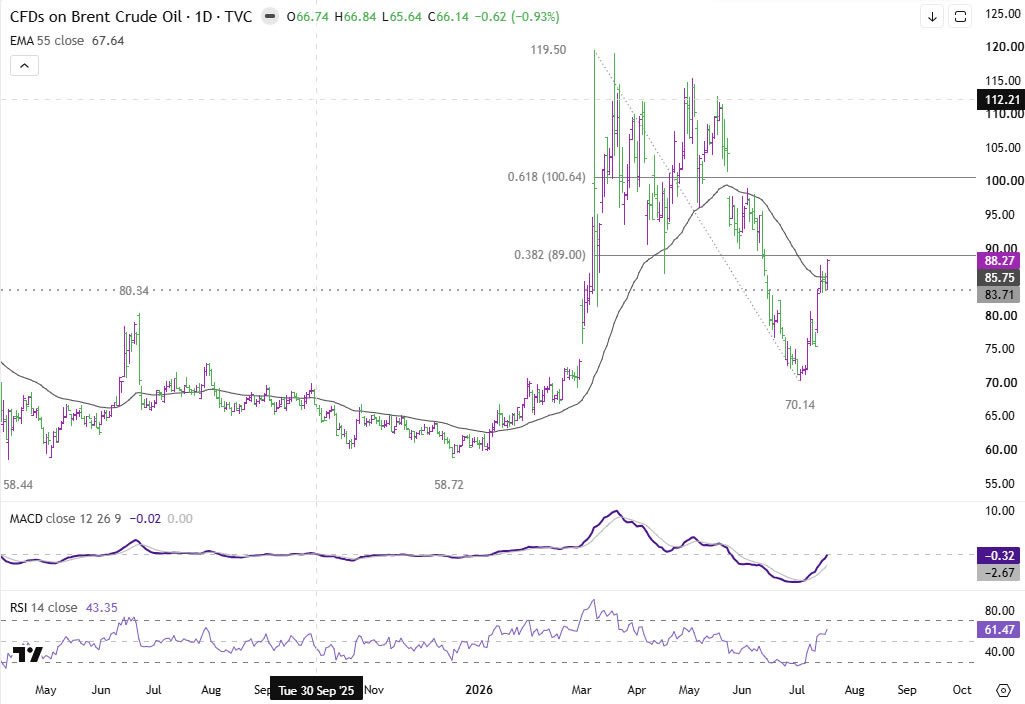
Brent crude remains the market's leading indicator. The advance from 70.14 has taken on the characteristics of a five-wave impulsive rally, pointing to a potential bullish trend reversal. The close above 55 D EMA (now at 85.75) strengthens that interpretation. The next critical test lies at the 38.2% retracement of 119.50 to 70.14 at 89.00, an area that also coincides with the important 90 psychological level.
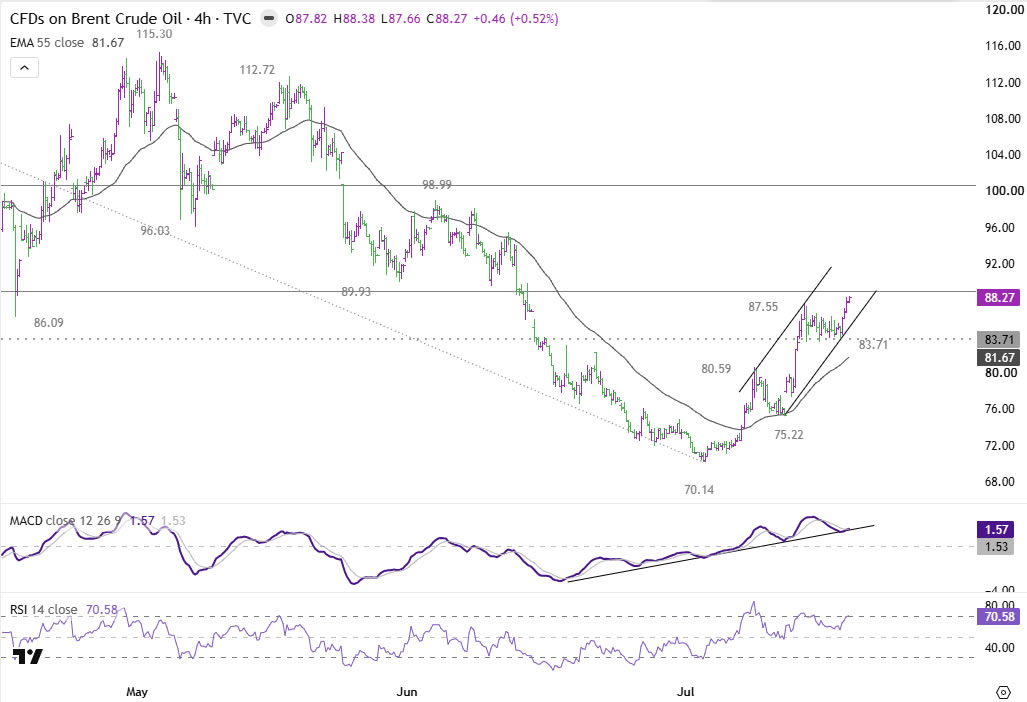
Decisive break above this 89/90 zone would argue that Brent is already reversing whole fall from 119.50. That would pave the way to 61.8% retracement at 100.64, which is close to 100 psychological level. Failure to overcome 89-90, followed by a break below 83.71, would instead argue that the recent rally was merely a corrective rebound, and has completed.
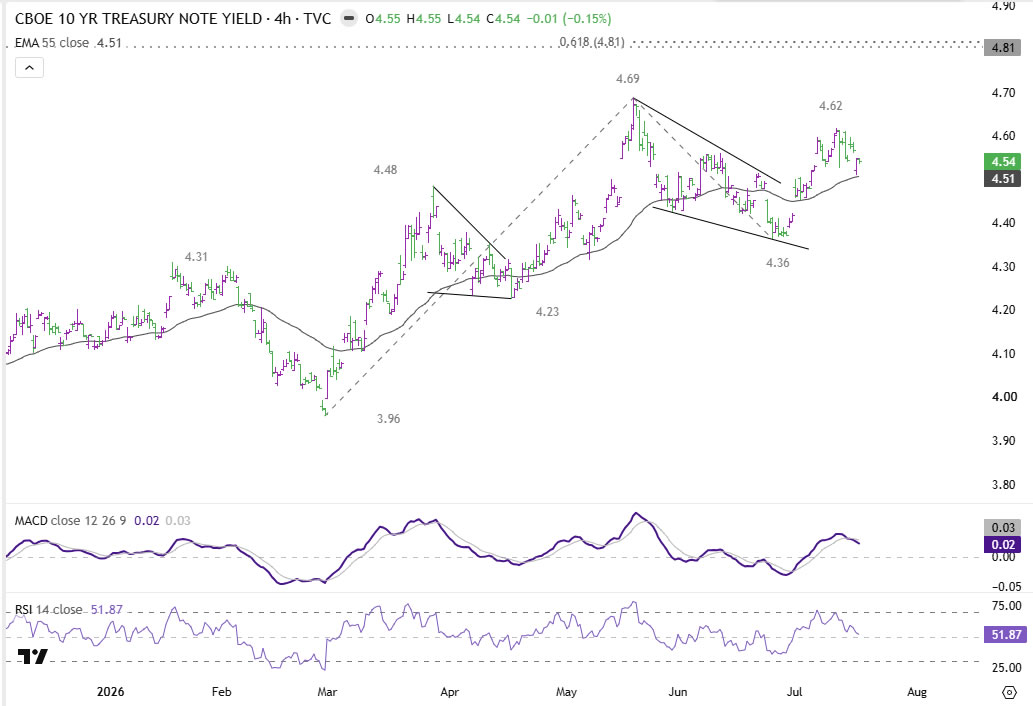
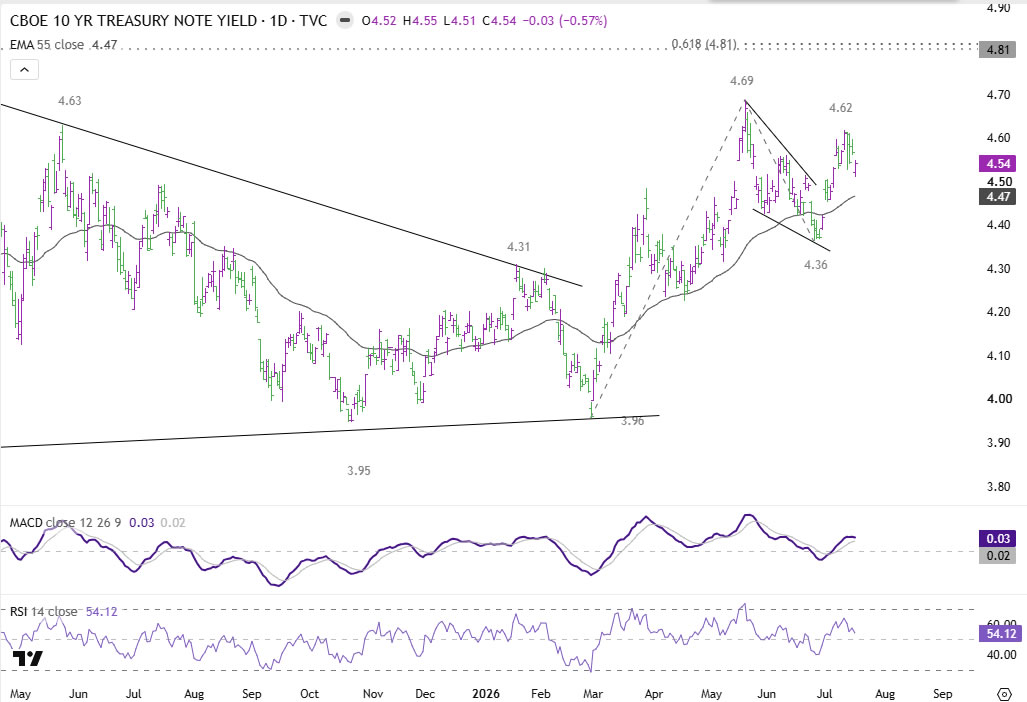
US 10-year yield dipped to 4.51 but quickly recovered after drawing support from 55 4H EMA (now at 4.51). No change in the outlook that correction from 4.69 has completed at 4.36, and rise from 3.96 is resuming. above 4.62 resistance will affirm this bullish case, and target a retest on 4.62 high.
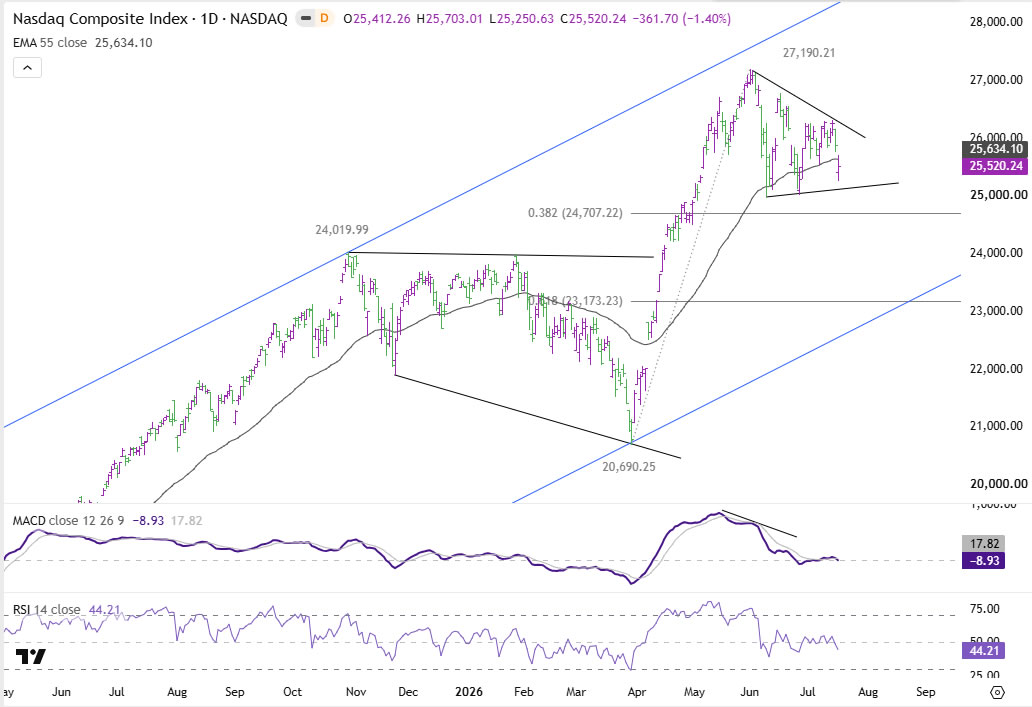
NASDAQ's selloff on Friday and break of 55 D EMA (now at 25634.10) suggests that consolidation pattern from 27190.21 is extending with another falling leg. Strong support should be seen around 38.2% retracement of 20690.25 to 27190.23 at 24707.22 to contain downside to bring rebound. However, firm break of this fibonacci level support will argue that it's not just in a near term correction, but could be in a larger scale one and risk deeper selloff to 61.8% retracement at 23173.23.
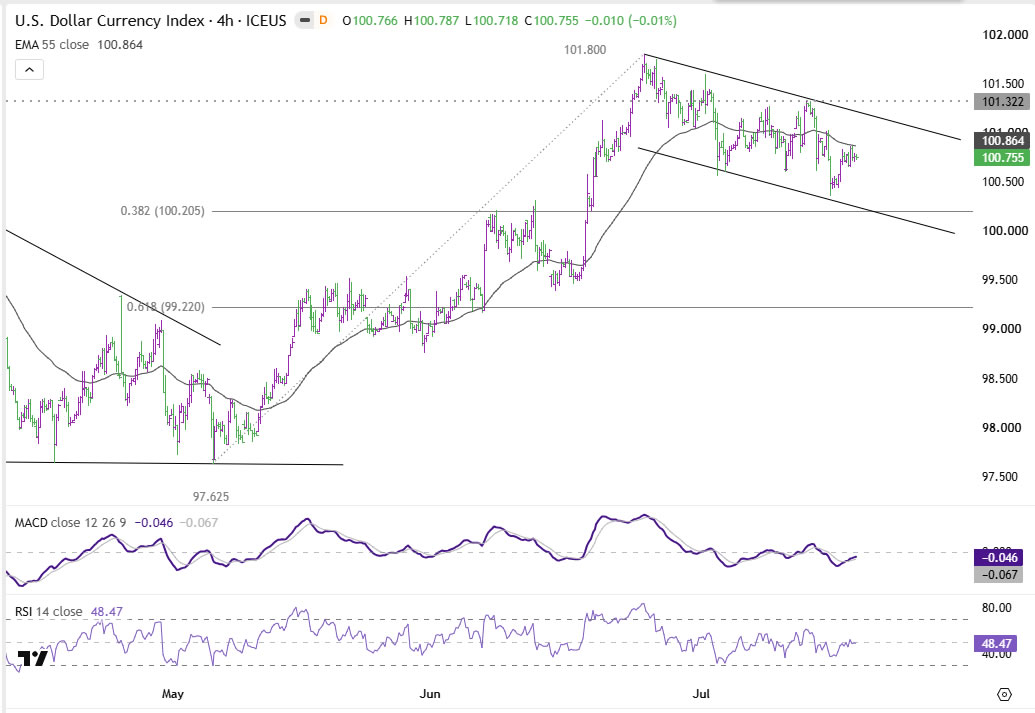
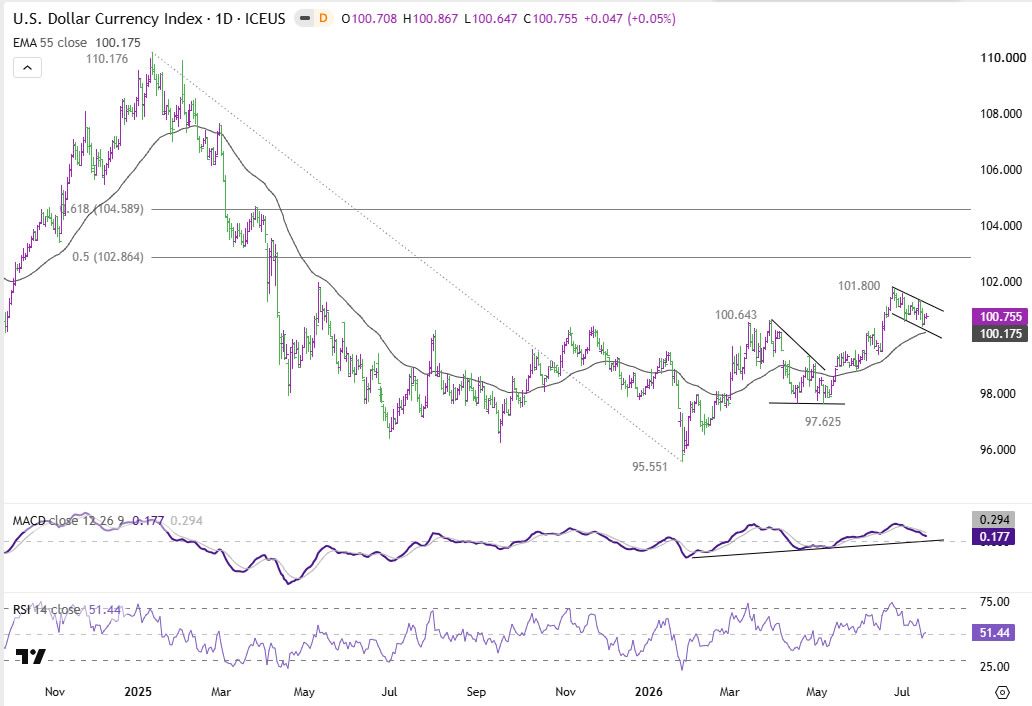
Dollar Index's correction from 101.80 extended lower last week but holds above 38.2% retracement of 97.62 to 101.80 at 100.20, as well as 55 D EMA (now at 100.17). Further rally is still expected. Above 101.32 minor resistance will bring retest of 101.80 first. Firm break there will extend whole rise from 95.55 to 50% retracement 110.17 to 95.55 at 102.86. However, sustained break of 55 D EMA will bring deeper decline back to 97.62 support, and raise the chance of near term bearish reversal.
Outlook: Gulf Developments Likely to Dictate Dollar's Next Move
The Dollar enters the new week still searching for a decisive catalyst. If the US-Iran conflict continues to intensify, Brent is likely to challenge or break above the $90 threshold, reinforcing expectations that the recent disinflation trend could prove short-lived. Such an outcome would probably lift Treasury yields, strengthen pricing for another Fed rate hike later this year, and provide fresh support for the Dollar.
On the other hand, any meaningful de-escalation that allows oil prices to retrace would revive confidence that inflation is returning to a downward path, encouraging markets to pare back tightening expectations and reopening the door to broader Dollar weakness.
At this stage, the escalation scenario appears marginally more likely. The increasingly coordinated nature of recent military operations and Iran's widening retaliation suggest the conflict is entering a more dangerous phase than earlier exchanges. Even so, investors have learned over recent weeks that geopolitical developments can change abruptly. The Dollar therefore remains at a crossroads, with its next major move likely to be determined less by Fed rhetoric or scheduled data releases than by whether oil continues to rewrite the inflation outlook.
EUR/USD Weekly Outlook
EUR/USD extended the consolidations pattern above 1.1323 last week and outlook is unchanged. Initial bias remains neutral this week, and with 1.1499 support turned resistance intact, further decline is expected. On the downside, break of 1.1323 will resume the fall from 1.2081 to 100% projection of 1.2081 to 1.1408 from 1.1848 at 1.1175. However, decisive break of 1.1499 will turn bias back to the upside for 1.1621 resistance.
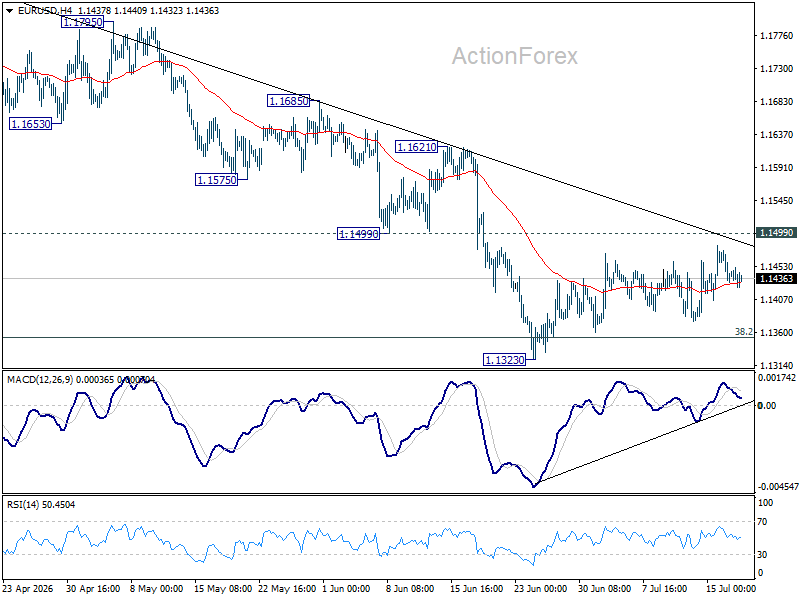
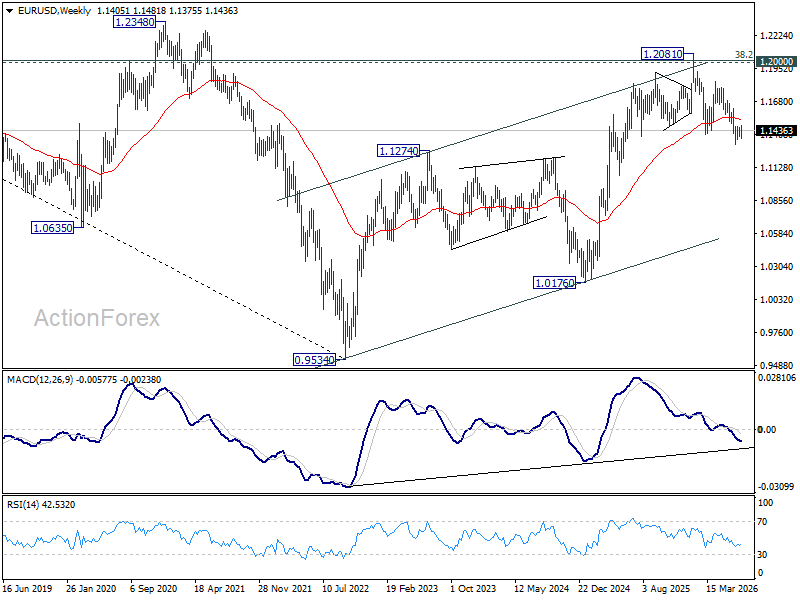
In the bigger picture, focus is back on 38.2% retracement of 1.0176 to 1.2081 at 1.1353. Decisive break there will revive the case of medium term bearish trend reversal after rejection by 1.2 key cluster resistance level. Further fall should be seen to 61.8% retracement at 1.0904. Nevertheless, strong rebound from 1.1353, followed by break of 1.1621 resistance, will retain medium term bullishness.
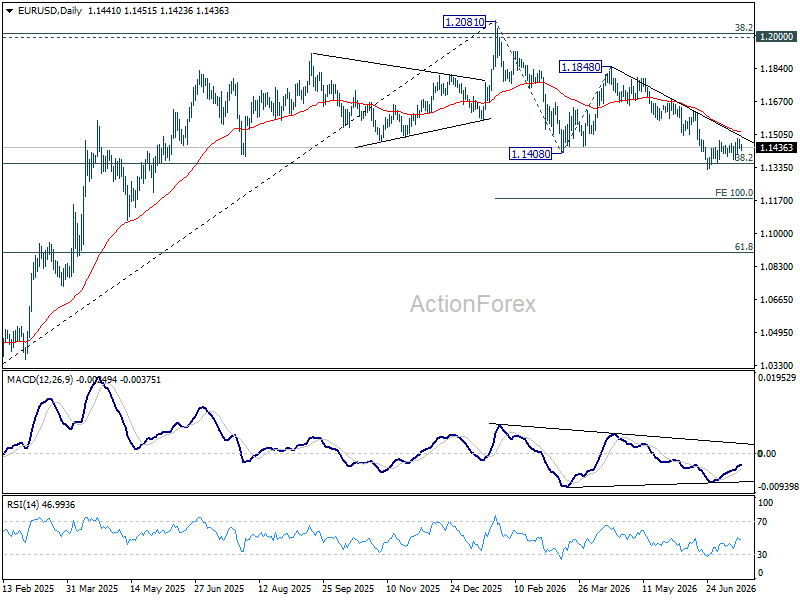
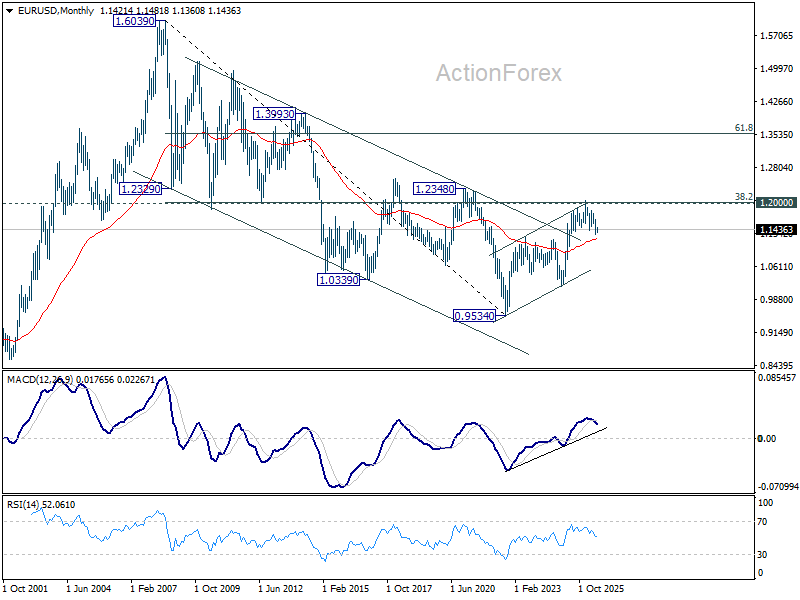
In the long term picture, 38.2% retracement of 1.6039 to 0.9534 at 1.2019, which is close to 1.2000 psychological level is the key for the outlook. Rejection by this level will keep the multi decade down trend from 1.6039 (2008 high) intact, and keep outlook neutral at best. However, decisive break of 1.2000/19, will suggest long term bullish trend reversal, and target 61.8% retracement at 1.3554.
EUR/USD Weekly Outlook
EUR/USD extended the consolidations pattern above 1.1323 last week and outlook is unchanged. Initial bias remains neutral this week, and with 1.1499 support turned resistance intact, further decline is expected. On the downside, break of 1.1323 will resume the fall from 1.2081 to 100% projection of 1.2081 to 1.1408 from 1.1848 at 1.1175. However, decisive break of 1.1499 will turn bias back to the upside for 1.1621 resistance.
In the bigger picture, focus is back on 38.2% retracement of 1.0176 to 1.2081 at 1.1353. Decisive break there will revive the case of medium term bearish trend reversal after rejection by 1.2 key cluster resistance level. Further fall should be seen to 61.8% retracement at 1.0904. Nevertheless, strong rebound from 1.1353, followed by break of 1.1621 resistance, will retain medium term bullishness.
In the long term picture, 38.2% retracement of 1.6039 to 0.9534 at 1.2019, which is close to 1.2000 psychological level is the key for the outlook. Rejection by this level will keep the multi decade down trend from 1.6039 (2008 high) intact, and keep outlook neutral at best. However, decisive break of 1.2000/19, will suggest long term bullish trend reversal, and target 61.8% retracement at 1.3554.
USD/JPY Weekly Outlook
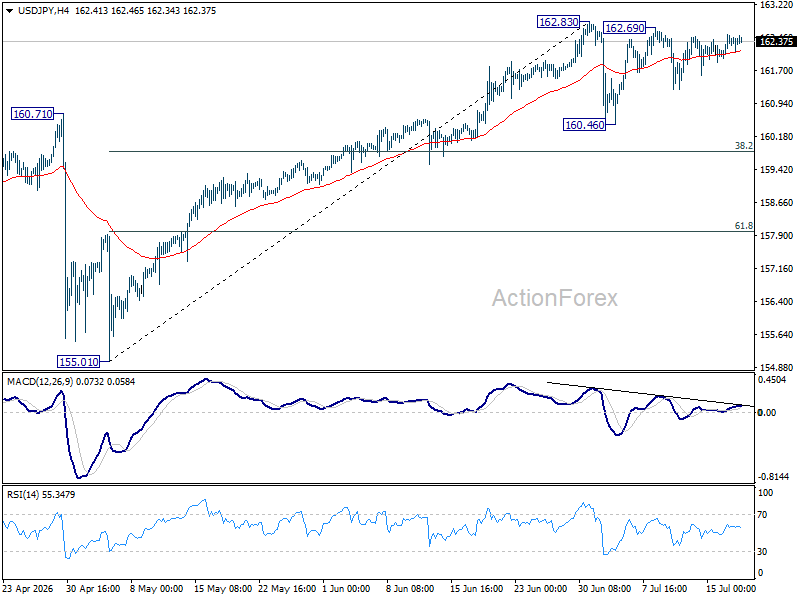
USD/JPY is still bounded in consolidations pattern from 162.83. Initial bias remains neutral this week first. Another fall cannot be ruled out as the consolidations extends, but downside should be contained by 38.2% retracement of 155.01 to 162.83 at 159.84. On the upside, firm break of 162.83 will extend the larger up trend to 164.34 projection level.
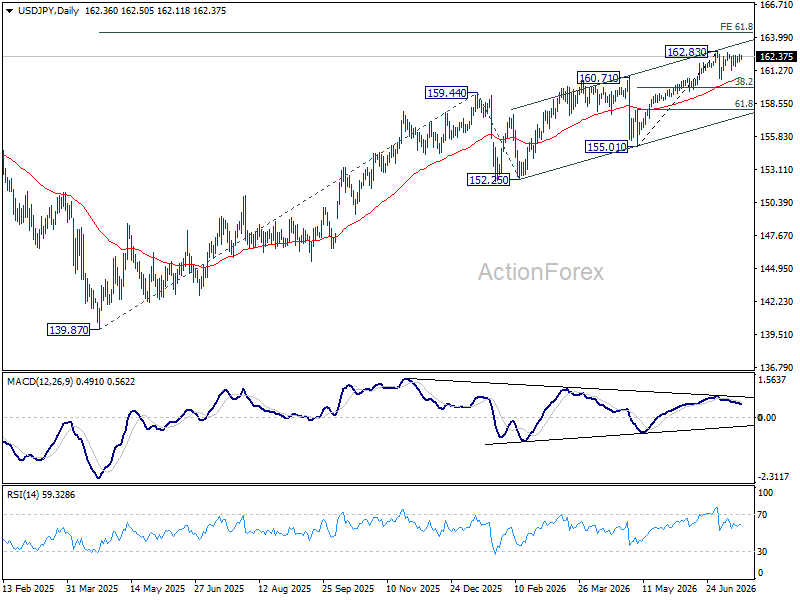
In the bigger picture, rise from 139.87 (2025 low) is seen as another rising leg of the long term up trend. Next target is 61.8% projection of 139.87 to 159.44 from 152.25 at 164.34. For now, outlook will remain bullish as long as 155.01 support holds, even in case of deep pullback.
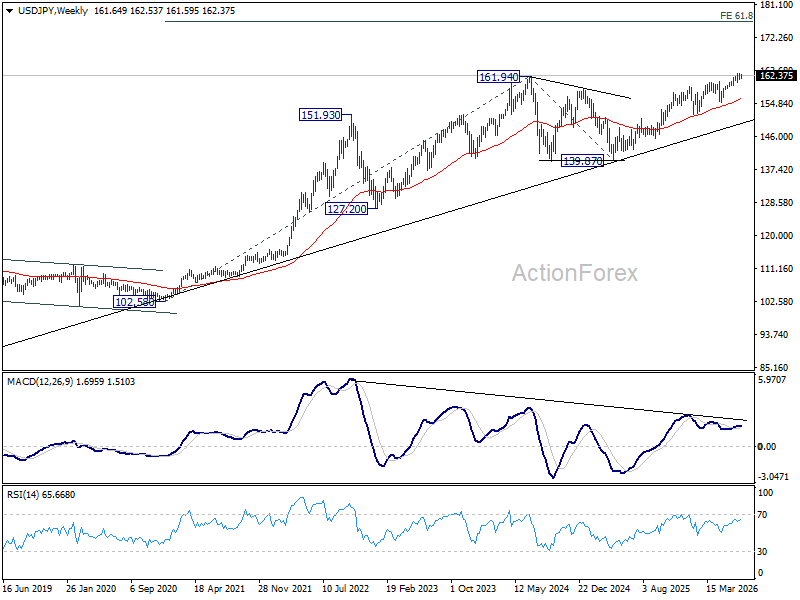
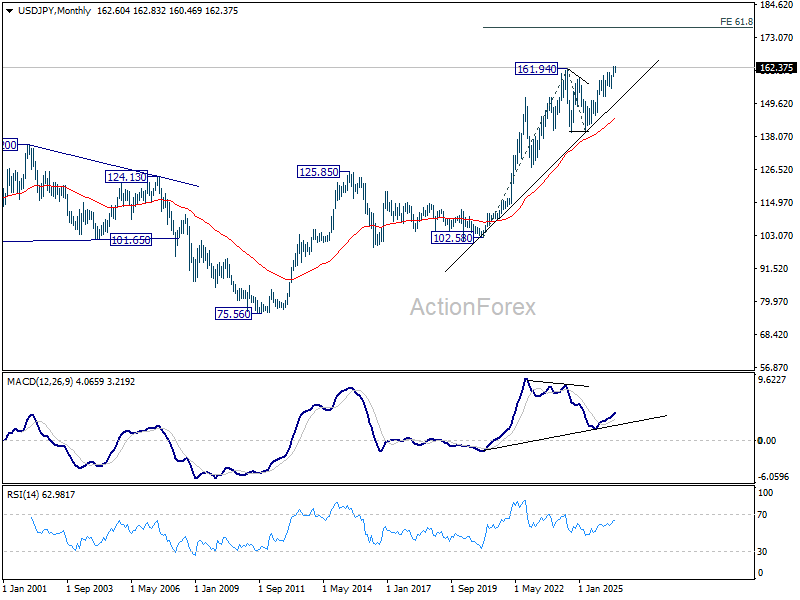
In the long term picture, up trend from 75.56 (2011 low) is still in progress and might be ready to resume. Firm break of 161.94 will target 61.8% projection of 102.58 (2020 low) to 161.94 (2024 high) from 139.87 at 176.55 in the medium term. Long term outlook will stay bullish as long as 139.87 support holds, even in case of deep pullback.
GBP/USD Weekly Outlook
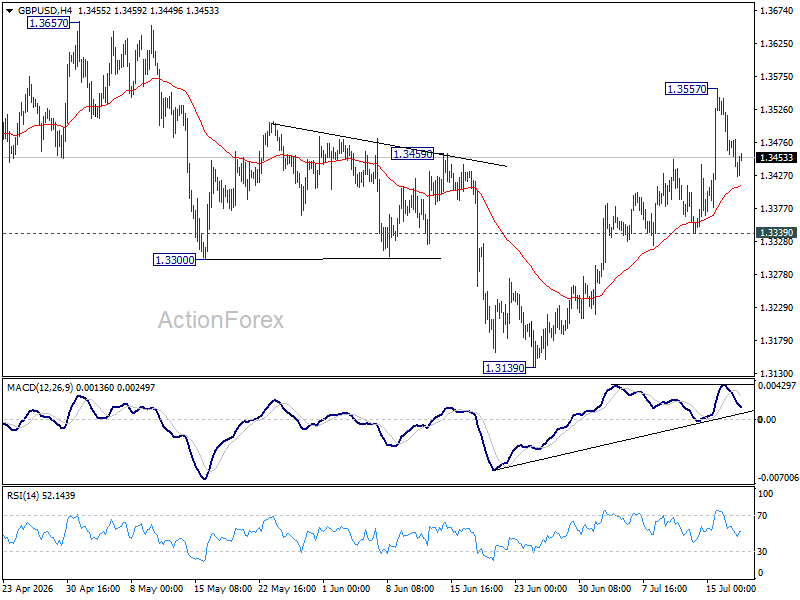
GBP/USD surges further to 1.3557 last week before retreating. Current development argues that corrective pattern from 1.3867 has completed with three waves down to 1.3139. Above 1.3557 will target 1.3657 first. Firm break there will bring retest of 1.3867 high. However, break of 1.3339 support will dampen this bullish view and bring deeper fall back to 1.3139 instead.
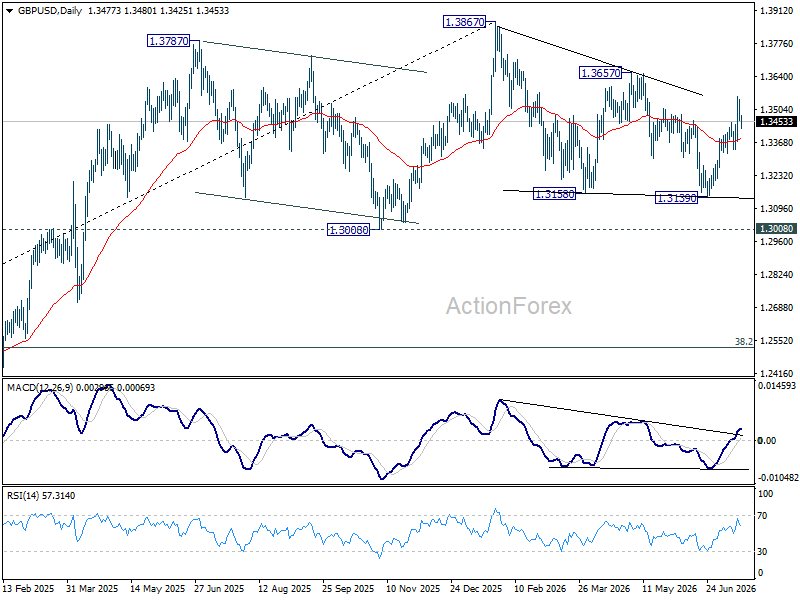
In the bigger picture, price actions from 1.3867 are a corrective pattern within the broader up trend from 1.0351 (2022 low). With 1.3008 support intact, medium term bullishness is maintained and break of 1.3867 is in favor for a later stage, towards 1.4248 key resistance (2021 high). However, firm break of 1.3008 will at least bring deeper fall to 38.2% retracement of 1.0351 to 1.3867 at 1.2524, with increased risk of bearish reversal.
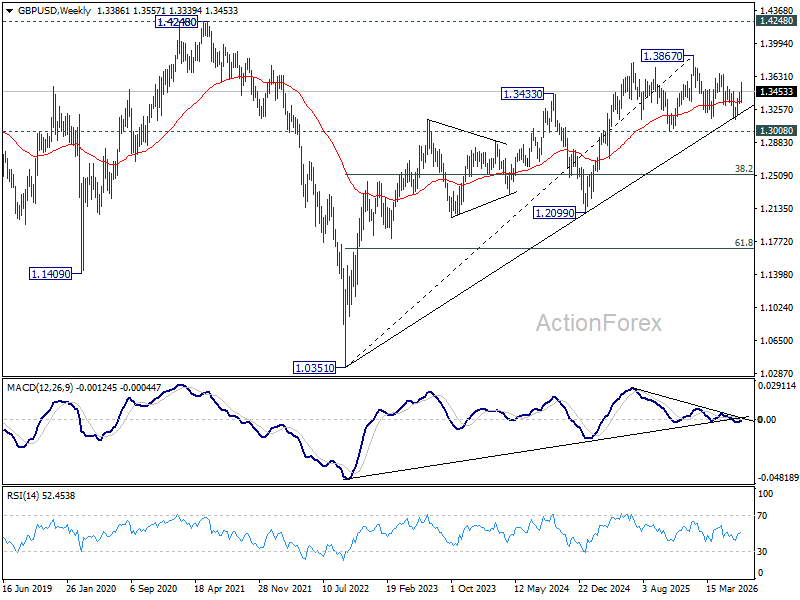
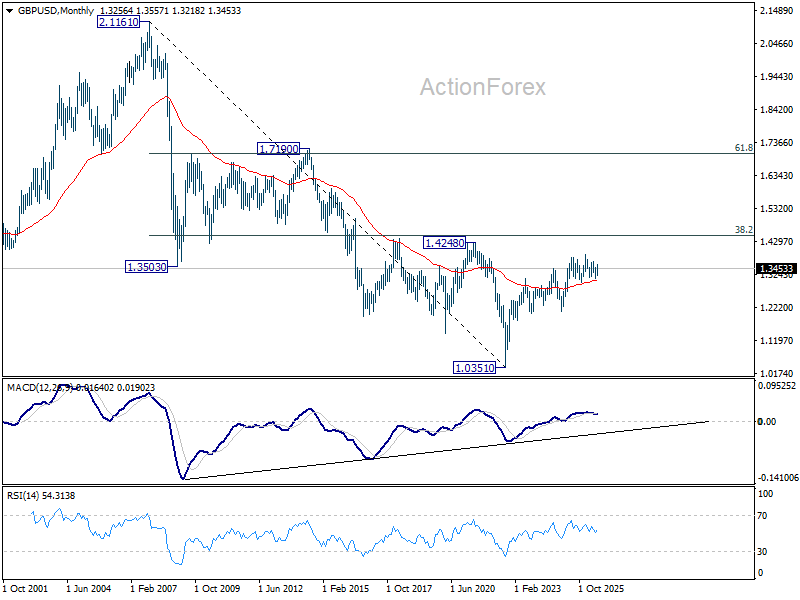
In the long term picture, as long as 1.4248/4480 resistance zone holds (38.2% retracement of 2.1161 to 1.0351 at 1.4480), the long term outlook will remain bearish. That is, price actions from 1.0351 are seen as a corrective pattern to down trend from 2.1161 (2007 high) only. Nevertheless, decisive break of 1.4248/4480 will be a strong sign of long term bullish reversal.
USD/CHF Weekly Outlook
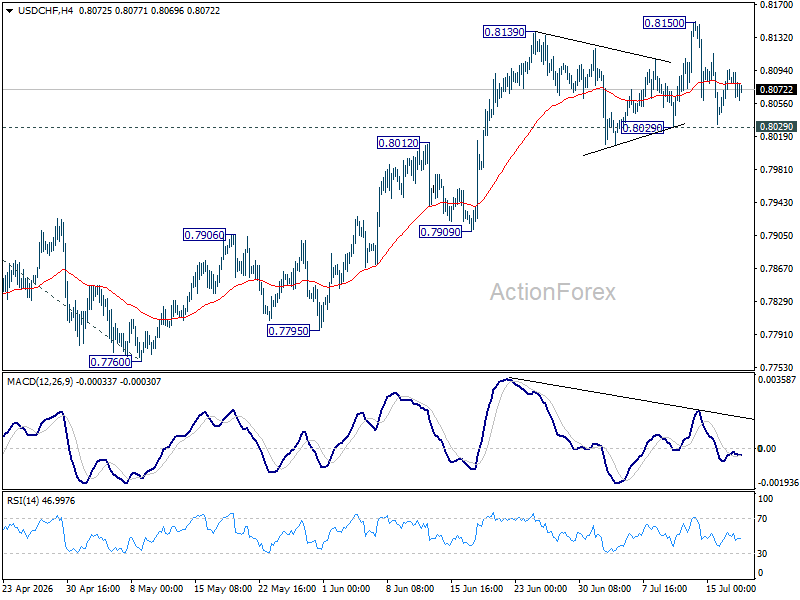
USD/CHF edged higher to 0.8150 last week but quickly retreated. Initial bias remains neutral this week for more consolidations. Further rally is in favor a long as 0.8029 support holds. Above 0.8150 will target 100% projection 0.7603 to 0.8041 from 0.7600 at 0.8198 next. However, firm break of 0.8029 will turn bias back to the downside for 55 DEMA (now at 0.7991) and below.
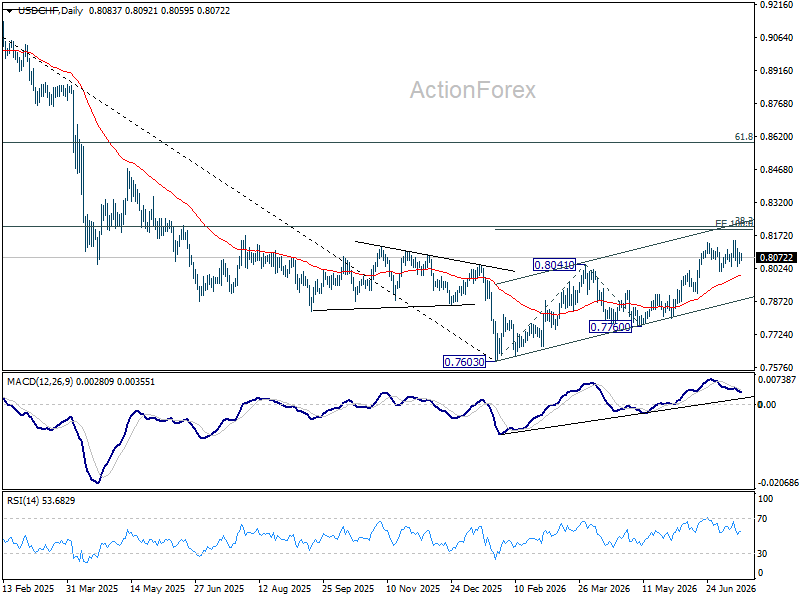
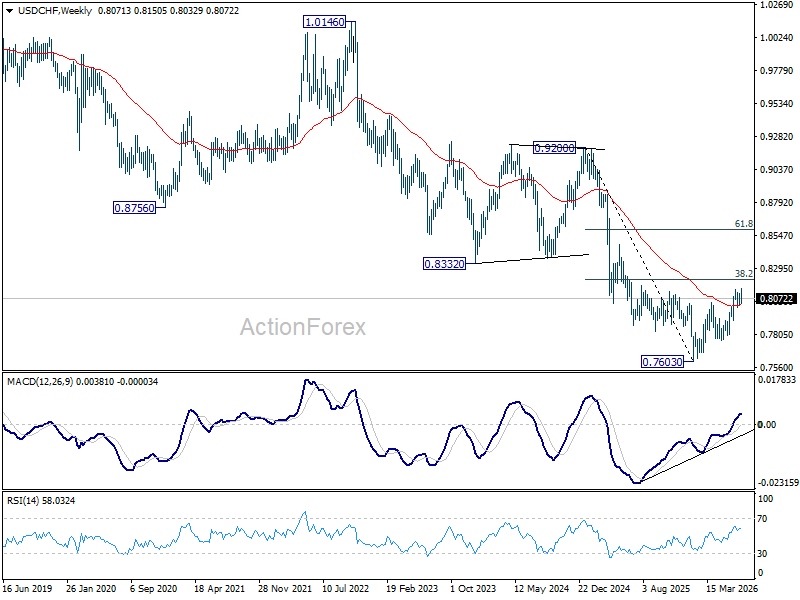
In the bigger picture, while a medium term bottom was formed at 0.7603, it's still early to call for bullish trend reversal. As long as 38.2% retracement of 0.9200 (2025 high) to 0.7603 at 0.8213 holds, the larger down trend could still continue through 0.7603 at a later stage. However, firm break of 0.7603 will argue that the trend has reversed and turn focus to 0.8332 support turned resistance (2023 low) for confirmation.
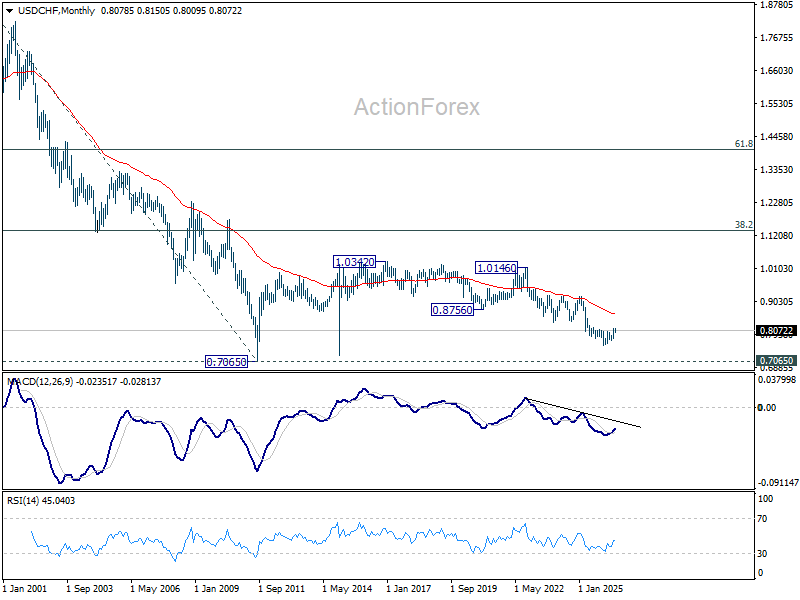
In the long term picture, price action from 0.7065 (2011 low) are seen as a corrective pattern to the multi-decade down trend from 1.8305 (2000 high). It's uncertain if the fall from 1.0342 is the second leg of the pattern, or resumption of the downtrend. But in either case, outlook will stay bearish as long as 0.8756 support turned resistance holds (2021 low). Retest of 0.7065 should be seen next.
AUD/USD Weekly Report
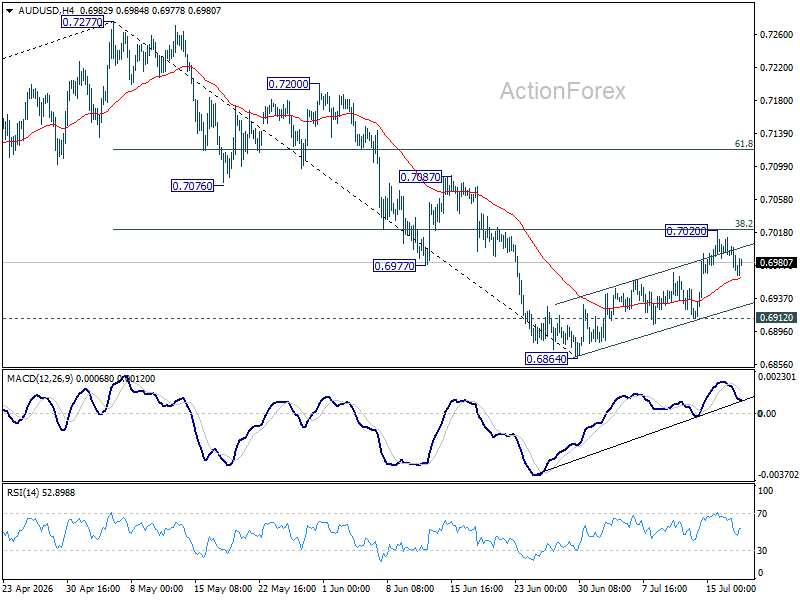
AUD/USD's extended rebound stalled after hitting 55 D EMA (now at 0.7014), just ahead of 38.2% retracement of 0.7277 to 0.6864 at 0.7022. Initial bias remains neutral first, and fall from 0.7277 is mildly in favor to continue. On the downside, below 0.6912 minor support will bring retest of 0.6864 low. However, sustained break of 0.7022 will bring stronger rally to 61.8% retracement at 0.7119 next.
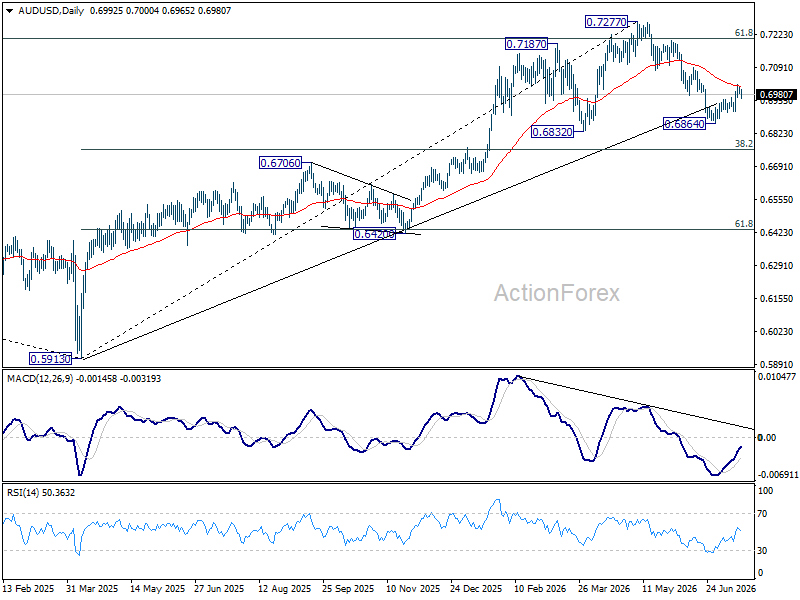
In the bigger picture, considering bearish divergence condition in D MACD, a medium term top could be formed at 0.7277 after failing to sustain above 61.8% retracement of 0.8006 (2021 high) to 0.5913 (2024 low) at 0.7206. Deeper fall could be seen to 38.2% retracement of 0.5913 to 0.7277 at 0.6756 as a correction. But strong support should be seen there to bring rebound. Consolidations would continue below 0.7277 for a while.
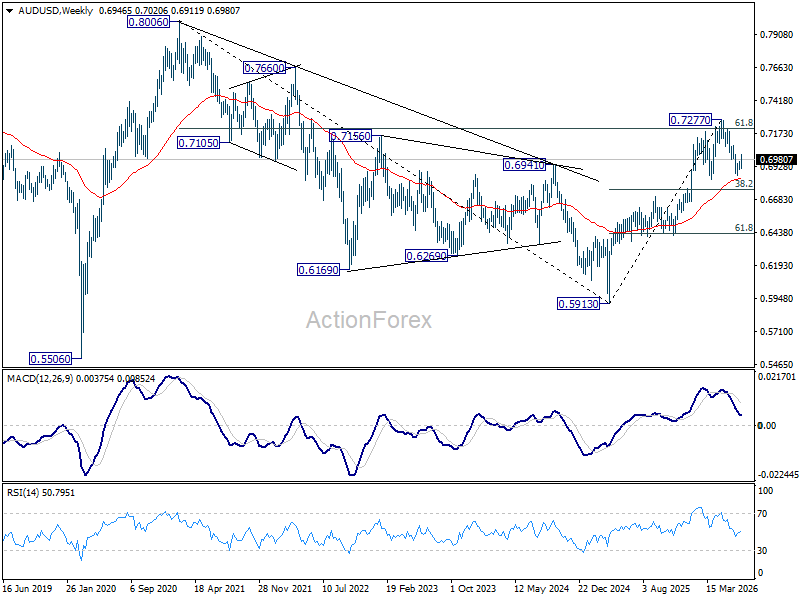
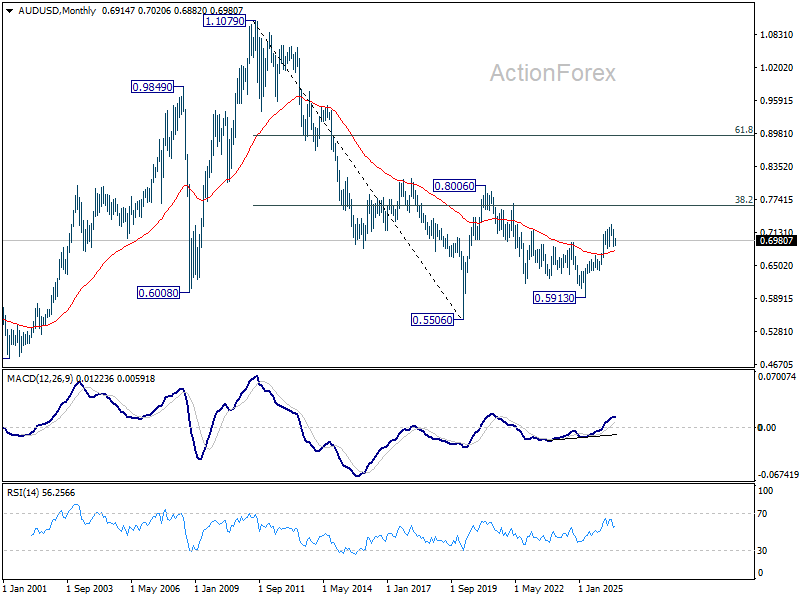
In the long term picture, rise from 0.5913 is seen as the third leg of the whole pattern from 0.5506 (2020 low). It's still early to judge if this is an impulsive or corrective pattern. But in either case, further rise should be seen back to 0.8006 and possibly above. This will remain the favored case as long as 55 W EMA (now at 0.6843) holds.
USD/CAD Weekly Outlook
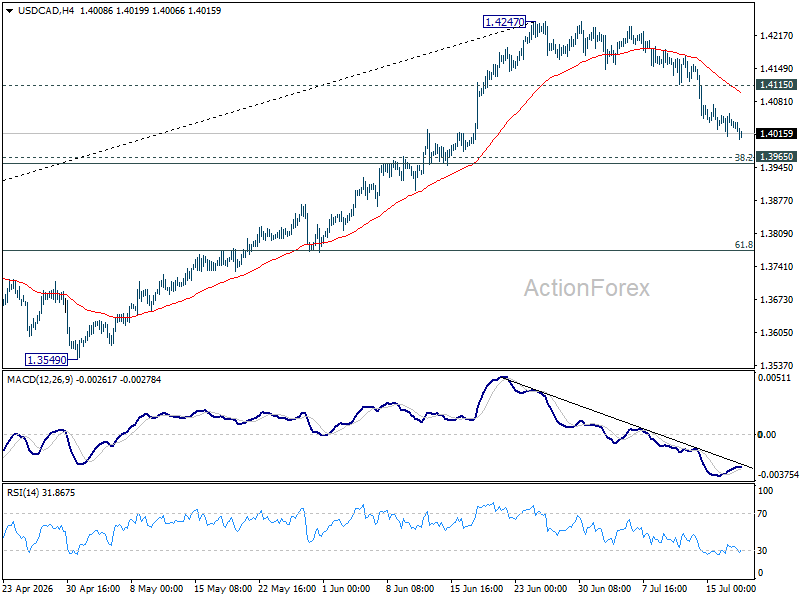
USD/CAD's pullback from 1.4247 accelerated lower last week but overall outlook is unchanged. It's seen as correcting the rise from 1.3480 only. Downside should be contained by 1.3965 cluster support (38.2% retracement of 1.3480 to 1.4247 at 1.3954 to bring rebound. On the upside, above 1.4159 minor resistance will bring retest of 1.4247 high. Firm break there will target 61.8% retracement of 1.4791 to 1.3480 at 1.4290.
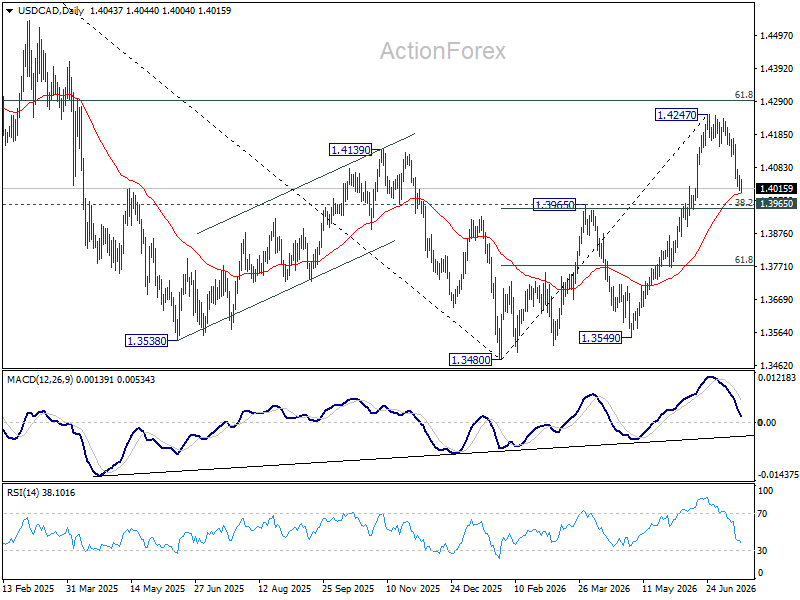
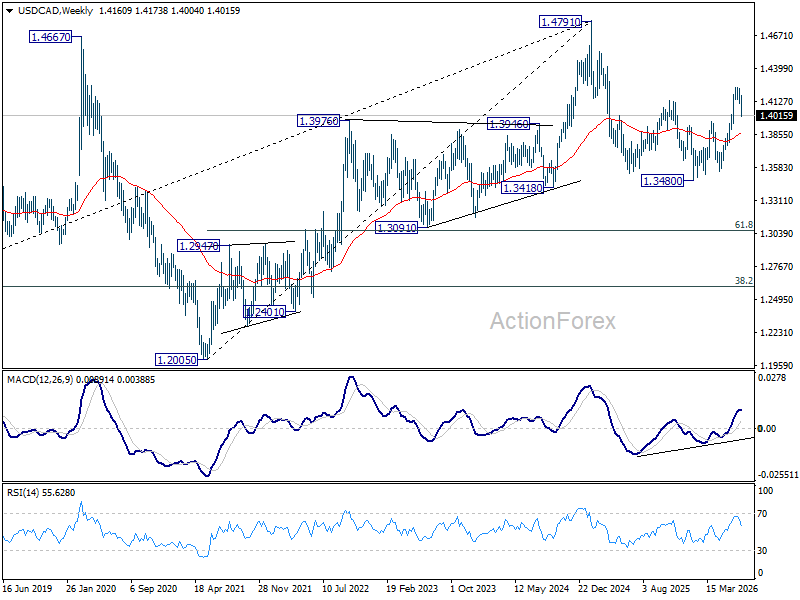
In the bigger picture, current development suggests that fall from 1.4791 has completed as a three wave correction to 1.3480. It's still early to judge if rise from there a corrective bounce, or resumption of the larger up trend from 1.2005 (2021 low). But in either case, retest of 1.4791 high should be seen next.
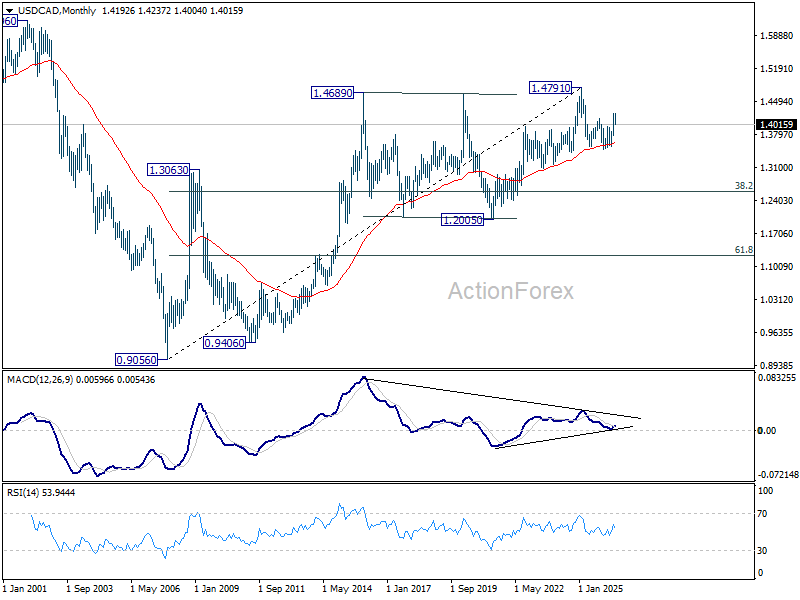
In the long term picture, rising 55 M EMA (now at 1.3631) remains intact. Thus, up trend from 0.9056 (2007 low) could still be in progress. However, considering bearish divergence condition M MACD, sustained trading below 55 M EMA will argue that the up trend has completed with five waves up to 1.4791, and turn medium term outlook bearish for correction to 38.2% retracement of 0.9056 to 1.4791 at 1.2600.
GBP/JPY Weekly Outlook
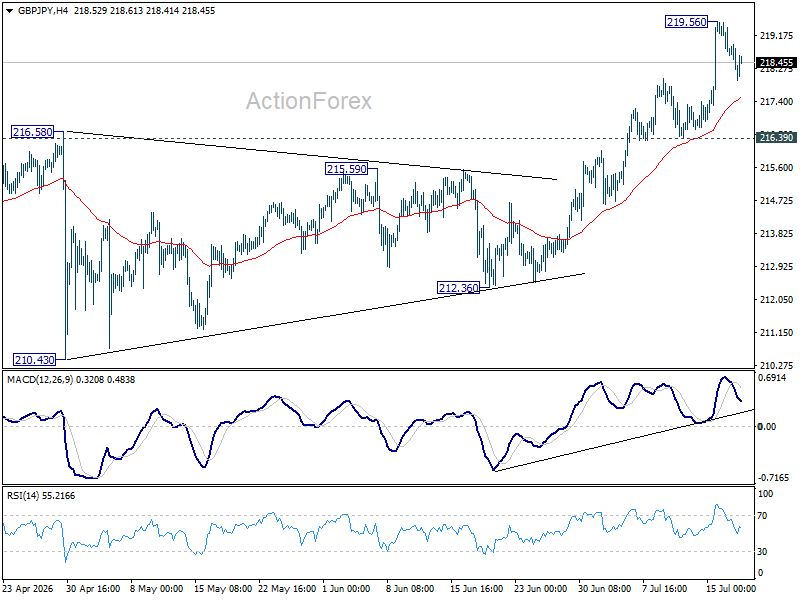
GBP/JPY's up trend continued last week and edged higher to 219.56. But as a temporary top was formed there with subsequent retreat, initial bias remains neutral this week first. Downside of consolidations should be contained by 216.39. Above 219.56 will target 220.90 fibonacci projection level next.
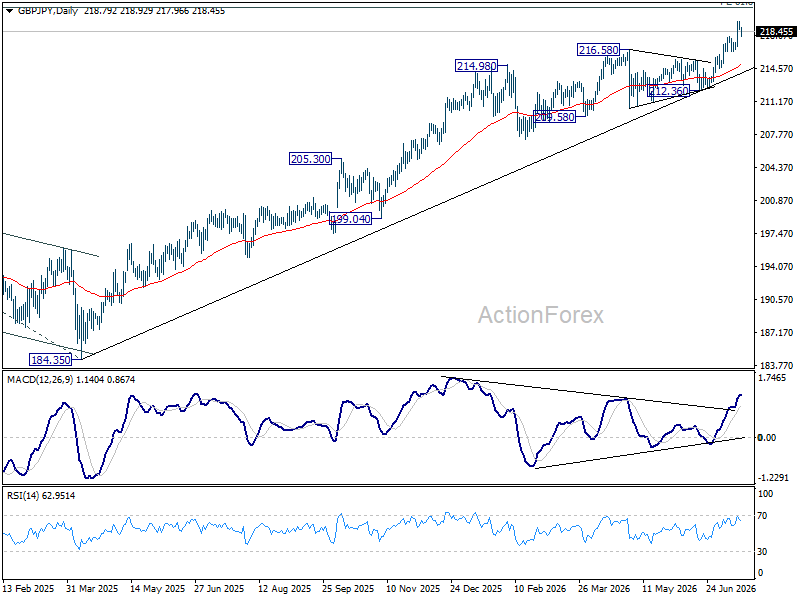
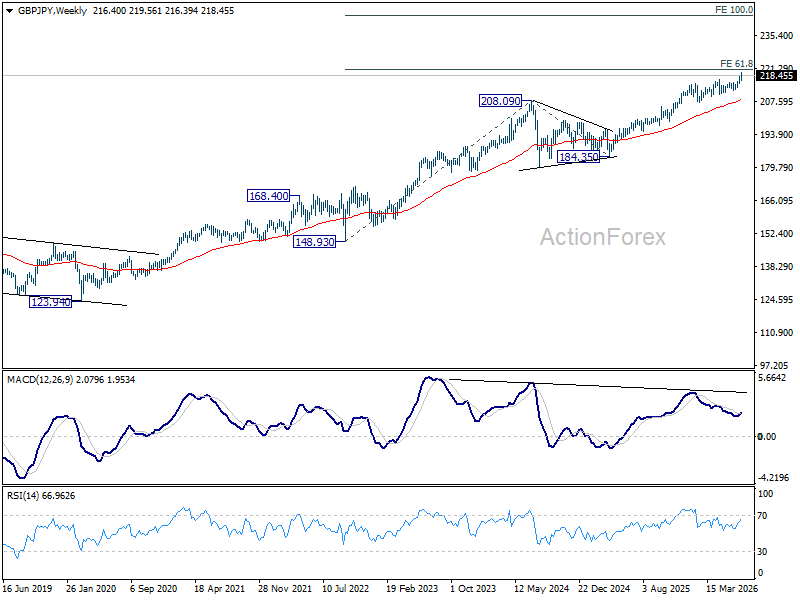
In the bigger picture, the long term up trend is in progress. Next target is 61.8% projection of 148.93 (2022 low) to 208.09 (2024 high) from 184.35 at 220.90. For now, outlook will remain bullish as long as 55 W EMA (now at 208.27) holds, in case of pullback.
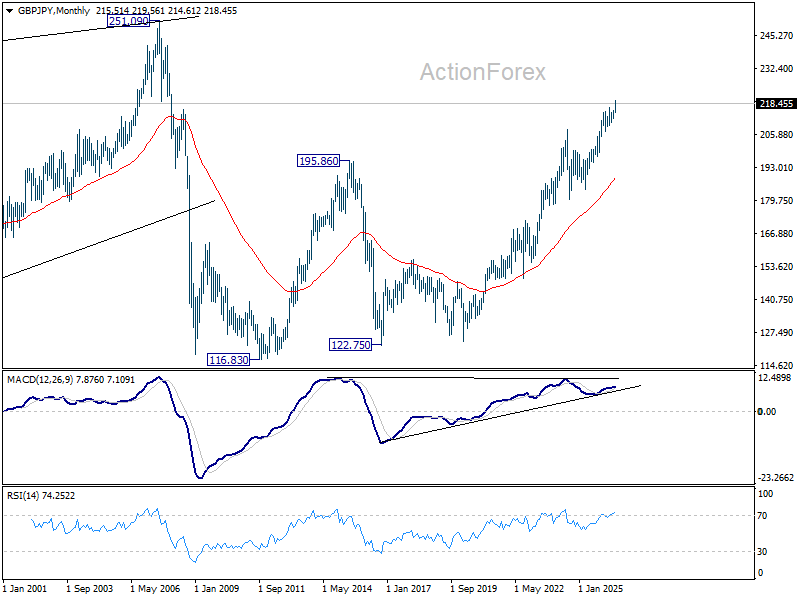
In the long term picture, up trend from 116.83 (2011 low) is in progress. Next target is 251.09 (2007 high). This will remain the favored case as long as 55 M EMA (now at 188.96) holds.
EUR/JPY Weekly Outlook
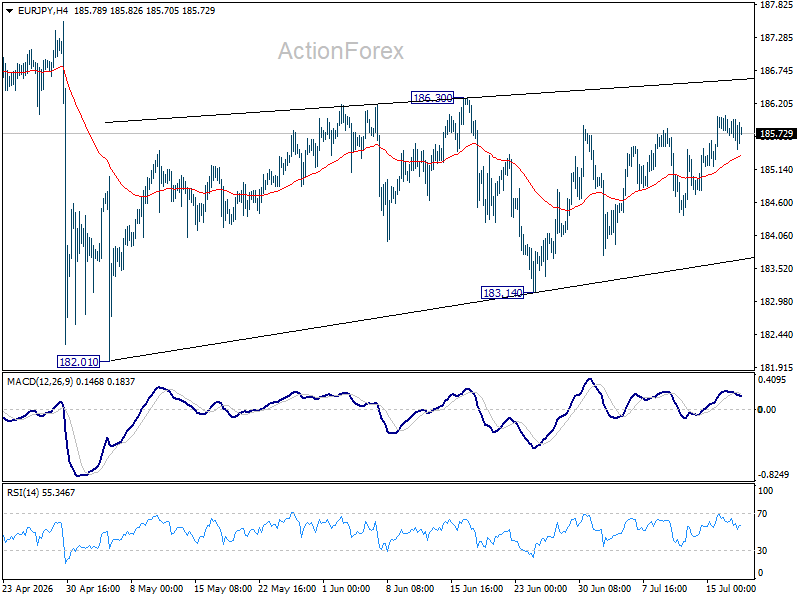
EIUR/JPY is still bounded in range trading and outlook is unchanged. Initial bias remains neutral this week. While the price actions from 182.10 are looking corrective, stronger rebound cannot be ruled out. On the upside, firm break of 186.30 will resume the rebound from 182.10 towards 187.93 high. On the downside, break of 183.14 will bring deeper fall to retest 182.10.
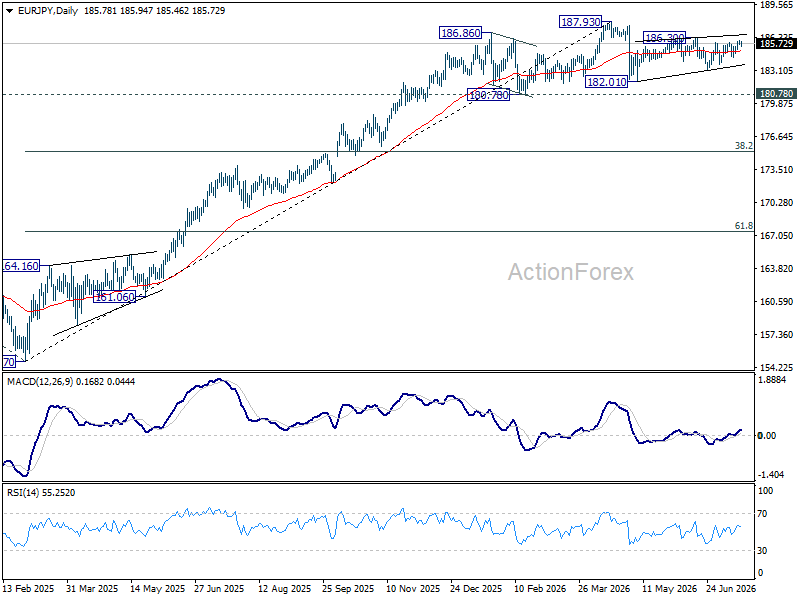
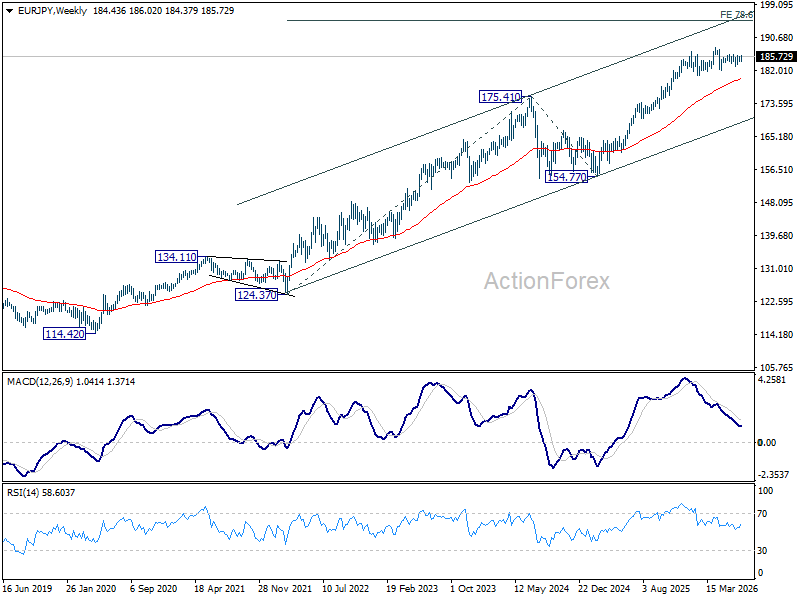
In the bigger picture, uptrend from 114.42 (2020 low) is still expected to resume at a later stage to 78.6% projection of 124.37 (2022 low) to 175.41 (2025 high) from 154.77 at 194.88. However, sustained break of 55 W EMA (now at 179.76) will argue that it's already in a medium term down trend to 175.41 resistance turned support and below.
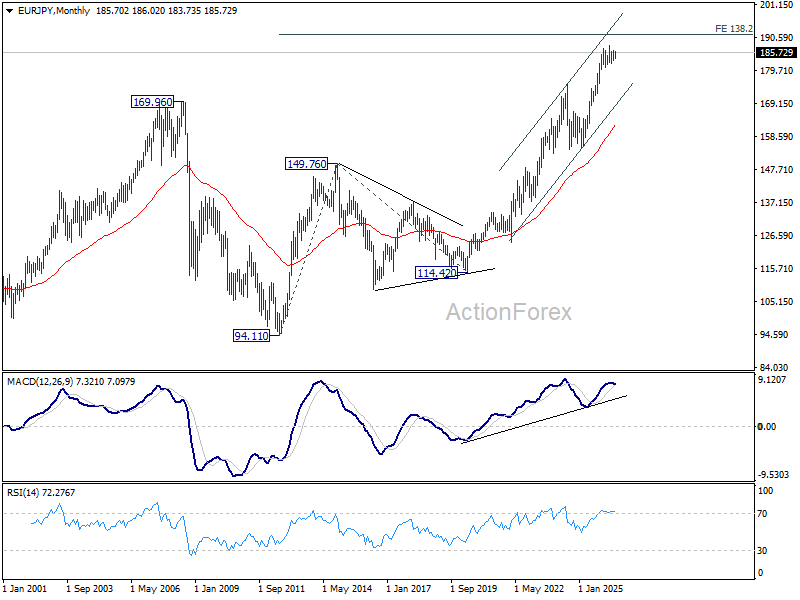
In the long term picture, up trend from 94.11 (2021 low) is in progress. Next target is 138.2% projection of 94.11 to 149.76 (2014 high) from 114.42 (2020 low) at 191.32. This will remain the favored case as long 55 W EMA holds.
EUR/GBP Weekly Outlook
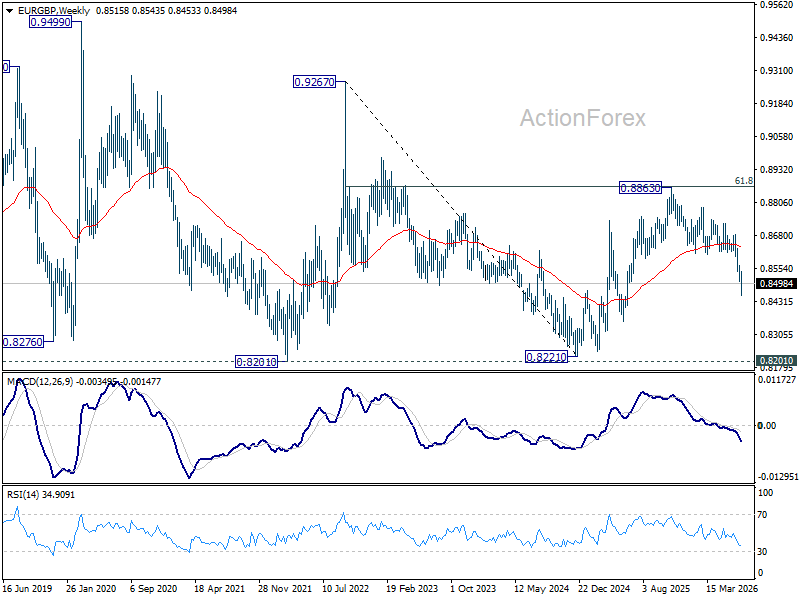
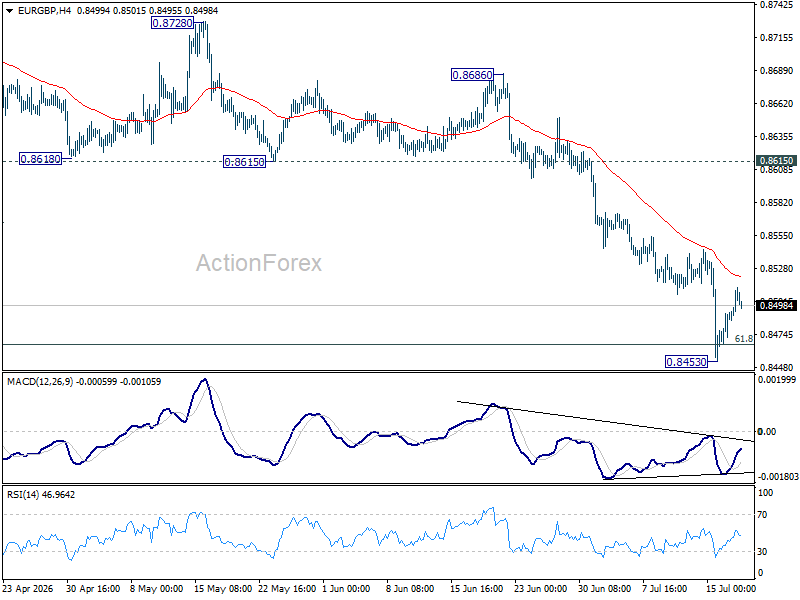
EUR/GBP decline accelerated to as low as 0.8453 last week and met 61.8% retracement of 0.8221 to 0.8863 at 0.8466. But as a temporary low was formed with subsequent recovery, initial bias remains neutral this week first. Upside should be limited below 0.8615 support turned resistance. Firm break of 0.8453 will target a retest on 0.8221 low.
In the bigger picture, current development suggests that rise from 0.8221 (2024 low) has completed at 0.8863, just ahead of 38.2% retracement of 0.8221 (2024 low) to 0.8863 (2025 high) at 0.8618. Deeper fall would be seen back to 0.8221 (2022 low). For now, outlook will be neutral at best as long as 0.8863 hold.
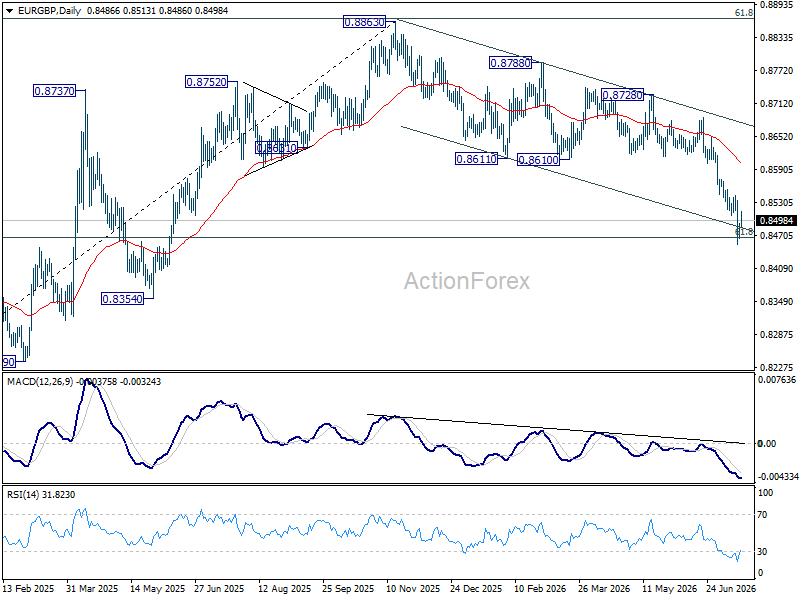
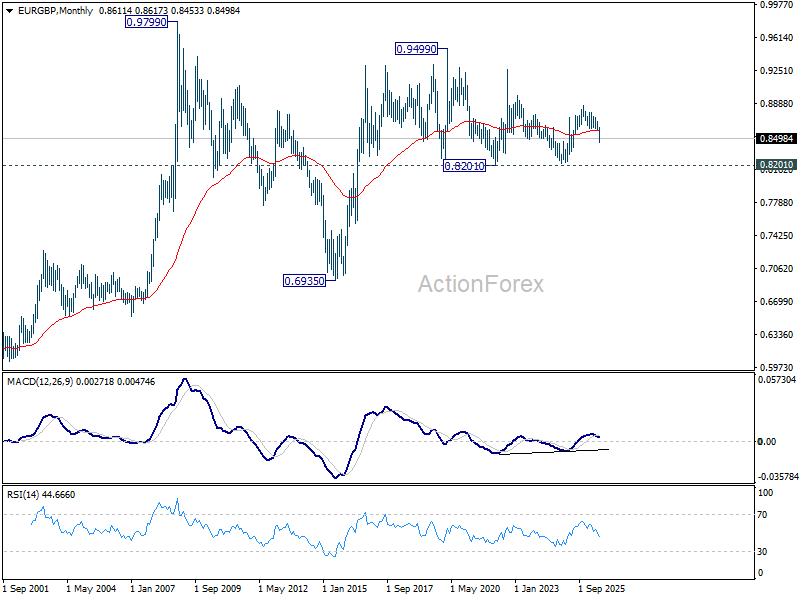
In the long term picture, price action from 0.9499 (2020 high) is seen as part of the long term range pattern from 0.9799 (2008 high). Range trading should continue between 0.8201 and 0.9499, until there is clear signal of imminent breakout.