Sample Category Title
EUR/USD Hits a Wall—Can Bulls Break Through?
Key Highlights
- EUR/USD started a recovery wave above the 1.1550 resistance.
- A major bearish trend line is forming with resistance at 1.1595 on the 4-hour chart.
- Bitcoin started a recovery wave above $64,000.
- Gold corrected some losses and traded above $4,300.
EUR/USD Technical Analysis
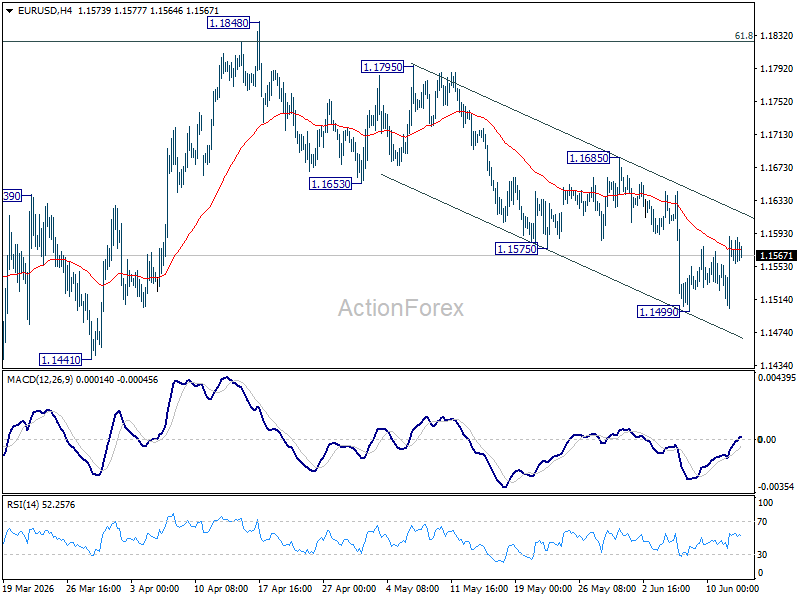
The Euro found support near 1.1500 against the US Dollar. EUR/USD started a recovery wave above 1.1520 and 1.1550.
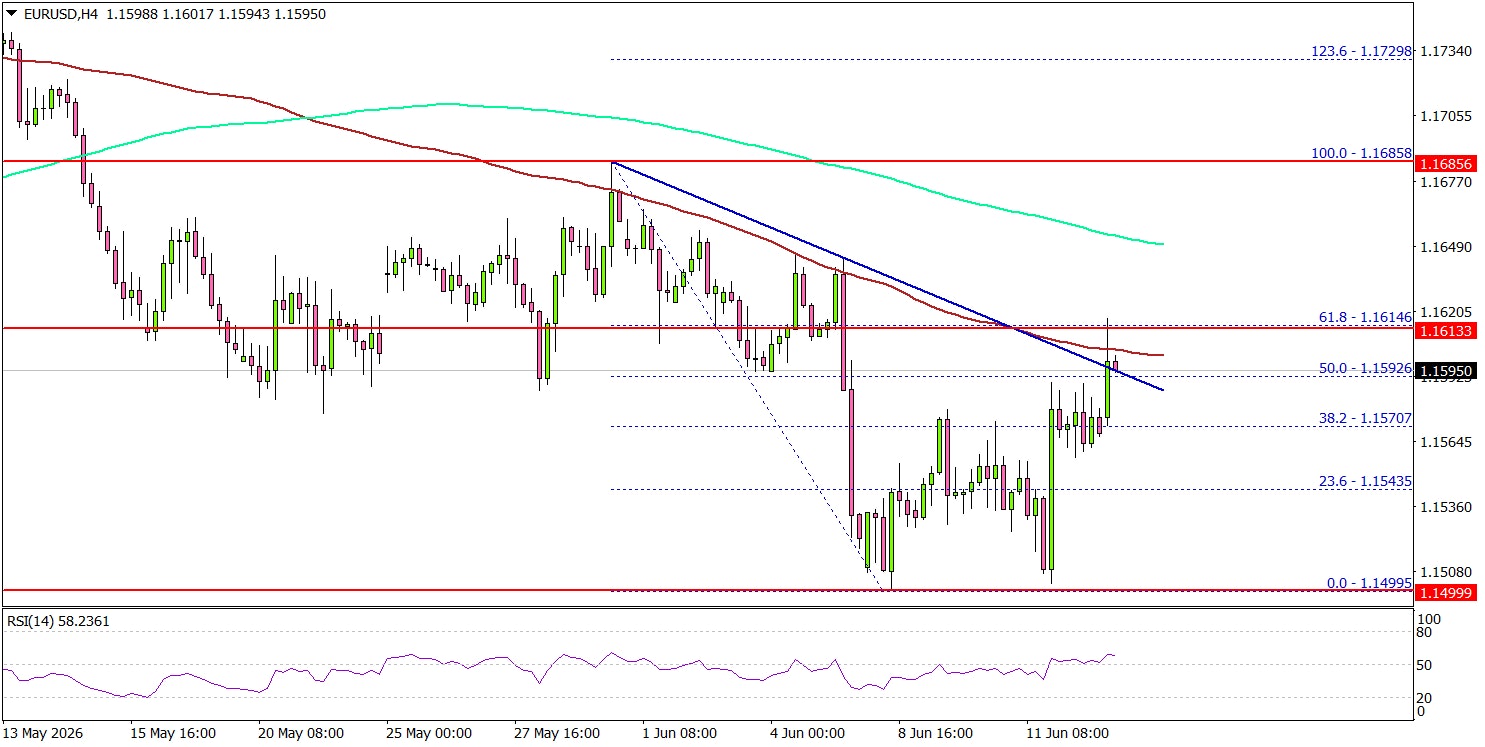
Looking at the 4-hour chart, the pair traded above the 50% Fib retracement level of the downward move from the 1.1685 swing high to the 1.1499 swing low. The pair is now attempting to close above a major bearish trend line with resistance at 1.1595.
On the upside, an immediate resistance could be 1.1600 and the 100 simple moving average (red, 4-hour). The next major resistance might be 1.1615 and the 61.8% Fib retracement level of the downward move from the 1.1685 swing high to the 1.1499 swing low.
A close above 1.1615 could open doors for gains. The main hurdle for the bulls could be 1.1650 and the 200 simple moving average (green, 4-hour). If there is a close above 1.1650, the pair could rise toward the 1.1720 level.
If there is another decline, the pair might find bids near the 1.1550 level. The first major support might be near 1.1500. A close below 1.1500 could open the doors for a larger decline toward 1.1440. Any more losses might set the pace for a test of 1.1420.
Looking at Gold, the bulls came into action, and they were able to start a recovery wave above the $4,250 resistance.
Upcoming Key Economic Events:
- ECB's Nagel speech.
- ECB's President Lagarde speech.
- ECB's Cipollone speech.
New Zealand BNZ PSI Falls to 47.5 as Weak Consumer Spending Deepens Services Slump
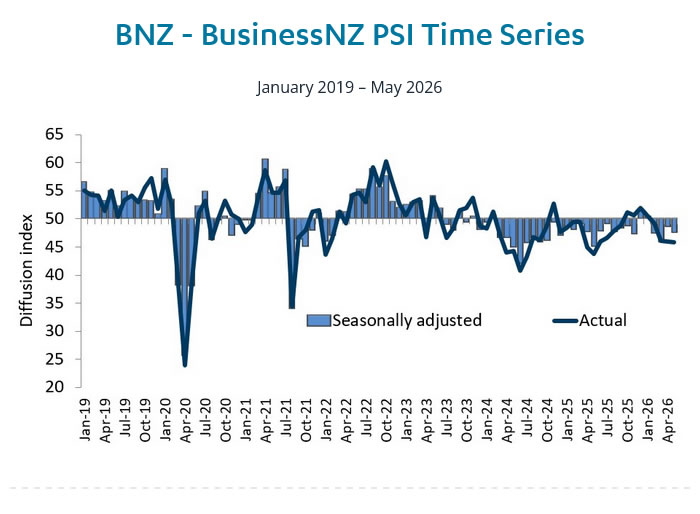
New Zealand's services sector slipped deeper into contraction in May, with the BNZ-BusinessNZ Performance of Services Index falling from 48.7 to 47.5. The latest reading marked another month below the 50-point threshold that separates expansion from contraction, reinforcing signs that domestic demand remains subdued despite broader hopes of economic recovery.
The weakness was led by a sharp deterioration in activity and sales, which dropped from 48.5 to 44.7, while new orders/business fell from 50.9 to 47.6. Employment edged up marginally from 48.5 to 48.6 but remained in contractionary territory. Stocks/inventories eased from 47.6 to 47.5, while supplier deliveries improved from 46.8 to 49.5, suggesting firms may be able to respond quickly should demand eventually recover.
BusinessNZ Chief Executive Katherine Rich said sectors reliant on discretionary spending, including cafes, restaurants and recreational services, were among the weakest performers as consumers remained cautious about spending. More than two-thirds of respondents reported negative business conditions, citing rising costs—particularly fuel—and weak demand linked to poor consumer confidence. BNZ Senior Economist Doug Steel said the PSI continues to oscillate in contraction territory, indicating a services sector that is still struggling to regain its footing.
| Indicator | Apr 2026 | May 2026 | Change |
|---|---|---|---|
| BNZ-BusinessNZ PSI | 48.7 | 47.5 | -1.2 pts |
| Activity/Sales | 48.5 | 44.7 | -3.8 pts |
| Employment | 48.5 | 48.6 | +0.1 pts |
| New Orders/Business | 50.9 | 47.6 | -3.3 pts |
| Stocks/Inventories | 47.6 | 47.5 | -0.1 pts |
| Supplier Deliveries | 46.8 | 49.5 | +2.7 pts |
Spacex Ipo Lifts Sentiment Ahead of Central Bank Meetings
The impact of the previous week’s strong U.S. employment data did not continue for long. Markets started to focus on new events and the outlook ahead. The SpaceX IPO was the biggest IPO ever and became a major focus. Trading started on Friday, and the stock closed 19% higher. This helped reduce fears that such a large IPO could hurt the market. U.S. and Japanese equities both ended the week higher.
USD/JPY continued to move higher as U.S. inflation stayed strong. CPI rose 4.2% year over year, in line with expectations, but it was the highest reading since April 2023. PPI rose 6.5% year over year, above expectations and the highest reading since November 2022. These numbers supported the U.S. dollar.
WTI crude oil prices fell as a possible agreement between Iran and the U.S. appeared to move closer. Gold touched yearly lows as the stronger U.S. dollar led to more selling. Bitcoin found some support after recent weakness. The University of Michigan Consumer Sentiment Index also improved as consumers welcomed lower gasoline prices.
Markets This Week
U.S. Stocks
It was an encouraging week for the Dow, with the index holding support at 50,000 and finishing the week strongly. However, the technical picture still suggests a sideways market, and with U.S. inflation remaining a concern, large short-term gains may be difficult. This could create good opportunities for short-term range traders. Resistance levels are at 51,500 and 52,000. Support is seen at 50,000, 49,500, 49,000, 48,500 and 48,000.
Japanese Stocks
Japanese stocks moved lower for most of the week, but followed U.S. stocks higher at the end of the week and closed near the weekly highs. However, the uptrend has weakened, with the 10-day moving average now pointing sideways. This could be a volatile week, as the expected rise in Japanese interest rates may lead to different views on the outlook for Japanese equities. Instead of looking for a clear trend, trading against large moves may be the better short-term approach. Resistance is seen at 68,000, 69,000 and 70,000, while support is at 64,000, 63,000, 62,000, 61,000, 60,000 and 59,000.
USD/JPY
USD/JPY tested higher for most of the week as stronger-than-expected U.S. inflation data supported the dollar. However, lower WTI crude oil prices and resistance near the April highs limited further upside, leaving the pair almost unchanged by the weekly close. This could be an important week, with both the BOJ and Fed meetings in focus. For swing traders, the better risk-reward opportunities may still come from selling weakness, while day traders may look to follow short-term trends around this week’s major news announcements. Resistance is at 160.50, 162.00 and 165.00, while support is seen at 159.00, 158.00, 157.00, 156.00, 155.50 and 155.00.
Gold
Selling in gold continued last week as the stronger U.S. dollar and expectations of possible U.S. interest rate hikes encouraged further downside. The market touched new lows for the year, but support held around $4,000, allowing prices to recover before the weekly close. However, the downtrend remains strong, so the outlook stays bearish while gold remains below the 10-day moving average. Resistance is at $4,300, $4,400, $4,500, $4,600 and $4,665, while support is at $4,000, $3,900, and $3,800.
Crude Oil
WTI crude oil fell to its lowest levels since April as Iran and the U.S. moved closer to a deal to end the war. There is still concern that an agreement may not be completed quickly, and it could take time for Middle East oil shipments to fully resume. However, the current trend remains bearish, so selling strength ahead of the 10-day moving average may be the better short-term strategy. Resistance is at $90, $95, $100, $105, $110 and $120, while support is at $80, $75, $70, and $67.50.
Bitcoin
Bitcoin had a quiet week as the market found support around $60,000 and traders waited for the next major move. The successful SpaceX IPO helped improve risk sentiment and encouraged some buying, pushing Bitcoin back above the 10-day moving average and breaking the strong downtrend. In the short term, range trading looks more likely than a clear trend. Resistance is at $65,000, $75,000, $80,000, $85,000, and $90,000, while support is at $60,000, $55,000 and $50,000.
This Week’s Focus
- Monday: E.U. Trade Balance and Industrial Production, U.S. Industrial Production
- Tuesday: China Industrial Production and Unemployment Rate, Japan BoJ Interest Rate Decision and BoJ Press Conference, Australia RBA Interest Rate Decision, E.U. ZEW Economic Sentiment, U.S. Housing Starts and Building Permits
- Wednesday: Japan Trade Balance, U.K. CPI and PPI Input, E.U. CPI, U.S. Retail Sales, Fed Interest Rate Decision and FOMC Press Conference
- Thursday: U.K. Unemployment Rate and BoE Interest Rate Decision, U.S. Philadelphia Fed Manufacturing Index
- Friday: Japan National Core CPI and Monetary Policy Meeting Minutes, U.K. Retail Sales
It could be a big week for markets, with four major central bank meetings in focus. The Fed is expected to keep interest rates unchanged, but traders will be watching the first meeting under the new Fed chairman closely for any change in tone. The Bank of Japan is widely expected to raise rates, which could increase volatility in USD/JPY as the pair remains close to levels where intervention risk may rise. The RBA and Bank of England are both expected to keep rates steady, but their comments on inflation and future policy will still be important.
The BOJ meeting may be the biggest focus for yen traders. A 25 basis point rate hike to 1.0% is widely expected, so the market reaction may depend more on what the BOJ says about future rate hikes. With the yen still weak and inflation pressure continuing, any hawkish comments could lead to sharp moves in JPY pairs.
SpaceX is also likely to remain volatile after its IPO and could influence broader risk appetite in equity markets. U.S. retail sales and Japanese inflation data will also be important this week, giving traders more clues about the strength of the U.S. economy and the outlook for BOJ policy.
Dow Jones Futures ($Ym_F) Elliott Wave: Trading Setup Explained
Hello traders. In this technical article we’re going to take a quick look at the Elliott Wave charts of Dow Jones Futures published in members area of the website.
As our members know, we have had many high-probability trading setups recently. YM_F is one of them.Dow Jones futures made a pullback that unfolded as an Elliott Wave Zig Zag pattern. Price completed a clear 3-wave move down from the June 5th peak and found support at the Equal Legs zone (Blue Box buying area).
In the following analysis, we explain the Elliott Wave pattern, the market outlook, and the trading setup.
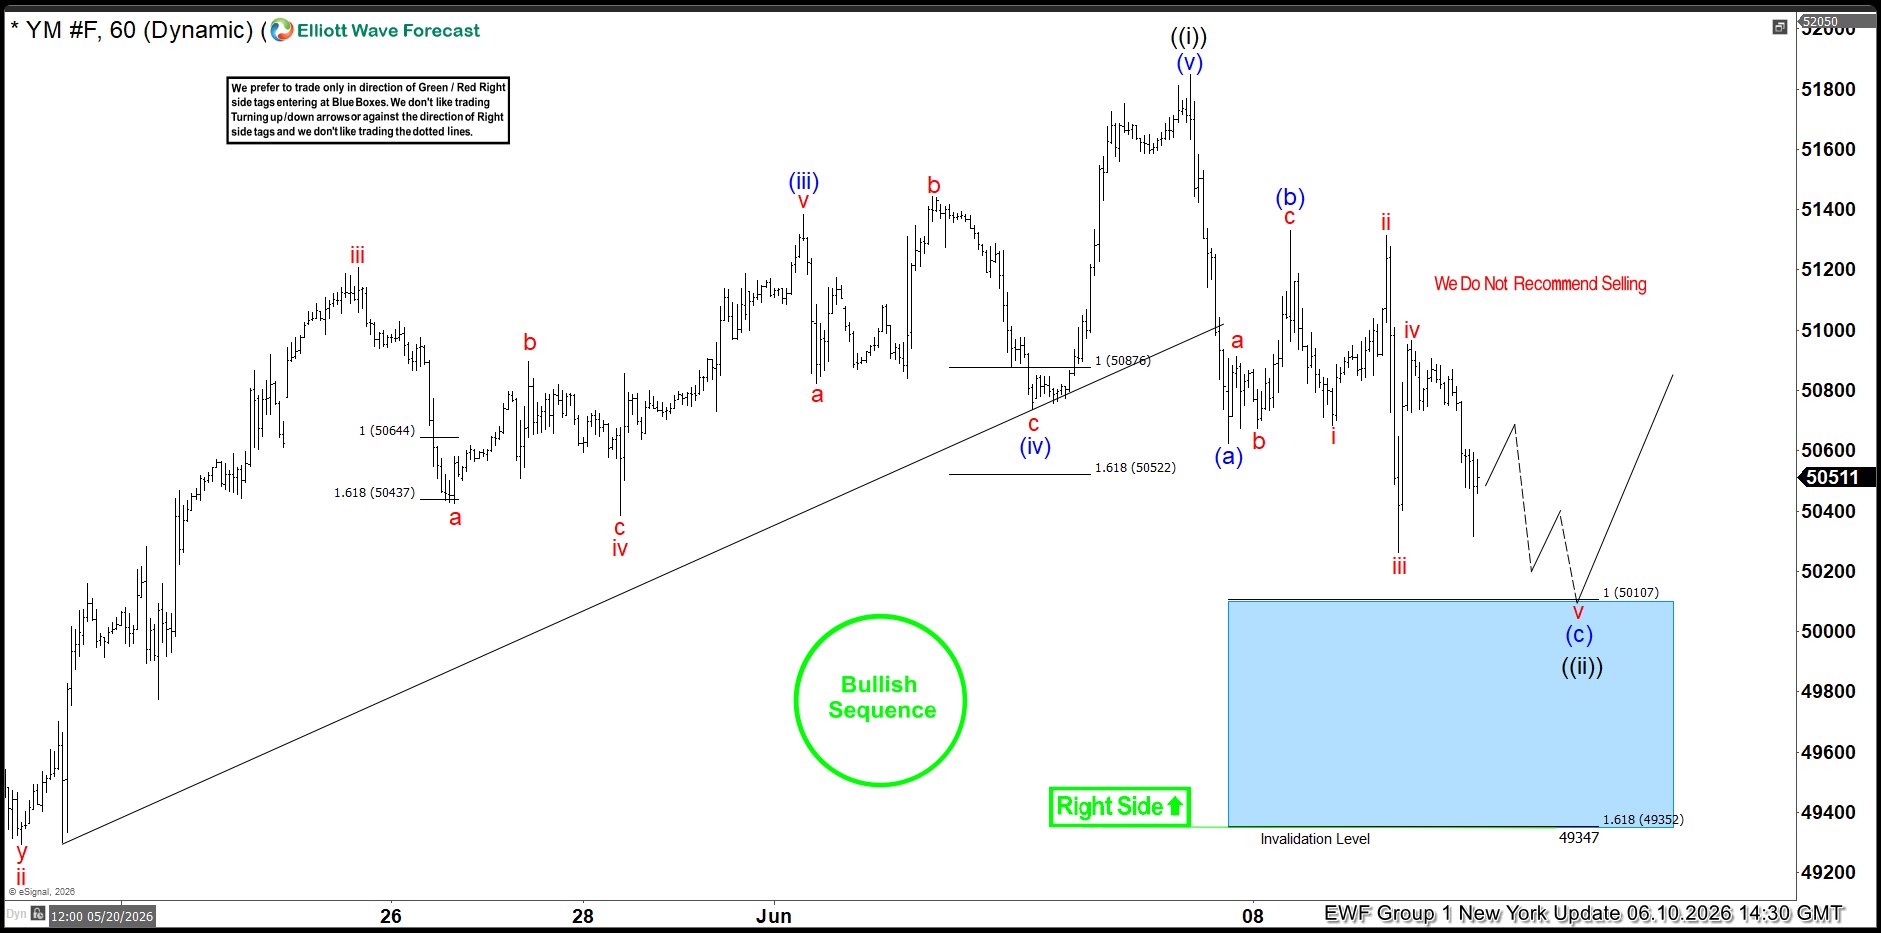
YM_F Elliott Wave 1 Hour Chart 06.10.2026
Dow Jones Futures (YM_F) shows a lower low structure from the peak, keeping the bearish sequence in place. The current price structure remains incomplete, which suggests more downside toward the 50107–49347 area. This zone is our Blue Box buying area. We do not recommend selling YM_F and prefer the long side from this zone.
Once price reaches the buying area, it can either rally to new highs or bounce in 3 waves. If the bounce reaches the 50% Fibonacci retracement against the (b) wave high, we will move stops to break-even and secure partial profits.
Our charts are easy to trade and understand:
Red bearish stamp+ blue box = Selling Setup
Green bullish stamp+ blue box = Buying Setup
Charts with Black stamps are not tradable.
[Image download failed: original image removed]
Did you know ? 90% of traders fail because they don’t understand market patterns. Are you in the top 10%? Test yourself with this advanced Elliott Wave Test
Official trading strategy on How to trade 3, 7, or 11 swing and equal leg is explained in details in Educational Video, available for members viewing inside the membership area.
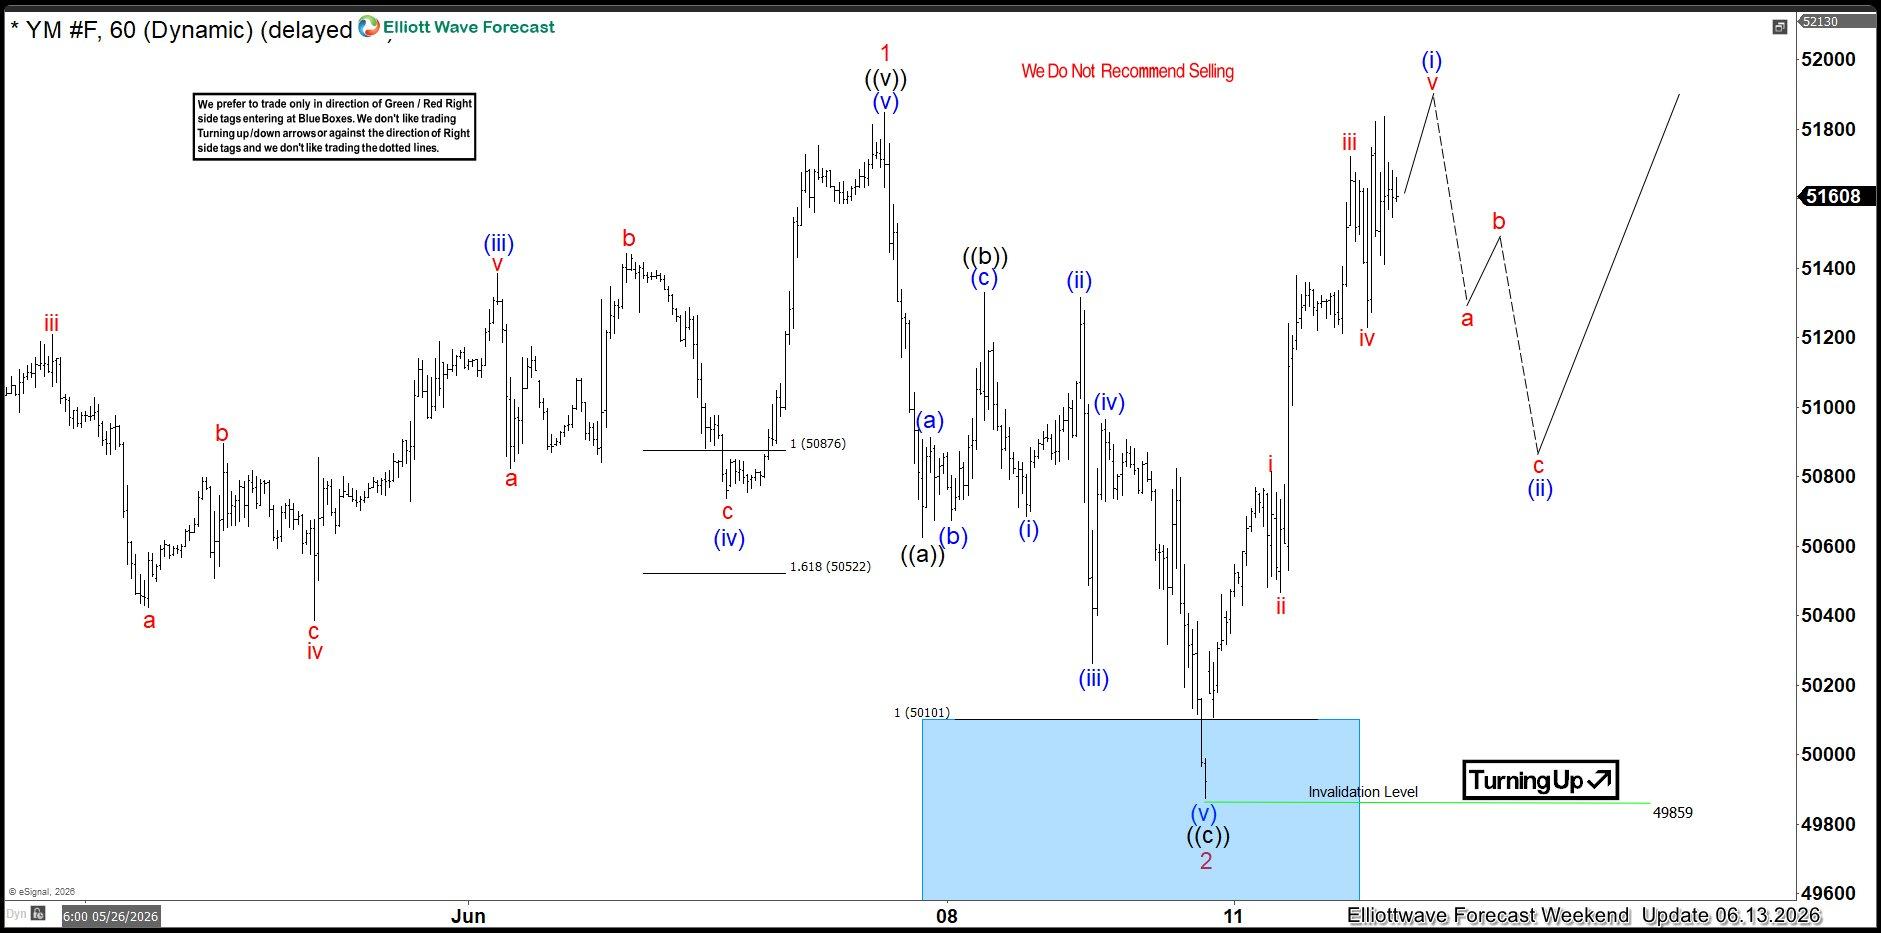
YM_F Elliott Wave 1 Hour Chart 06.13.2026
Dow Jones Futures (YM_F) extended into our buying zone at 50107–49347 as expected. Price found buyers at the Blue Box and is showing a strong reaction from that area. As a result, long positions from the Equal Legs zone should now be risk free.As long as price stays above the 49859 low, we expect further strength in Dow Jones, with potential for a move toward new highs.
Important note: Our analysis is not based on Elliott Wave in isolation. We perform detailed higher-time-frame cycle analysis, which shows an incomplete market structure. This is one of the key drivers of price action, along with correlation analysis and broader market context.
We also teach our members in live analysis sessions how to identify incomplete bullish and bearish sequences. Even a 14-day trial, is enough to noticeably improve your trading analysis and forecasting approach.
Crude Oil (Cl_F): High-Probability Sell Setup at the Blue Box Area
Hello fellow traders. In this technical article we’re going to take a quick look at the Elliott Wave charts of OIL Futures CL_F published in members area of the website.
As our members know, understanding how to identify incomplete sequences in Elliott Wave analysis is crucial as they are a key driver of market direction. In this case, crude oil (CL_F) shows an incomplete sequence from the 109.67 high, which keeps the downside pressure in place. Recently, oil price rallied into our Blue Box selling zone. Sellers reacted right at that area, and price started to decline as expected.
In the following analysis, we explain the Elliott Wave forecast, the current oil market outlook, and the trading strategy behind selling rallies from the Blue Box.
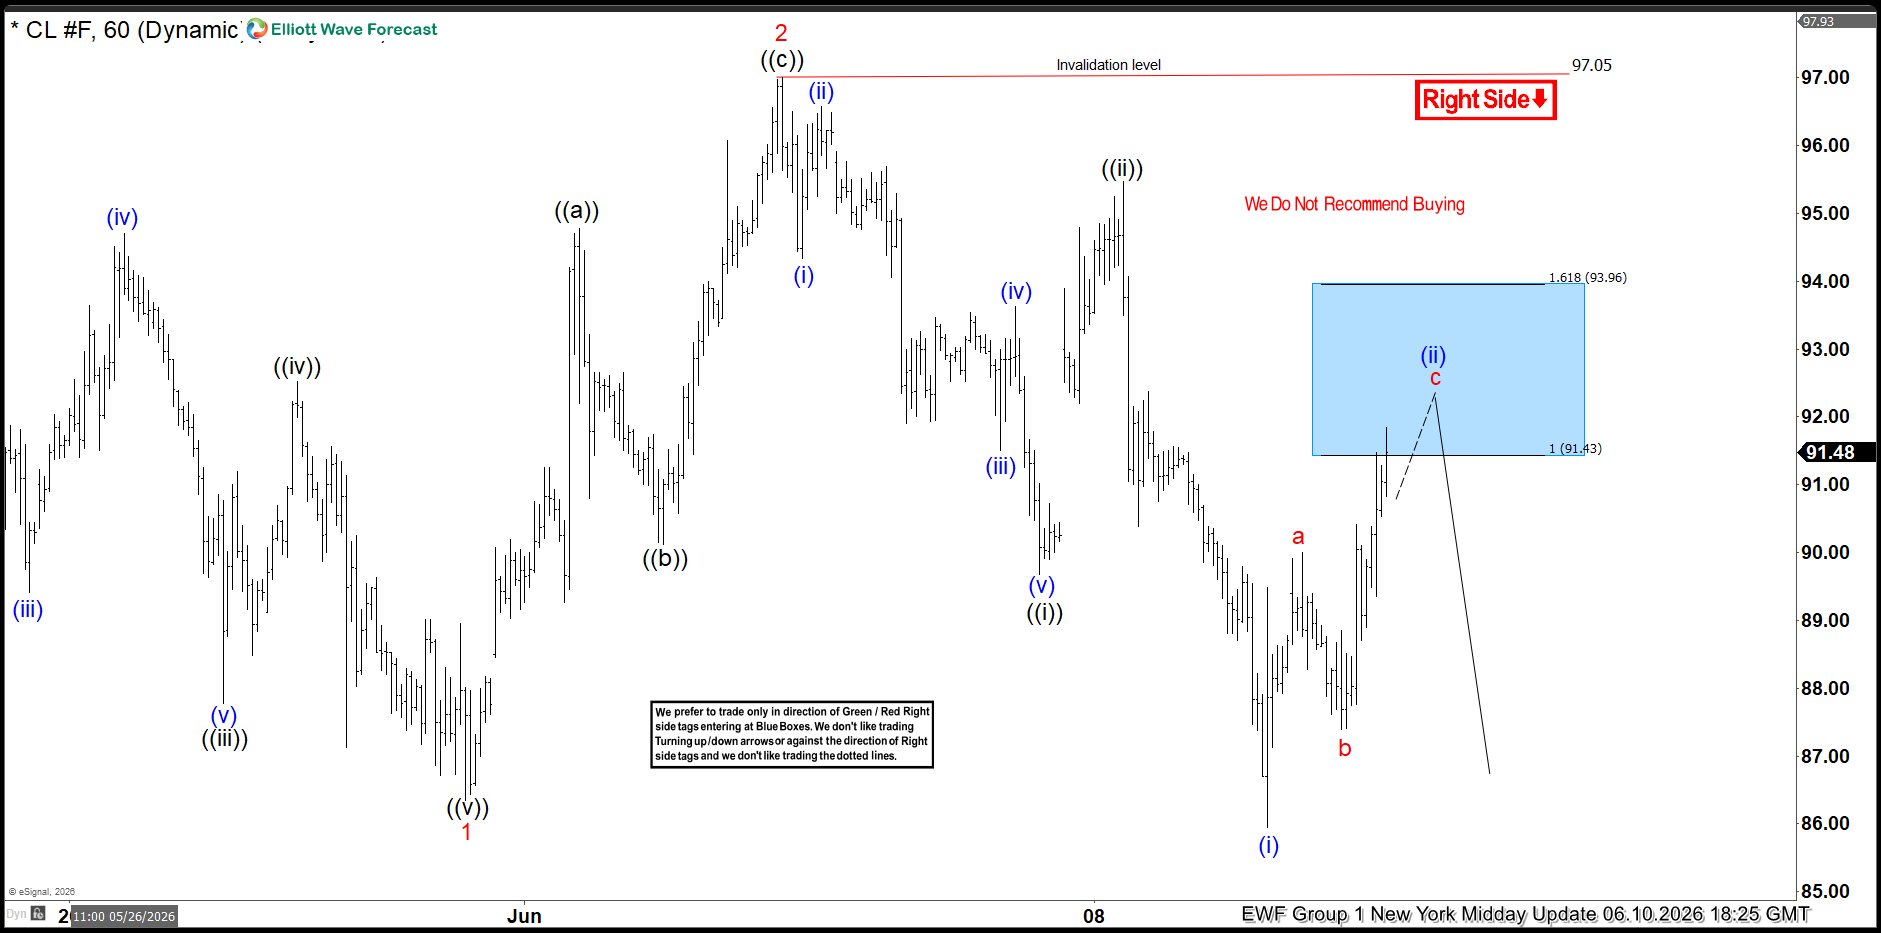
OIL Elliott Wave H1 Chart 06.10.2026
The commodity is giving us clear 3 waves correction , forming Elliott Wave Zig Zag Pattern. The price has already reached the extreme zone at 91.43-93.96 (Blue Box – sellers zone). We don’t recommend buying OIL and prefer the short side from the blue box zone. As the main trend is bearish, we expect to see at least 3 waves pullback from our selling zone. Once the decline reaches 50 Fibs against the b ( red) low, we will make the short position risk-free (put SL at BE) and take partial profits.
Quick reminder:
Our charts are easy to trade and understand:
Red bearish stamp+ blue box = Selling Setup
Green bullish stamp+ blue box = Buying Setup
Charts with Black stamps are not tradable.
[Image download failed: original image removed]
Did you know ? 90% of traders fail because they don’t understand market patterns. Are you in the top 10%? Test yourself with this advanced Elliott Wave Test
Official trading strategy on How to trade 3, 7, or 11 swing and equal leg is explained in details in Educational Video, available for members viewing inside the membership area.
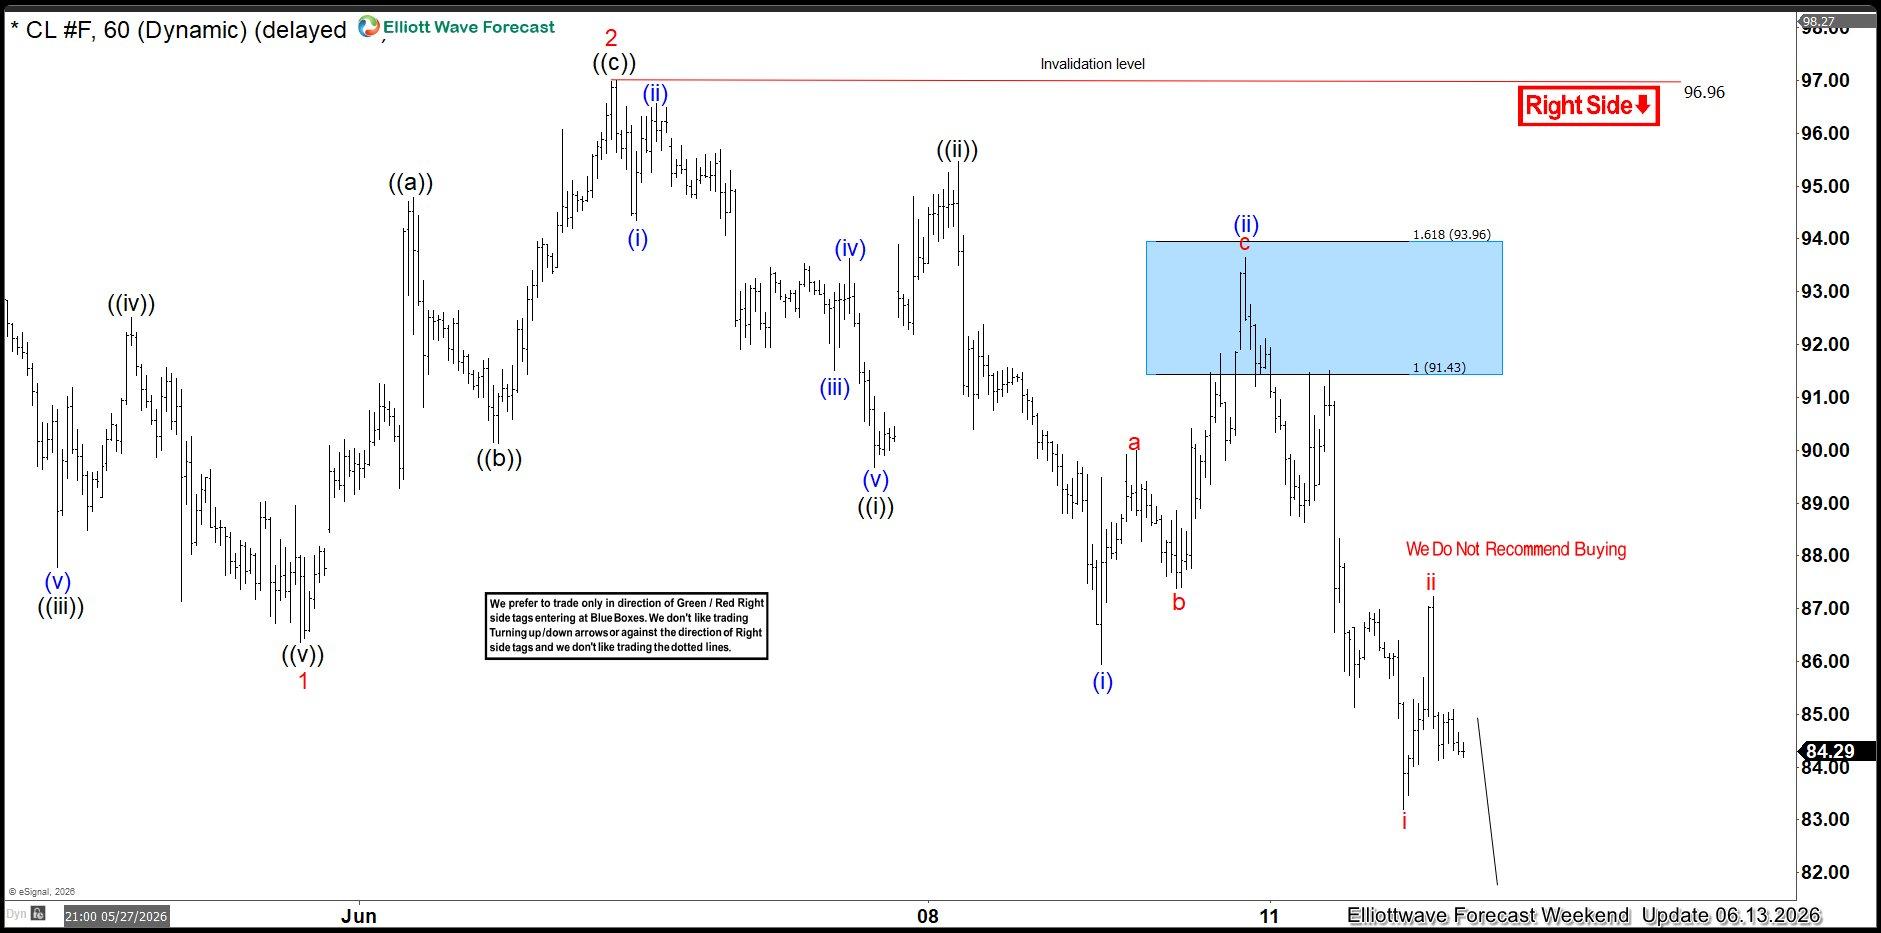
OIL Elliott Wave H1 Chart 06.13.2026
The commodity found sellers at the Blue Box area (91.43–93.96). Price reacted well from this selling zone and turned lower.
The decline pushed to new lows, confirming the bearish view. Members who took the short trade are now in profit and have secured risk-free positions.
Important note: Our analysis is not based on Elliott Wave in isolation. We perform detailed higher-time-frame cycle analysis, which shows an incomplete market structure. This is one of the key drivers of price action, along with correlation analysis and broader market context.
We also teach our members in live analysis sessions how to identify incomplete bullish and bearish sequences. Even a 14-day trial, is enough to noticeably improve your trading analysis and forecasting approach.
Keep in mind that market is dynamic and presented view could have changed in the mean time. You can check most recent charts with target levels in the membership area of the site. Best instruments to trade are those having incomplete bullish or bearish swings sequences. We put them in Sequence Report and best among them are shown in the Live Trading Room
Eco Data 6/15/26
| GMT | Ccy | Events | Act | Cons | Prev | Rev |
|---|---|---|---|---|---|---|
| 22:30 | NZD | Business NZ PSI May | 47.5 | 48.9 | 48.7 | |
| 04:30 | JPY | Tertiary Industry Index M/M Apr | 1.30% | 0.50% | -0.20% | -0.60% |
| 06:30 | CHF | Producer and Import Prices M/M May | -0.40% | 0.40% | 0.80% | |
| 06:30 | CHF | Producer and Import Prices Y/Y May | -1.80% | -2.00% | ||
| 09:00 | EUR | Eurozone Trade Balance (EUR) Apr | 1.3B | 7.8B | 3.5B | 0.6B |
| 09:00 | EUR | Eurozone Industrial Production M/M Apr | 0.10% | 0.20% | 0.20% | 0.40% |
| 12:15 | CAD | Housing Starts Y/Y May | 261K | 255K | 279K | |
| 12:30 | CAD | Manufacturing Sales M/M Apr | 4.20% | 4.60% | 3.00% | 3.40% |
| 12:30 | CAD | Wholesale Sales M/M Apr | 0.60% | 0.10% | 1.90% | 1.60% |
| 12:30 | USD | Empire State Manufacturing Jun | 5.7 | 13.2 | 19.6 | |
| 13:15 | USD | Industrial Production M/M May | 0.10% | 0.20% | 0.70% | |
| 13:15 | USD | Capacity Utilization May | 76.20% | 76.20% | 76.10% | |
| 14:00 | USD | NAHB Housing Market Index Jun | 35 | 37 | 37 |
| 22:30 | NZD |
| Business NZ PSI May | |
| Actual | 47.5 |
| Consensus | |
| Previous | 48.9 |
| Revised | 48.7 |
| 04:30 | JPY |
| Tertiary Industry Index M/M Apr | |
| Actual | 1.30% |
| Consensus | 0.50% |
| Previous | -0.20% |
| Revised | -0.60% |
| 06:30 | CHF |
| Producer and Import Prices M/M May | |
| Actual | -0.40% |
| Consensus | 0.40% |
| Previous | 0.80% |
| 06:30 | CHF |
| Producer and Import Prices Y/Y May | |
| Actual | -1.80% |
| Consensus | |
| Previous | -2.00% |
| 09:00 | EUR |
| Eurozone Trade Balance (EUR) Apr | |
| Actual | 1.3B |
| Consensus | 7.8B |
| Previous | 3.5B |
| Revised | 0.6B |
| 09:00 | EUR |
| Eurozone Industrial Production M/M Apr | |
| Actual | 0.10% |
| Consensus | 0.20% |
| Previous | 0.20% |
| Revised | 0.40% |
| 12:15 | CAD |
| Housing Starts Y/Y May | |
| Actual | 261K |
| Consensus | 255K |
| Previous | 279K |
| 12:30 | CAD |
| Manufacturing Sales M/M Apr | |
| Actual | 4.20% |
| Consensus | 4.60% |
| Previous | 3.00% |
| Revised | 3.40% |
| 12:30 | CAD |
| Wholesale Sales M/M Apr | |
| Actual | 0.60% |
| Consensus | 0.10% |
| Previous | 1.90% |
| Revised | 1.60% |
| 12:30 | USD |
| Empire State Manufacturing Jun | |
| Actual | 5.7 |
| Consensus | 13.2 |
| Previous | 19.6 |
| 13:15 | USD |
| Industrial Production M/M May | |
| Actual | 0.10% |
| Consensus | 0.20% |
| Previous | 0.70% |
| 13:15 | USD |
| Capacity Utilization May | |
| Actual | 76.20% |
| Consensus | 76.20% |
| Previous | 76.10% |
| 14:00 | USD |
| NAHB Housing Market Index Jun | |
| Actual | 35 |
| Consensus | 37 |
| Previous | 37 |
Peace Is Near, But Inflation Is Already Here: Markets Shift Focus From Iran to Fed Risks
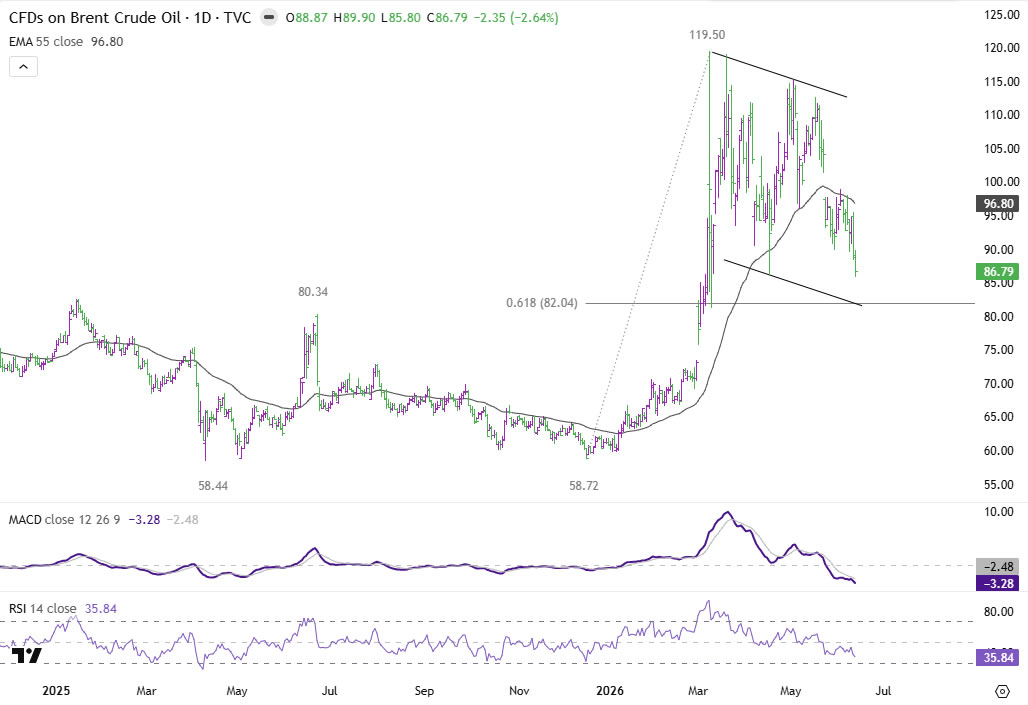
For the first time since the US-Iran conflict erupted in late February, financial markets can plausibly see a genuine path toward peace. Reports throughout the week indicated that the United States and Iran are closer than at any point since hostilities began to signing the Islamabad Memorandum of Understanding, a framework that would pause fighting, reopen the Strait of Hormuz and allow Iranian oil exports to resume. Oil traders responded decisively. Brent crude plunged from above $98 earlier in the week to $86 by Friday as geopolitical risk premium evaporated.
The relief was felt across global markets. US stocks staged a powerful rebound after appearing headed for another week of heavy losses, while safe-haven demand faded and Dollar weakened against most major currencies. Yet the reaction outside oil markets was noticeably restrained. Major US equity indexes remained well below the record highs posted earlier in the month. Dollar held comfortably above the previous week's lows against all major peers. Meanwhile, US 10-year Treasury yield stayed anchored near the 4.5% mark despite the sharp decline in crude prices.
That divergence reveals what investors are really focused on now. The market is no longer asking whether the conflict will end. Instead, it is beginning to assess the economic consequences of more than three months of elevated energy prices, disrupted supply chains and rising inflation pressures. While peace in the Middle East would remove an important source of uncertainty, it cannot undo the inflation shock that has already worked its way into producer prices, consumer prices and central bank thinking. The war risk premium may be disappearing, but the inflation premium is proving far more persistent.
Peace Is Near: Why Oil Suddenly Collapsed
The biggest move of the week was not in stocks, bonds or currencies. It was in oil. Brent crude plunged from above $98 to below $86 as traders aggressively dismantled the geopolitical risk premium that had accumulated over more than three months of conflict. The speed of the decline reflected a dramatic reassessment of the probability of a diplomatic breakthrough between the United States and Iran. For the first time since the war began, markets are treating peace as the base case rather than merely a possibility.
At the center of the optimism is the proposed Islamabad Memorandum of Understanding. According to officials and media reports from both sides, negotiators have largely agreed on a framework that would establish a 60-day cooling-off period while postponing the most difficult disputes, including Iran's nuclear program and frozen financial assets, to future negotiations. Pakistani Prime Minister Shehbaz Sharif, who has played a key mediating role, announced that an agreed text has been reached, while Iranian Foreign Minister Abbas Araghchi said a deal "has never been closer." US officials have reportedly assessed that negotiations are roughly 80% to 85% complete.
The framework carries significant implications for global energy markets because it directly addresses the Strait of Hormuz, the world's most important oil shipping route. Under the reported terms, Iran would halt hostilities, clear naval mines deployed during the conflict and restore shipping volumes to pre-war levels within 30 days. In exchange, the United States would remove the naval blockade imposed on Iranian ports and allow Iranian oil exports to return to global markets. Together, these measures would dramatically reduce concerns over supply disruptions and effectively reverse some of the most inflationary consequences of the conflict.
Of course, the agreement is not signed yet, and negotiations remain vulnerable to last-minute setbacks. But markets are increasingly behaving as though a deal will eventually emerge. The collapse in oil prices reflects a growing belief that the worst-case scenario for global energy supplies is fading. The focus is no longer on whether Hormuz will remain closed. It is on how quickly normal shipping and oil flows can be restored once a deal is finalized.
Technically, near-term bearishness in Brent crude is increasing after prices were rejected by the falling 55 D EMA (now at 96.80). As long as the 55 D EMA caps upside attempts, further decline is favored toward 61.8% retracement of 58.72 to 119.50 at 82.04. Notably, this level also coincides with the lower boundary of the medium-term falling channel that has guided price action since March, making it a key test zone for the current downtrend.
Selling momentum could begin to slow around the 82 area as even under a signed US-Iran agreement, the physical normalization of oil flows through the Strait of Hormuz will be gradual rather than immediate. Nevertheless, a decisive break below 82.04 would suggest traders are looking beyond diplomatic promises and beginning to price actual supply normalization.
Markets Cheer, But Not Wholeheartedly
The progress toward a US-Iran agreement sparked a powerful relief rally in the stock markets, but investors stopped well short of embracing a full risk-on narrative. Beneath the surface, markets were noticeably more cautious than the moves in oil prices might suggest. Major US stock indexes remained well below the record highs reached earlier this month.
The reason is straightforward. Investors understand that reopening Hormuz and restoring Iranian oil exports may prevent extending the inflation shock, but it cannot erase the damage already done. The global economy has spent more than three months dealing with elevated energy costs, disrupted shipping routes and rising input prices.
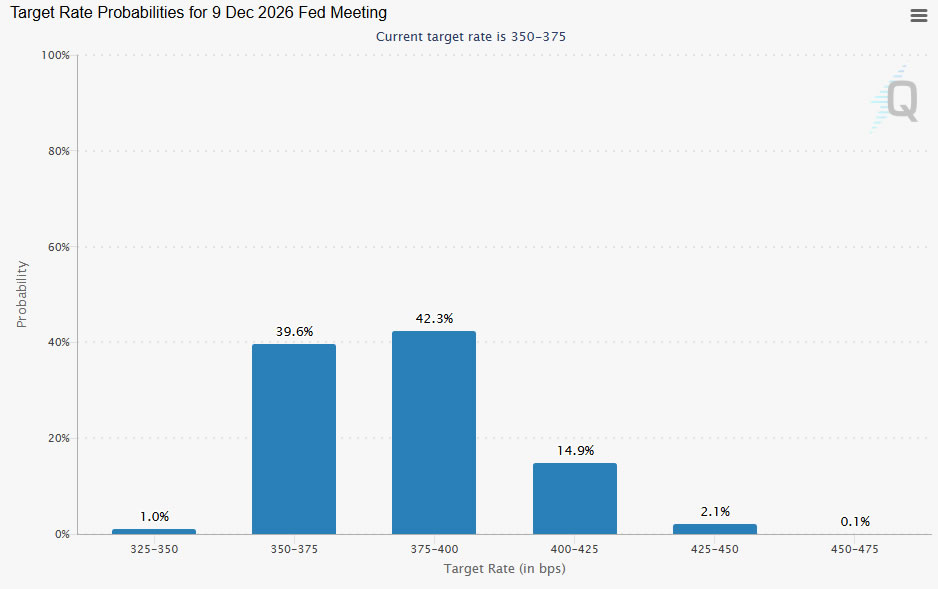
This week's US inflation data reinforced that reality. Headline CPI accelerated to a three-year high of 4.2%, while producer prices climbed 6.5% yoy, highest since 2022. That inflation backdrop is keeping Fed risks alive. Fed funds futures are pricing in around a 60% chance of another rate hike by year-end, reflecting concerns that the central bank may need to respond if inflation proves more persistent than expected. The prospect of tighter monetary policy is likely to limit valuation expansion and prevent equities from fully embracing the peace narrative.
In other words, even if the geopolitical situation improves significantly, investors still need to contend with the possibility of higher-for-longer interest rates.
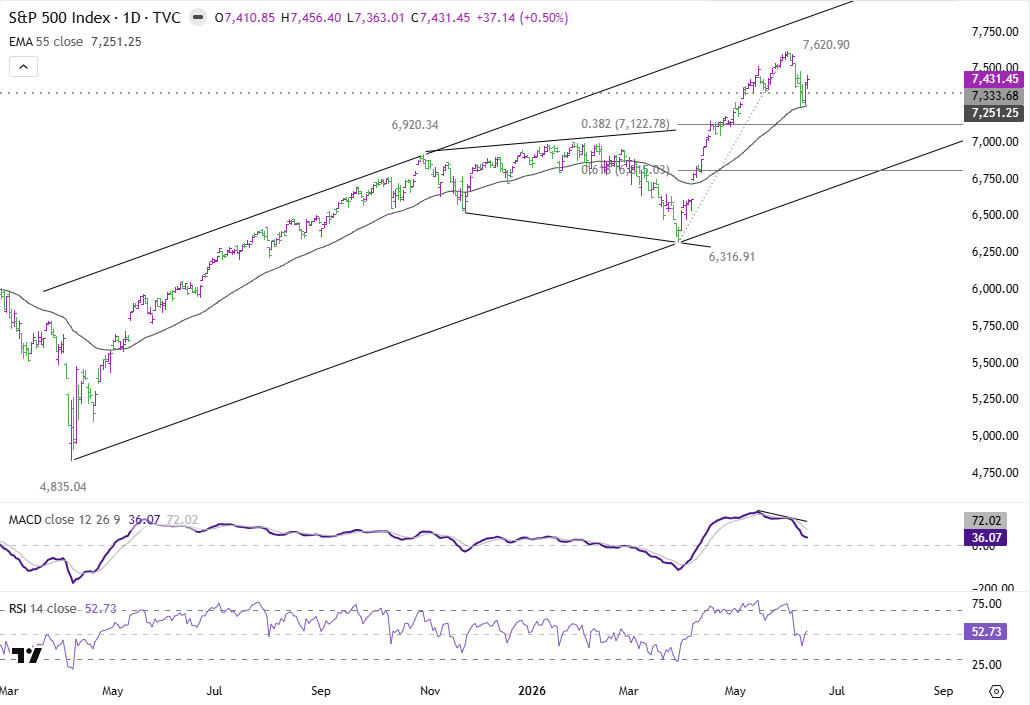
For S&P 500, the technical outlook has become more cautious. The break of 7,333.68 support suggests that the rally from 6,316.91 has already completed at 7,620.90, with bearish divergence visible on daily MACD. Initial support emerged from 55 D EMA (now at 7,251.25), helping stabilize the pullback.
However, any rebound is likely to remain capped by the 7,620.90 record high. Another decline toward 38.2% retracement of 6,316.91 to 7,620.90 at 7,122.78 is expected as the correction extends, with risk of a deeper correction toward 61.8% retracement at 6,815.03 if inflation and Fed concerns intensify.
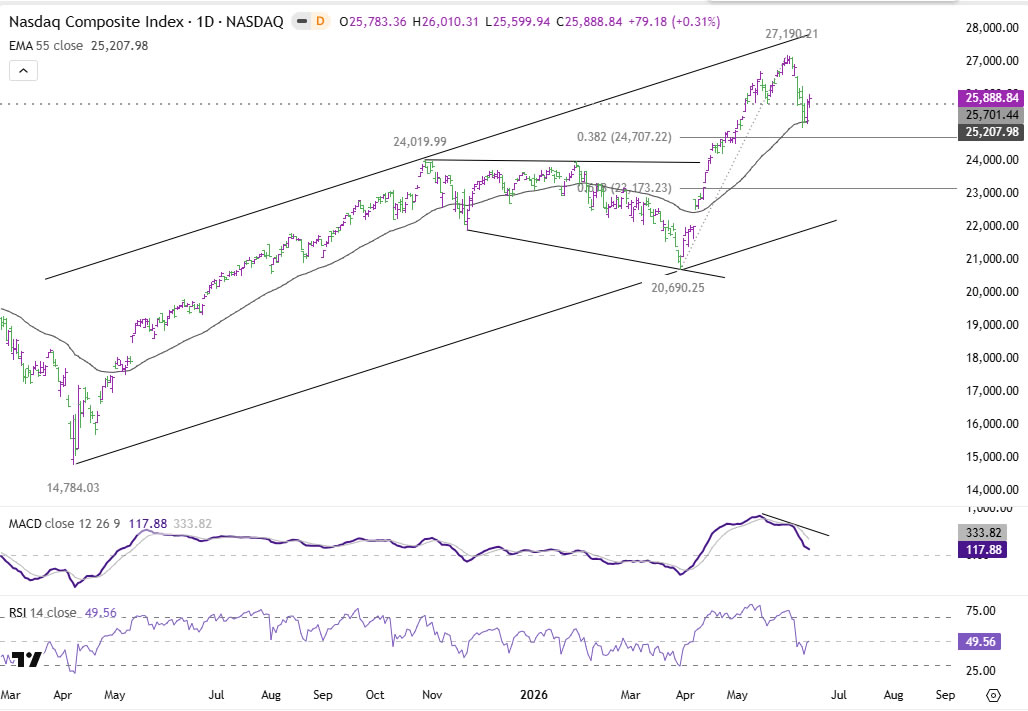
For NASDAQ, the picture has turned more corrective too. The break of 25,888.84 support suggests that the advance from 20690.25 has already completed at 27,190.21. While support emerged from 55 D EMA (now at 25207.98), any rebound should remain capped by the 27,190.21 peak.
As the corrective phase develops, another decline toward the 38.2% retracement of 20,690.25 to 27,190.21 at 24,707.22 is expected. Risk also remains for a deeper pullback toward the 61.8% retracement at 23,173.13 if inflation concerns continue to dominate the narrative.
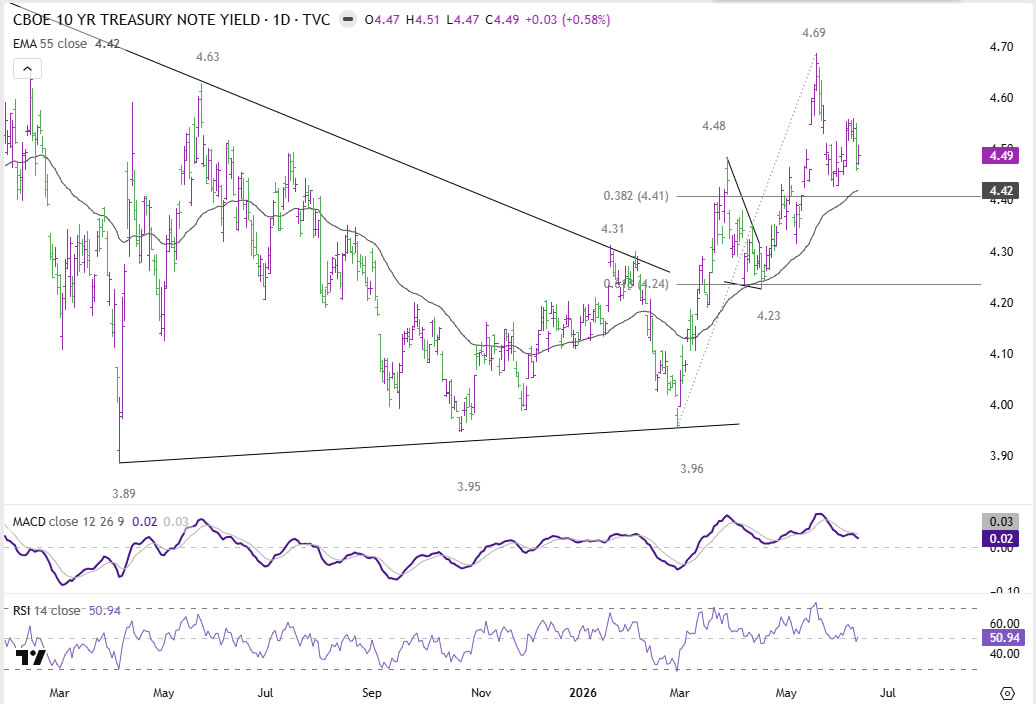
Oil Says Peace, Yields Say Inflation
One of the most important developments this week was not what Treasury yields did, but what they failed to do. Given the collapse in oil prices and the growing prospect of a US-Iran agreement, bond markets had every reason to rally aggressively. Instead, the benchmark US 10-year yield merely edged lower and remained firmly anchored near the psychologically important 4.5% level. The contrast with oil could hardly have been sharper. While crude markets are increasingly pricing peace, bond markets continue to price inflation persistence.
In addition to elevated inflation prints, the US labor market continues to show remarkable resilience. Non-farm payrolls increased by 172k in May, more than double market expectations, while unemployment held steady at 4.3%. For bond traders, these are not the ingredients of a rapidly cooling economy.
In other words, lower oil prices may help reduce future inflation risks, but they do not erase inflation already embedded in wages, services and business costs. The market increasingly believes that Fed will have to keep policy restrictive for longer, even if it ultimately avoids another rate hike. That explains why Treasury yields have remained stubbornly elevated despite improving geopolitical conditions.
Technically, current development suggests that the price actions from 4.69 short term top are developing into a sideway pattern. The range is set between 38.2% retracement of 3.96 to 4.69 at 4.41, and 4.69 high. The rising 55 D EMA (now at 4.42) could push 10-year yield for a rebound later to retest 4.69.
Only a decisive break below 4.41 would argue that yields are undergoing a more meaningful reversal, opening the way toward 61.8% retracement at 4.24 and potentially signaling a broader shift in the inflation and interest-rate outlook.
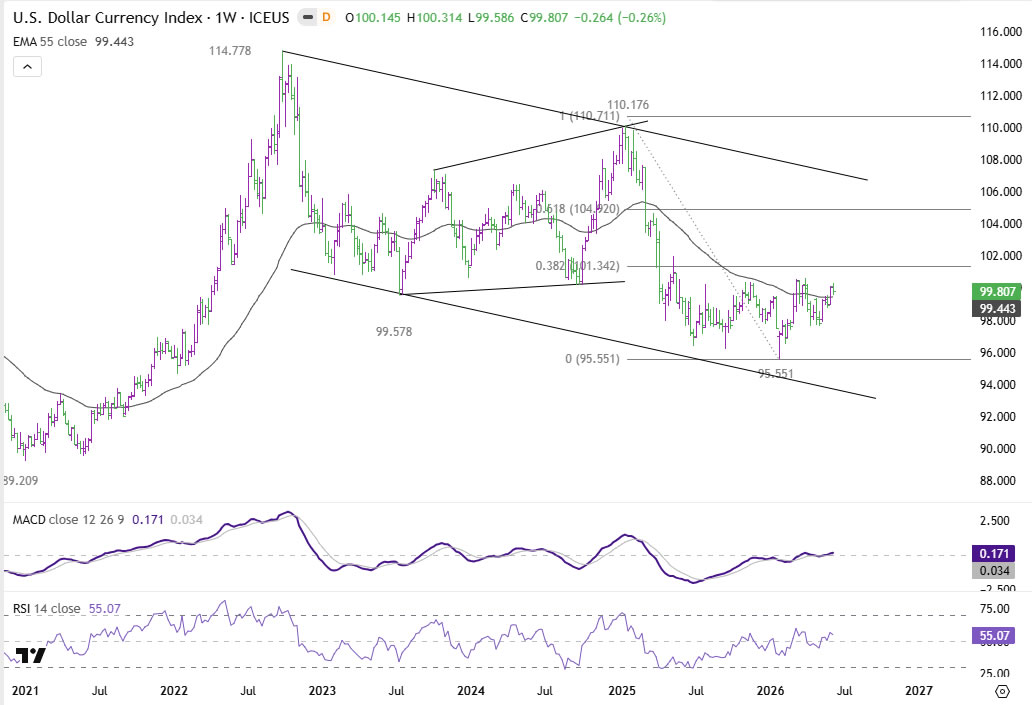
Dollar's Next Move Depends More on Fed Than Iran
Dollar Index spent most of the week in range as easing geopolitical tensions reduced demand for safe-haven assets. However, despite ending lower against most major peers, the greenback comfortably held above last week's lows, indicating that investors remain reluctant to establish aggressive bearish positions.
That hesitation reflects an important shift in market thinking. The greenback is increasingly looking at a different source of support: the US economy itself. Inflation remains well above target, producer prices continue to accelerate and labor market conditions remain firm. The prospect of a peace agreement may reduce one risk, but it does not eliminate the possibility that Fed will need to maintain restrictive policy for longer than many central banks elsewhere.
In this regard, Dollar is entering a new phase. If inflation continues to surprise on the upside and Treasury yields remain elevated, the narrative could shift fully toward Fed tightening risk. That would likely support Dollar even in an environment of improving global risk sentiment.
Technically, further rise is expected as long as 98.75 support holds. Retest of 100.64 resistance should be seen next. And break will target 38.2% retracement of 110.71 to 95.55 at 101.34.
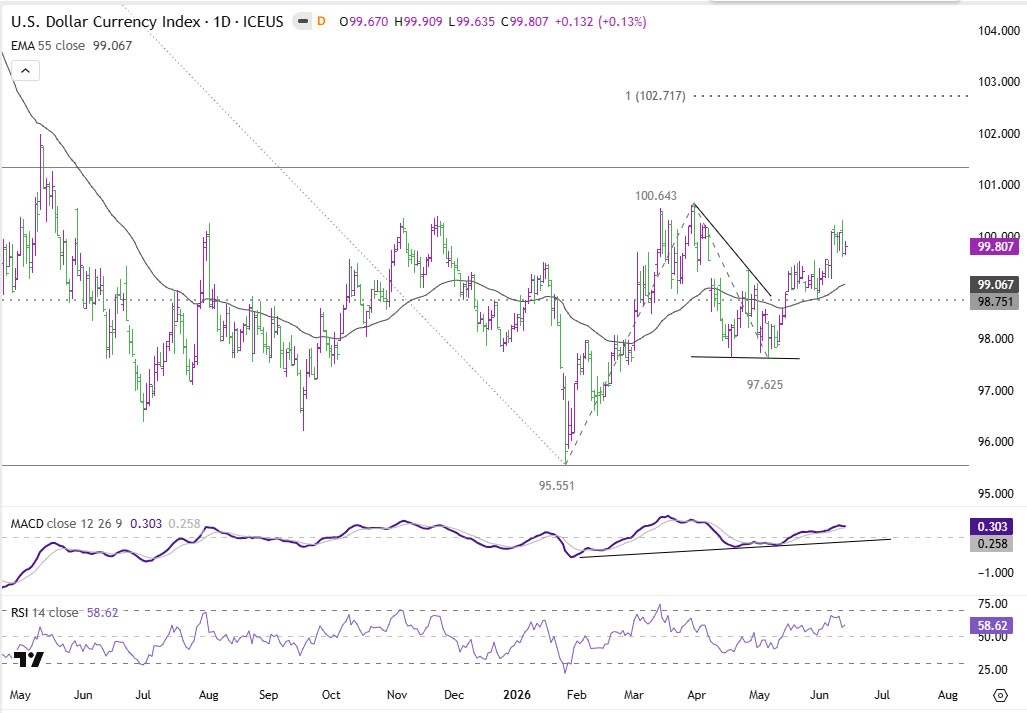
However, with oil prices collapsing and Middle East tensions easing, a decisive break through 101.34 may prove more difficult. Such a move would likely require a deeper correction in equities or a more complete transition toward a Fed-driven narrative centered on persistent inflation and higher-for-longer interest rates.
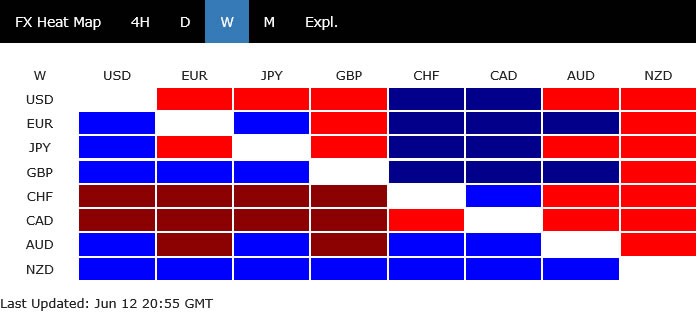
Weekly Currency Performance: Central Banks Regain Control of Markets
The strongest currencies of the week all shared a common feature: they retained some degree of tightening optionality. Kiwi led the rankings, followed by Sterling and Euro. In Sterling's case, resilient economic data and lingering expectations for a possible BoE hike later this year continued to provide support. Euro benefited from ECB's quarter-point rate increase and the message from hawks such as Joachim Nagel that additional tightening cannot be ruled out entirely. Kiwi's gains were less convincing from a technical perspective, however, as the currency remained capped below recent highs and appeared to be consolidating losses rather than establishing a fresh uptrend.
Meanwhile, the weakest currencies were generally associated with central banks that are firmly on hold. The collapse in oil prices directly undermined one of CAD's most important sources of support. Yet Loonie's challenges extend beyond energy markets. BoC left rates unchanged this week and reiterated its preference to look through the temporary inflation effects of higher oil prices where possible. Swiss Franc also struggled as markets continued to price SNB remaining at 0% throughout the remainder of 2026.
Dollar ranked third from the bottom, but its performance was more encouraging than the ranking suggests. The greenback finished above the previous week's lows against every major peer, reinforcing the view that recent weakness was merely a correction within a broader recovery. Yen and Aussie ended in the middle of the pack.
EUR/USD Weekly Outlook
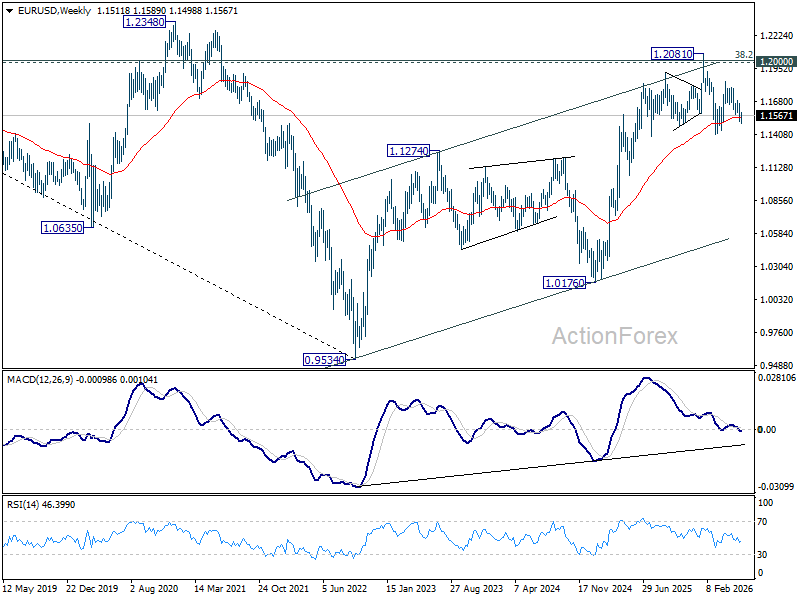
EUR/USD edged lower to 1.1499 last week but recovered since then. Initial bias remains neutral this week for consolidations. Risk will stay on the downside as long as 1.1685 resistance holds. Break of 1.1499 will resume the fall from 1.1848 towards 1.1408 support. However, firm break of 1.1685 will argue that fall from 1.1848 has completed, and bring stronger rally.
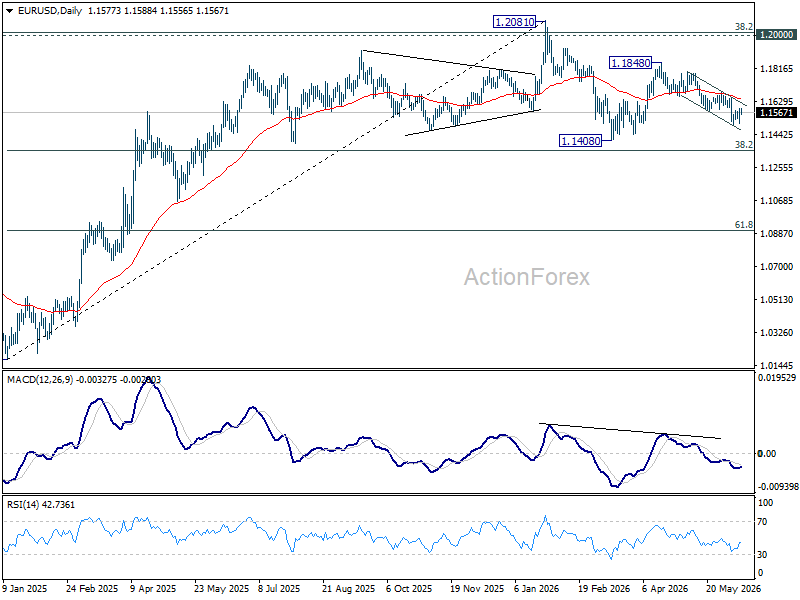
In the bigger picture, the strong support from 38.2% retracement of 1.0176 to 1.2081 at 1.1353 suggests that the pullback from 1.2081 is more likely a corrective move. Strong support was also found in 55 W EMA (now at 1.1548). Focus is back on 1.2 key cluster resistance level. Decisive break there will carry long term bullish implications. Nevertheless, break of 1.1408 support will revive the case of medium term bearish trend reversal.
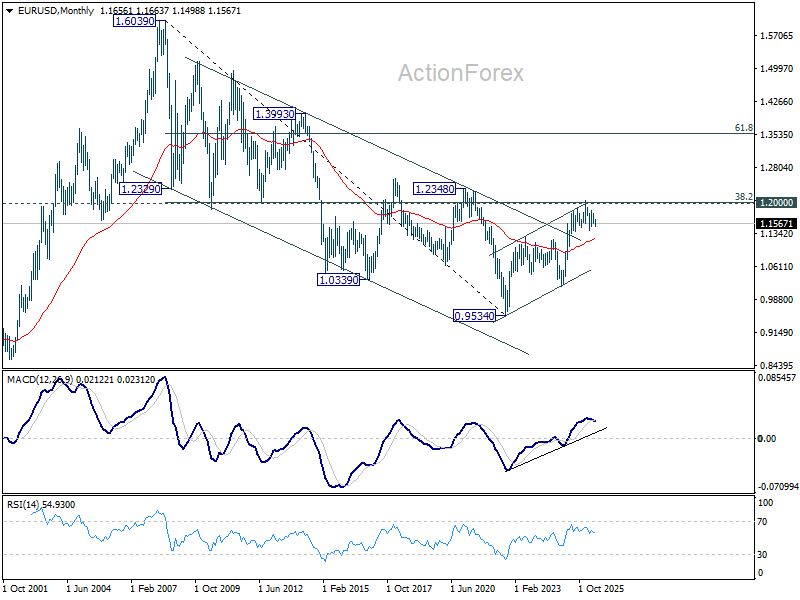
In the long term picture, 38.2% retracement of 1.6039 to 0.9534 at 1.2019, which is close to 1.2000 psychological level is the key for the outlook. Rejection by this level will keep the multi decade down trend from 1.6039 (2008 high) intact, and keep outlook neutral at best. However, decisive break of 1.2000/19, will suggest long term bullish trend reversal, and target 61.8% retracement at 1.3554.
EUR/USD Weekly Outlook
EUR/USD edged lower to 1.1499 last week but recovered since then. Initial bias remains neutral this week for consolidations. Risk will stay on the downside as long as 1.1685 resistance holds. Break of 1.1499 will resume the fall from 1.1848 towards 1.1408 support. However, firm break of 1.1685 will argue that fall from 1.1848 has completed, and bring stronger rally.
In the bigger picture, the strong support from 38.2% retracement of 1.0176 to 1.2081 at 1.1353 suggests that the pullback from 1.2081 is more likely a corrective move. Strong support was also found in 55 W EMA (now at 1.1548). Focus is back on 1.2 key cluster resistance level. Decisive break there will carry long term bullish implications. Nevertheless, break of 1.1408 support will revive the case of medium term bearish trend reversal.
In the long term picture, 38.2% retracement of 1.6039 to 0.9534 at 1.2019, which is close to 1.2000 psychological level is the key for the outlook. Rejection by this level will keep the multi decade down trend from 1.6039 (2008 high) intact, and keep outlook neutral at best. However, decisive break of 1.2000/19, will suggest long term bullish trend reversal, and target 61.8% retracement at 1.3554.
USD/JPY Weekly Outlook
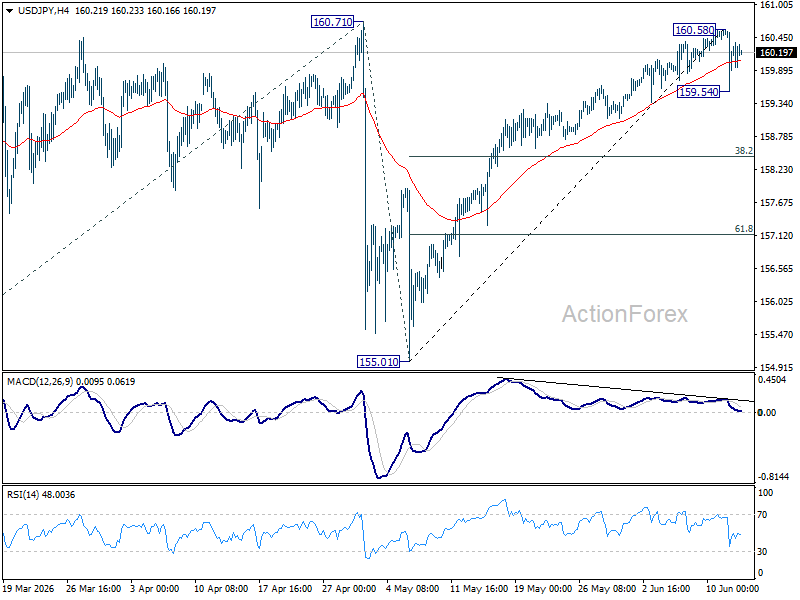
USD/JPY retreated notably after edging higher to 160.58 last week. Considering bearish divergence condition in 4H MACD, a short term top could be formed ahead of 160.71 key resistance. On the downside, break of 159.54 will bring deeper pullback to 38.2% retracement of 155.01 to 160.58 at 158.45. However, decisive break of 160.71 will confirm up trend resumption. That should push USD/JPY through 161.94 to 100% projection of 152.25 to 160.71 from 155.01 at 163.47 next.
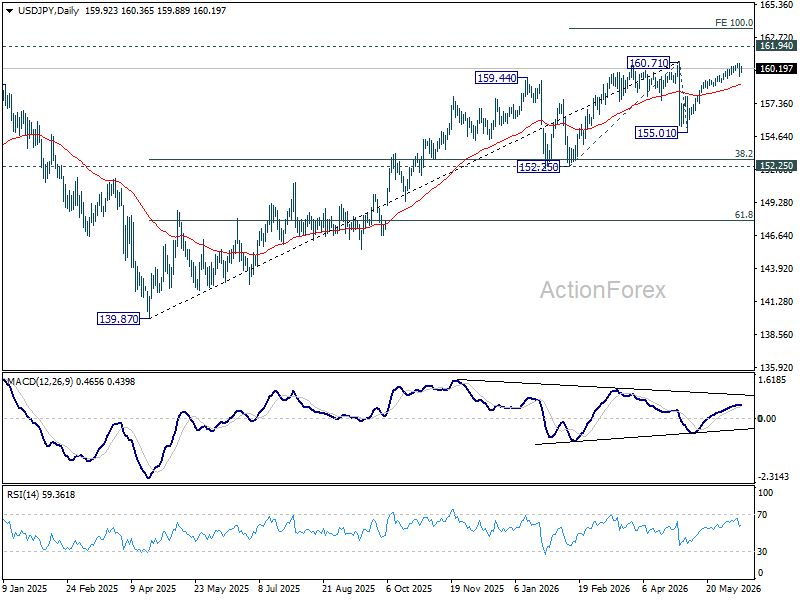
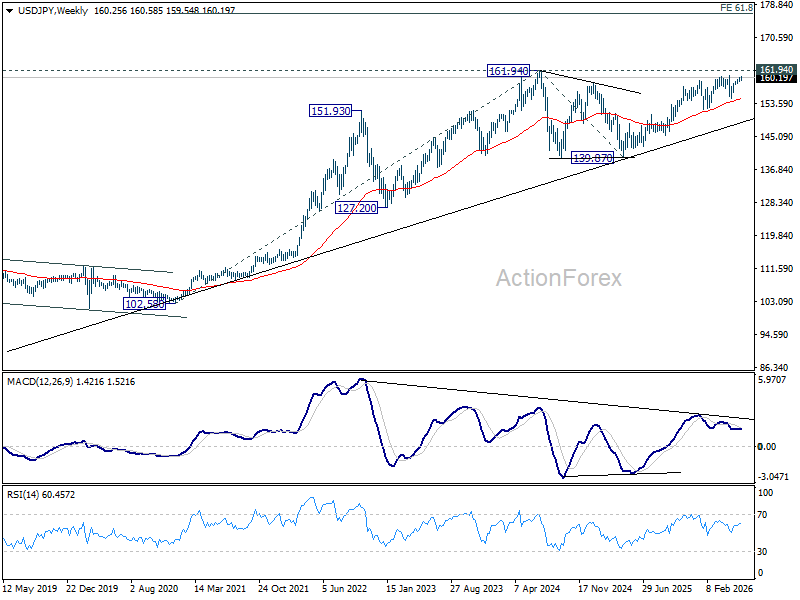
In the bigger picture, for now, corrective pattern from 161.94 (2024 high) is still seen as completed at 139.87. Rise from there is seen as resuming the long term up trend. So, break of 161.94 is expected at a later stage to resume the long term up trend. However, sustained break of 55 W EMA (now at 154.94) will dampen this view and bring deeper fall back towards 139.87 to extend the pattern from 161.94.
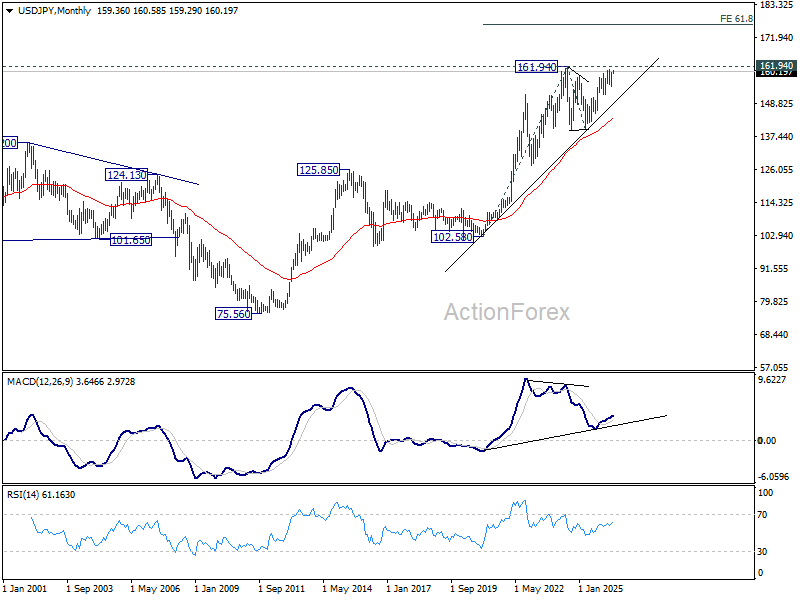
In the long term picture, up trend from 75.56 (2011 low) is still in progress and might be ready to resume. Firm break of 161.94 will target 61.8% projection of 102.58 (2020 low) to 161.94 (2024 high) from 139.87 at 176.55 in the medium term. Long term outlook will stay bullish as long as 139.87 support holds, even in case of deep pullback.
GBP/USD Weekly Outlook
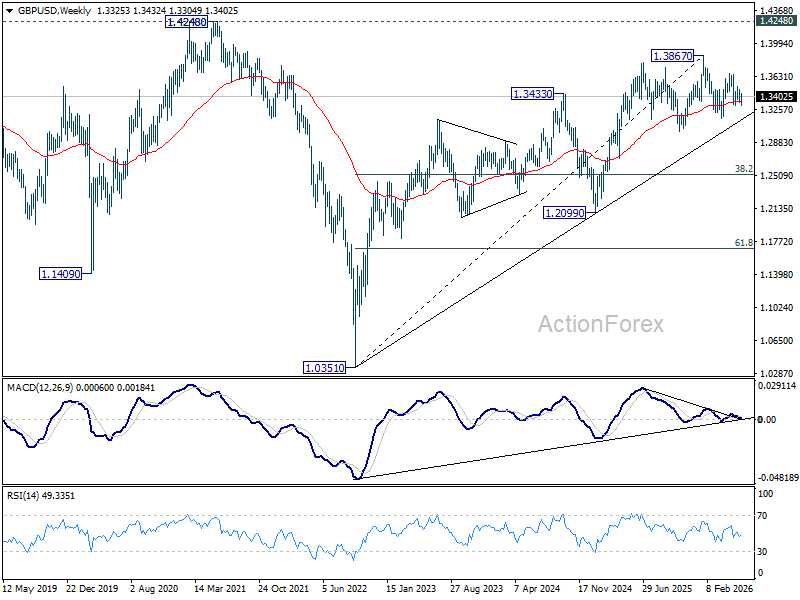
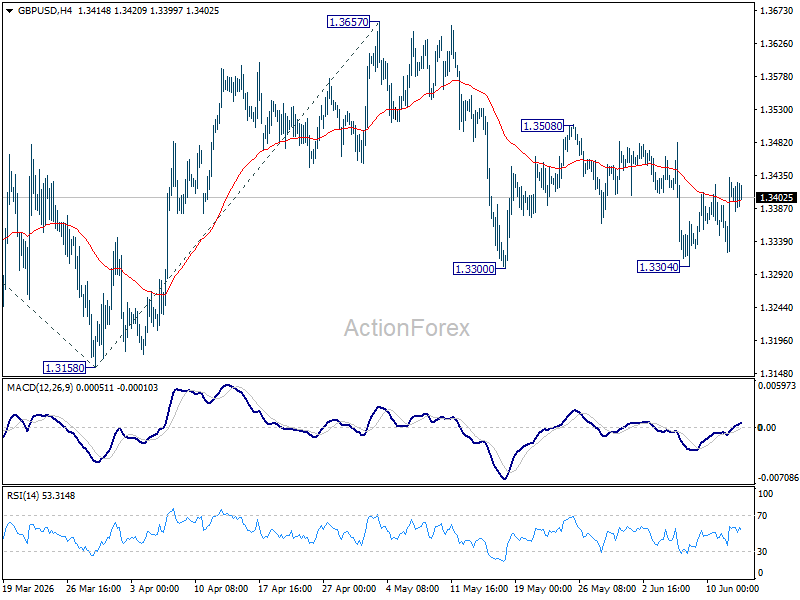
GBP/USD failed to break through 1.3300 support last week as sideway trading continued. Initial bias remains neutral this week first. Risk will stay mildly on the downside as long as 1.3508 resistance holds. Firm break of 1.3300 will resume the decline from 1.3657 to 1.3158 support next. However, break of 1.3508 will turn bias back to the upside for retesting 1.3657 instead.
In the bigger picture, price actions from 1.3867 are a corrective pattern within the broader up trend from 1.0351 (2022 low). With 1.3008 support intact, medium term bullishness is maintained and break of 1.3867 is in favor for a later stage, towards 1.4248 key resistance (2021 high). However, firm break of 1.3008 will at least bring deeper fall to 38.2% retracement of 1.0351 to 1.3867 at 1.2524, with increased risk of bearish reversal.
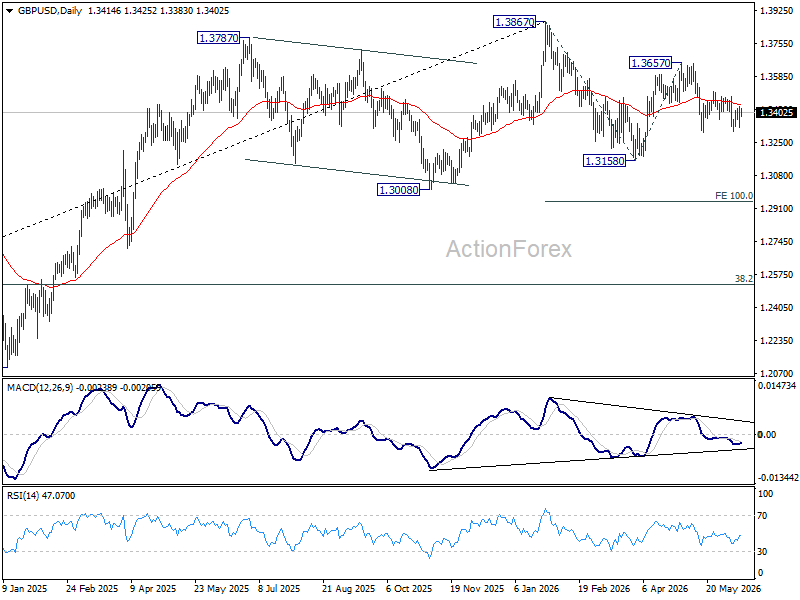
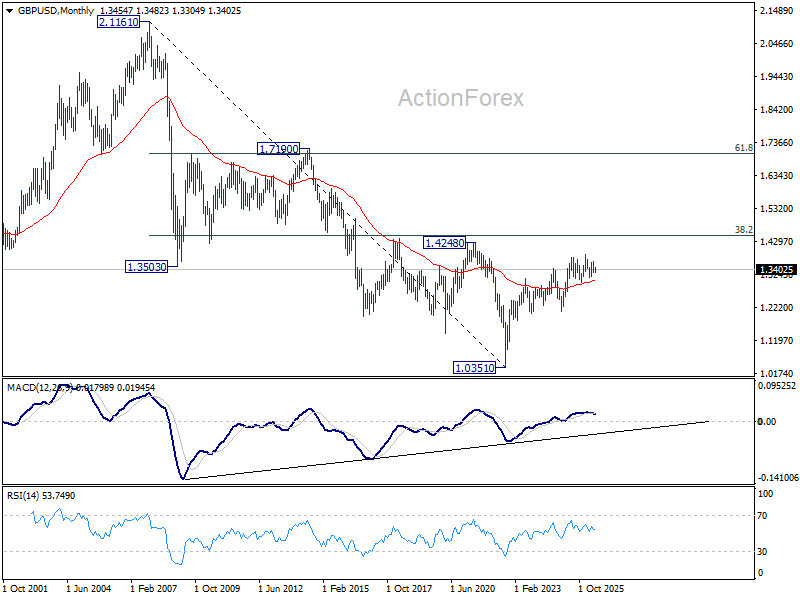
In the long term picture, as long as 1.4248/4480 resistance zone holds (38.2% retracement of 2.1161 to 1.0351 at 1.4480), the long term outlook will remain bearish. That is, price actions from 1.0351 are seen as a corrective pattern to down trend from 2.1161 (2007 high) only. Nevertheless, decisive break of 1.4248/4480 will be a strong sign of long term bullish reversal.