
Sample Category Title
USD/CAD Daily Outlook
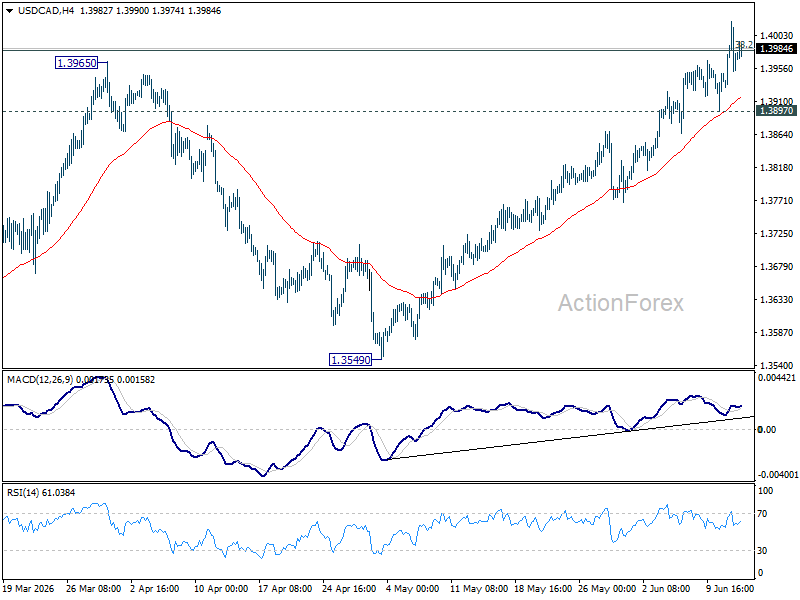
Intraday bias in USD/CAD stays on the upside for the moment. Decisive break of 38.2% retracement of 1.4791 to 1.3480 at 1.3981 will carry larger bullish implications and target 61.8% retracement at 1.4290 next. On the downside, below 1.3897 minor support will turn bias neutral again first.
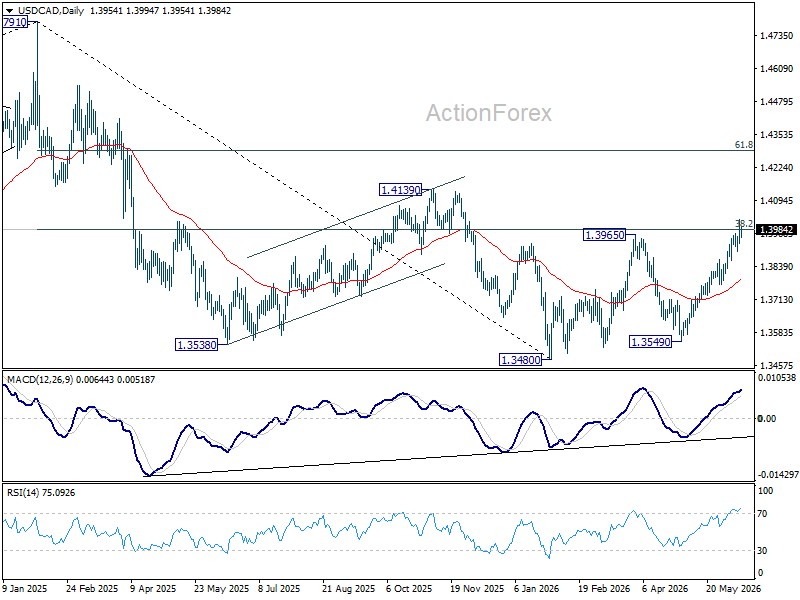
In the bigger picture, price actions from 1.4791 are seen as a corrective pattern to the whole up trend from 1.2005 (2021 low). Rejection by 38.2% retracement of 1.4791 to 1.3480 at 1.3981 will keep the decline intact, and bring another fall through 1.3480 at a later stage. However, firm break of 1.3981 will argue that the decline has completed, and set up further rise back to retest 1.4791 instead.
GBP/JPY Daily Outlook
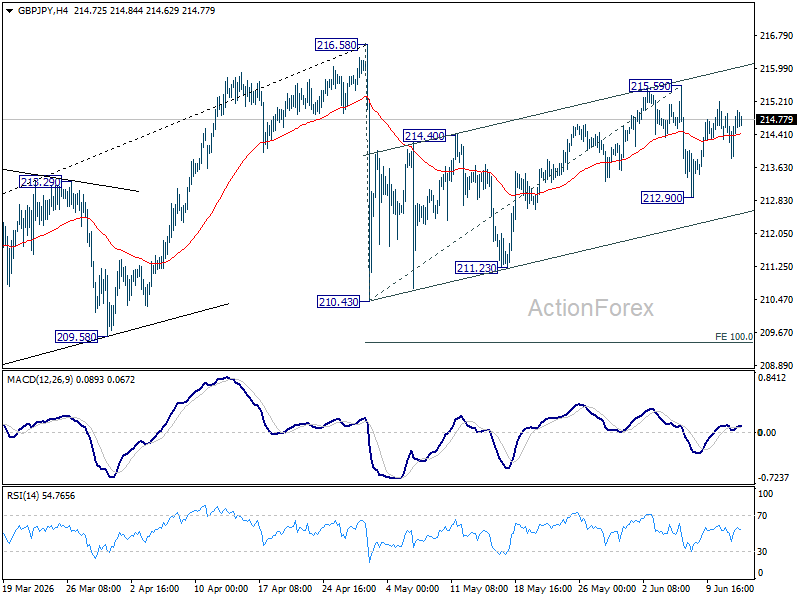
Outlook is unchanged in GBP/JPY and intraday bias remains neutral. Risk stays mildly on the downside as long as 215.59 resistance holds. Below 212.90 will target 210.43/211.23 support zone. However, firm break of 215.59 will resume the rebound from 210.43 to retest 216.58 high instead.
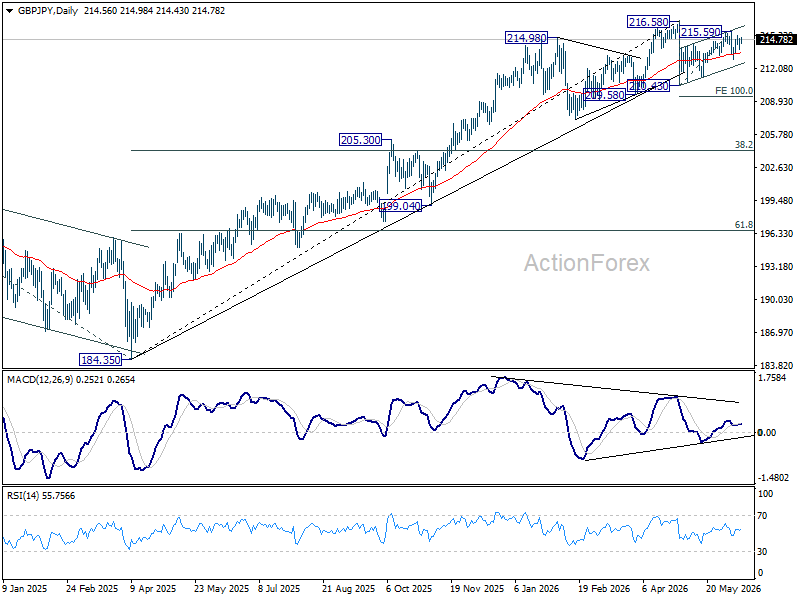
In the bigger picture, there is no clear sign of trend reversal yet. The long term up trend could still extend to 61.8% projection of 148.93 (2022 low) to 208.09 (2024 high) from 184.35 at 220.90 on resumption. However, sustained break of 55 W EMA (now at 206.77) will argue that it's already in medium term down trend for 184.35 support.
EUR/JPY Daily Outlook
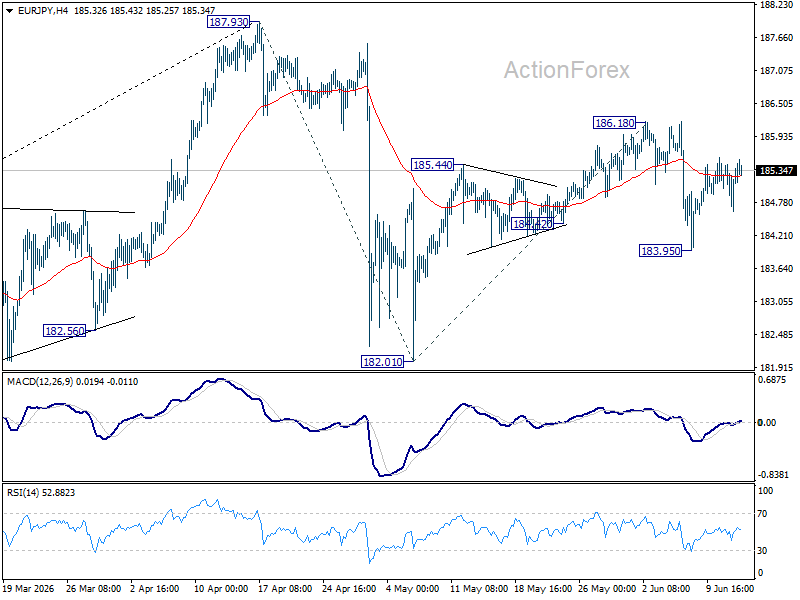
No change in EUR/JPY's outlook and intraday bias remains neutral. Risks stay mildly on the downside as long as 186.18 resistance holds. Below 183.95 will bring retest of 182.01 support first. However, firm break of 186.18 will resume the rebound from 182.01 to retest 187.93 high instead.
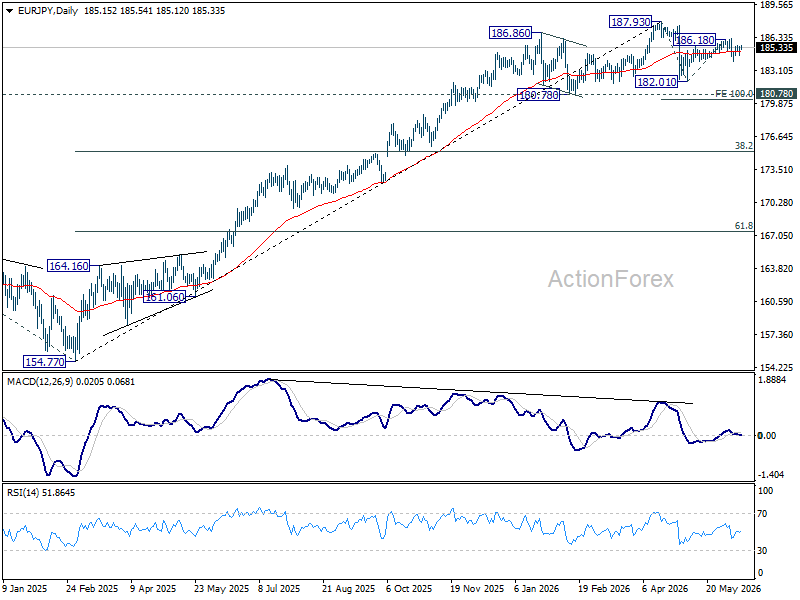
In the bigger picture, there is no sign of reversal yet. Uptrend from 114.42 (2020 low) is still expected to resume at a later stage to 78.6% projection of 124.37 (2022 low) to 175.41 (2025 high) from 154.77 at 194.88. However, sustained break of 55 W EMA (now at 178.95) will argue that it's already in a medium term down trend to 175.41 resistance turned support and below.
EUR/GBP Daily Outlook
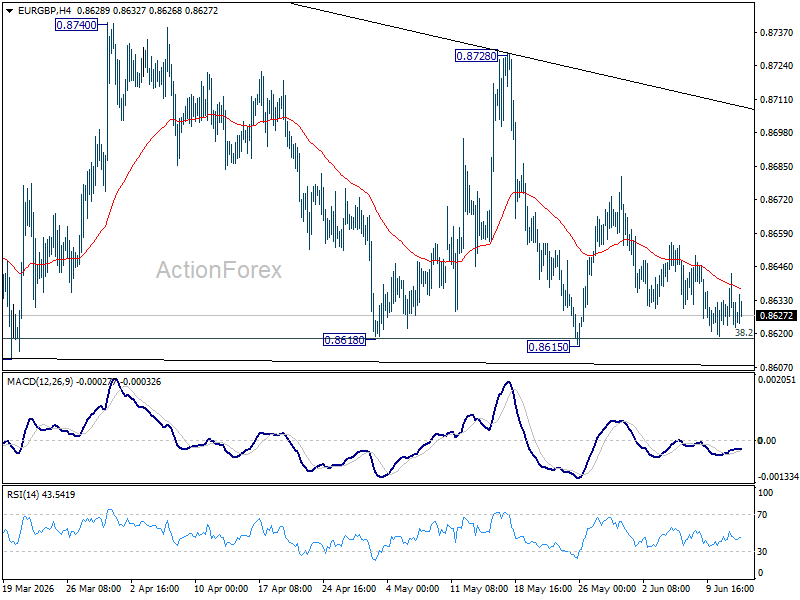
Sideway trading continues in EUR/GBP and outlook is unchanged. Intraday bias remains neutral at this point. On the downside, decisive break of 0.8610 support will revive the case of bearish trend reversal. On the upside, break of 0.8728 resistance will bring stronger rally back towards 0.8788 resistance.
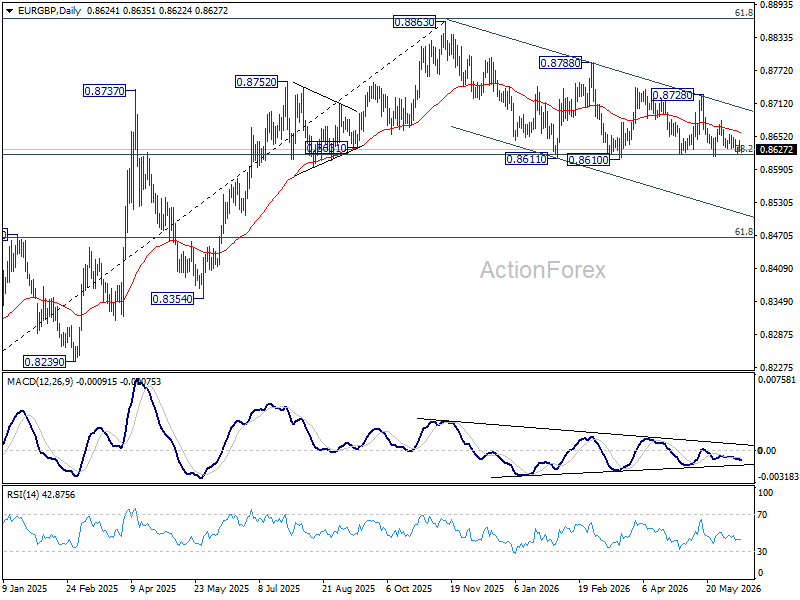
In the bigger picture, focus is staying on 38.2% retracement of 0.8821 to 0.8863 at 0.8618. Strong rebound from there will retain medium term bullishness. Rise from 0.8221 should resume through 0.8863 at a later stage. Nevertheless, sustained break of 0.8618 will confirm that whole rise from 0.8221 has completed at 0.8863. Deeper decline should then be seen to 61.8% retracement at 0.8466 at least.
EUR/AUD Daily Outlook
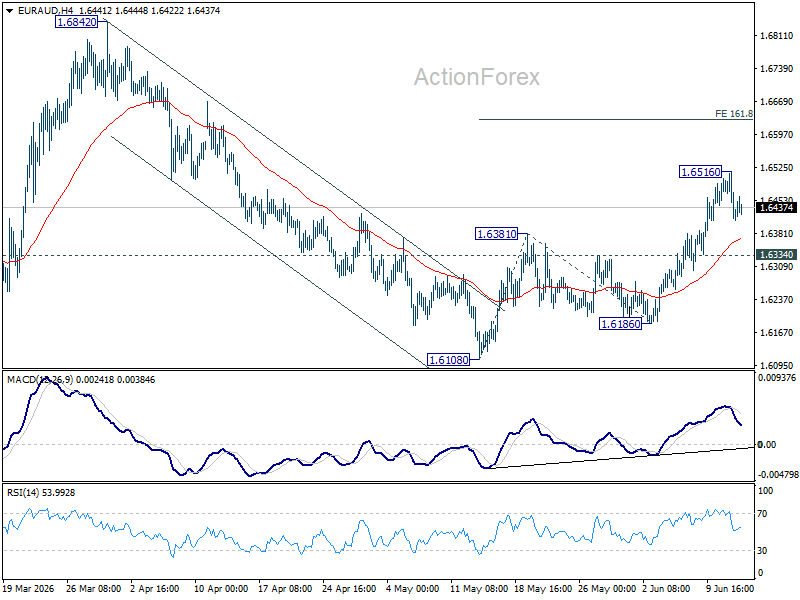
Intraday bias in EUR/AUD is turned neutral first with current retreat. Some consolidations would be seen below 1.6516 temporary top. But further rise is expected as long as 1.6334 support holds. Above 1.6516 will target 161.8% projection of 1.6108 to 1.6381 from 1.6186 at 1.6628 next.
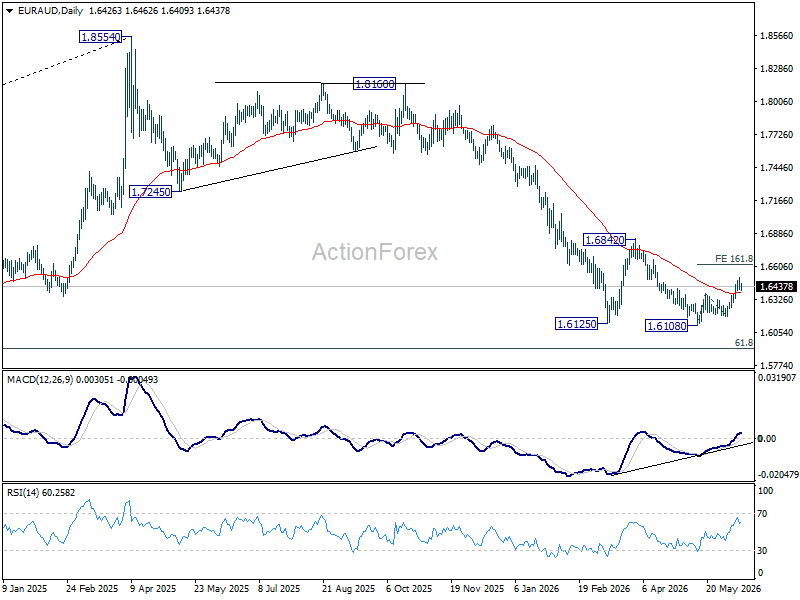
In the bigger picture, outlook will stay bearish as long as 1.6842 resistance holds. Fall from 1.8554 (2025 high) is expected to continue to 61.8% retracement of 1.4281 to 1.8554 at 1.5913. Decisive break there will pave the way back to 1.4281 (2022 low). However, firm break of 1.6842 should confirm medium term bottoming, and bring stronger rally.
EUR/CHF Daily Outlook
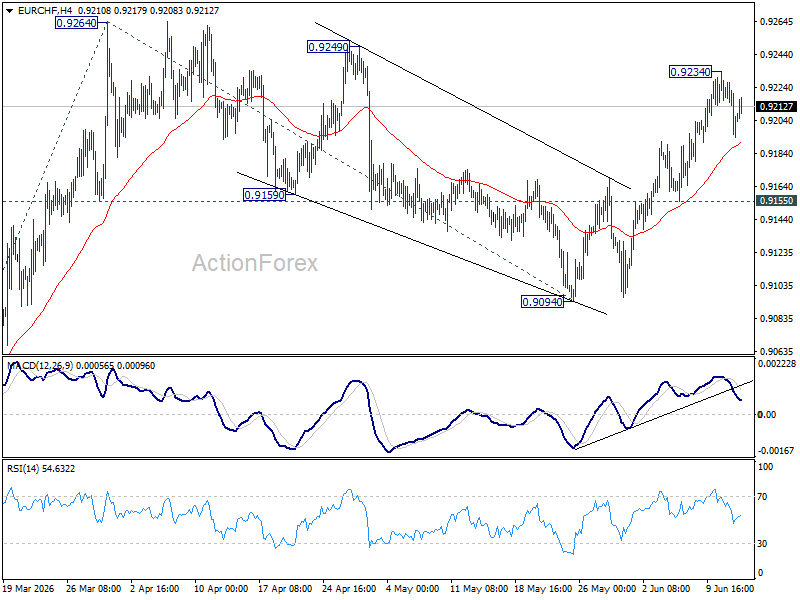
EUR/CHF is staying in consolidations below 0.9234 temporary top and intraday bias remains neutral first. Further rise is expected as long as 0.9155 support holds. Above 0.9234 will bring retest of 0.9264 resistance first. Firm break there will resume the rise from 0.8979 to 100% projection of 0.8979 to 0.9264 from 0.9094 at 0.9379.
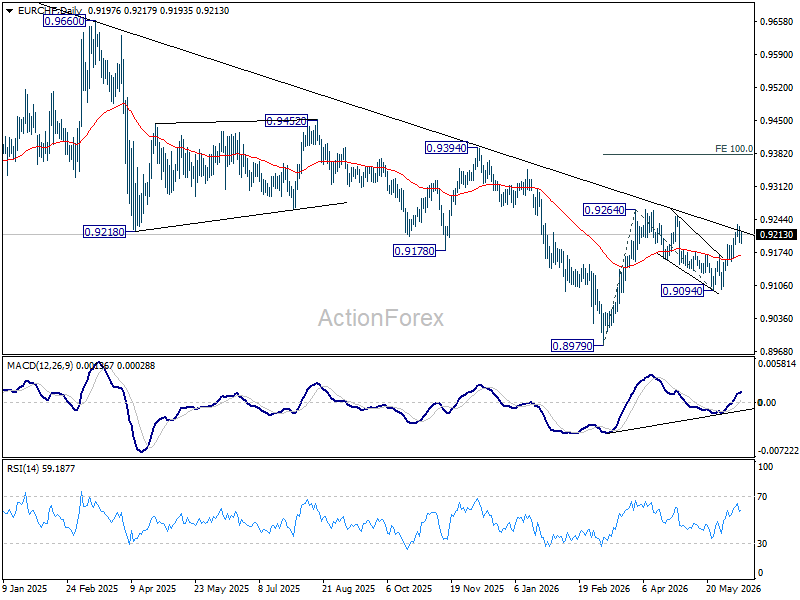
In the bigger picture, as long as 0.9394 resistance holds, down trend from 0.9928 (2024 high) should still be in progress. Firm break of 0.8979 will confirm down trend resumption. However, decisive break of 0.9394 will be an important sign of medium term bullish reversal.
US Dollar Index Analysis: Dollar at a Crucial Point, What’s Next?
As the chart shows, the US Dollar Index (DXY) has gained more than 4% from its January lows, with the move accelerating from February 2026 onwards. Today, the dollar finds itself at a technically and fundamentally critical point, one that could define the near-term direction not only of the greenback itself, but of equity indices, dollar-paired currencies, commodities, and cryptocurrencies alike.
What Has Been Driving Dollar Strength?
The primary driver behind the dollar's recent appreciation has been geopolitical uncertainty in the Middle East, with the US dollar and crude oil (XBR/USD and WTI/USD) being the natural beneficiaries.
The most recent example came on 11 June, when President Trump stated his intention to bomb Iran and seize its oil resources — echoing the approach taken with Venezuela. Within hours, however, the statement was walked back, with officials indicating that negotiations were in their final stages. The dollar initially surged on hawkish rhetoric, then surrendered the entire gain as tensions appeared to ease, with traders reducing so-called safe-haven exposure. Should Middle East tensions escalate further and a near-term agreement fail to materialise, the dollar could find renewed buying interest and potentially challenge the key level it currently faces.
Technical Analysis of the DXY
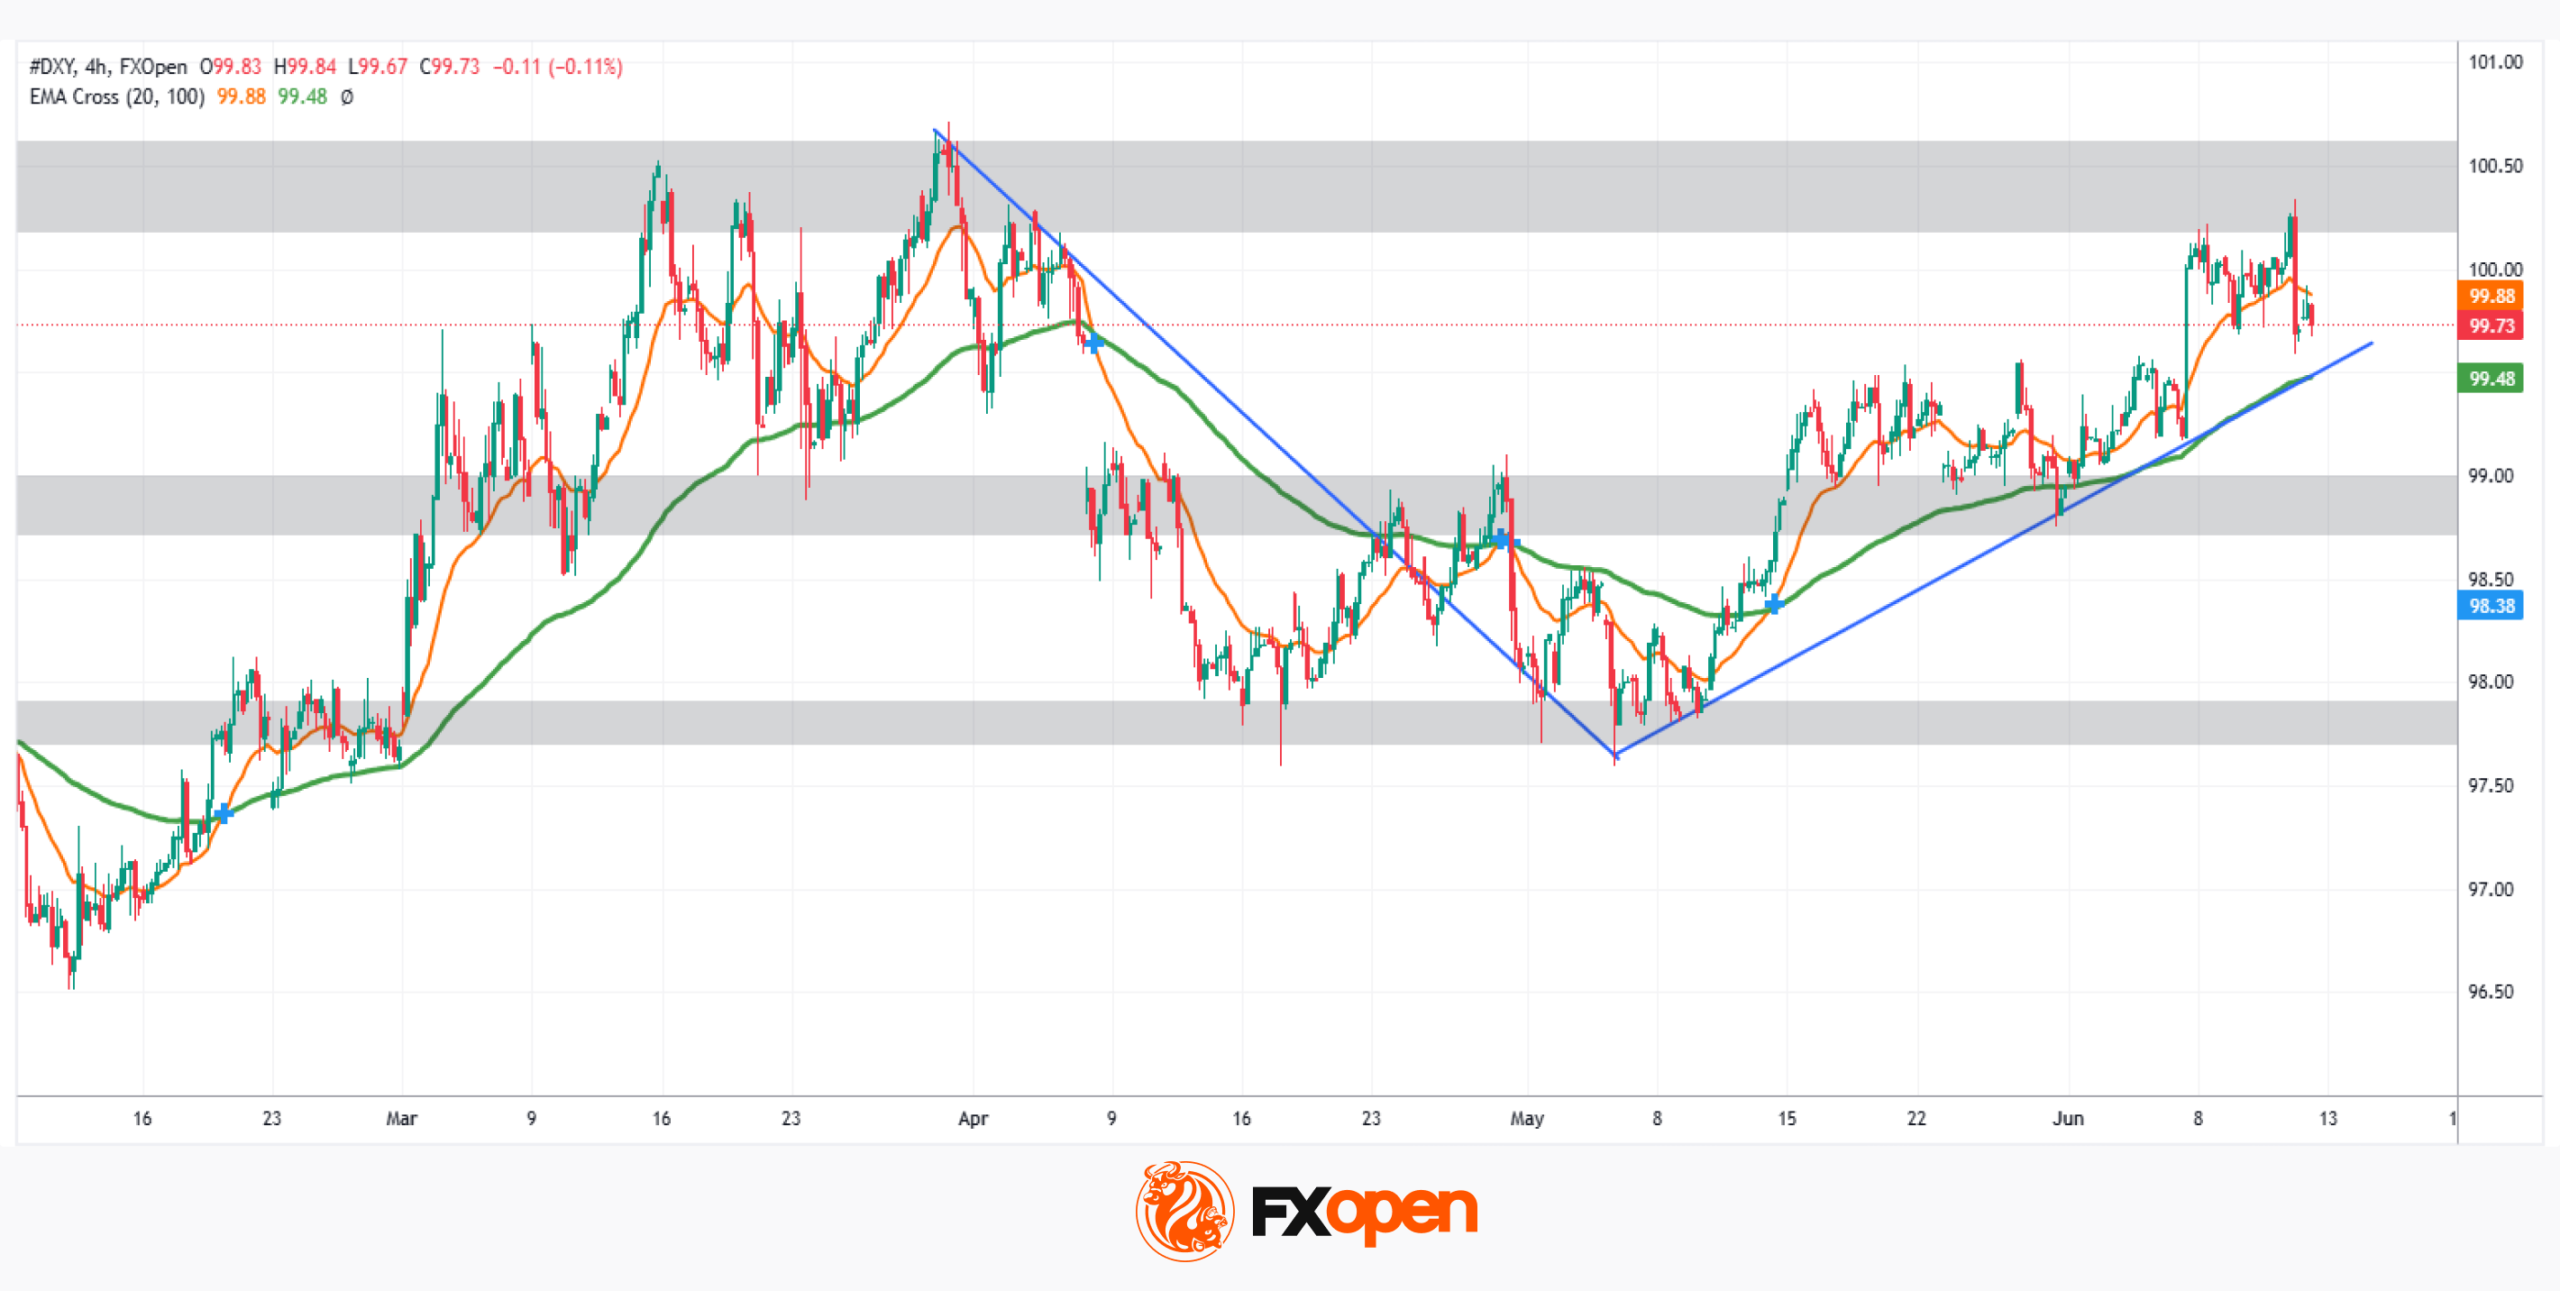
From a technical standpoint, the DXY is trading around the 100.00 level, a zone that carries both psychological and structural significance. Historically, this area acted as a major support; it now functions as a key resistance. The index has tested and rejected this zone on multiple occasions — in March, April, and again in recent sessions — yet the broader bullish structure remains intact.
On the bullish side, the immediate levels to consider are 100.31, yesterday's high, and 100.64, the 2026 high. A decisive break above these levels could open the door towards 102.00 and 103.50, where the next significant resistance areas sit.
On the bearish side, a rejection at current levels followed by a break of the ascending trendline, which has acted as reliable support for approximately two months, would also coincide with a break of the 100-period EMA, a level the DXY has historically respected. The key area to monitor in this scenario is the 98.90–98.70 zone: a confirmed break below this support could trigger a structural shift, forming lower lows and potentially opening the door to a broader bearish phase.
The dollar is walking a tightrope. Highly sensitive to both geopolitical headlines and macroeconomic data, the question remains: will the DXY finally clear the 100.00 threshold or continue to stall beneath it?
Trade global index CFDs with zero commission and tight spreads (additional fees may apply). Open your FXOpen account now or learn more about trading index CFDs with FXOpen.
This article represents the opinion of the Companies operating under the FXOpen brand only. It is not to be construed as an offer, solicitation, or recommendation with respect to products and services provided by the Companies operating under the FXOpen brand, nor is it to be considered financial advice.
Dollar: De-Escalation Sends Bulls Fleeing
• Rumours of an imminent peace deal in the Middle East sent the USD index tumbling.
• The ECB raised interest rates but did not signal that the cycle would continue.
The US dollar recorded its worst daily fall in over a month amid de-escalation in the Middle East, the ECB’s tightening of monetary policy and an improvement in global risk appetite. SpaceX’s $75bn IPO was successful and surpassed the previous record of $26bn set by Saudi Arabian Oil in 2019. The company’s market capitalisation was $1.77tn. Its initial public offering boosted stock indices and put pressure on the greenback, a safe-haven asset.
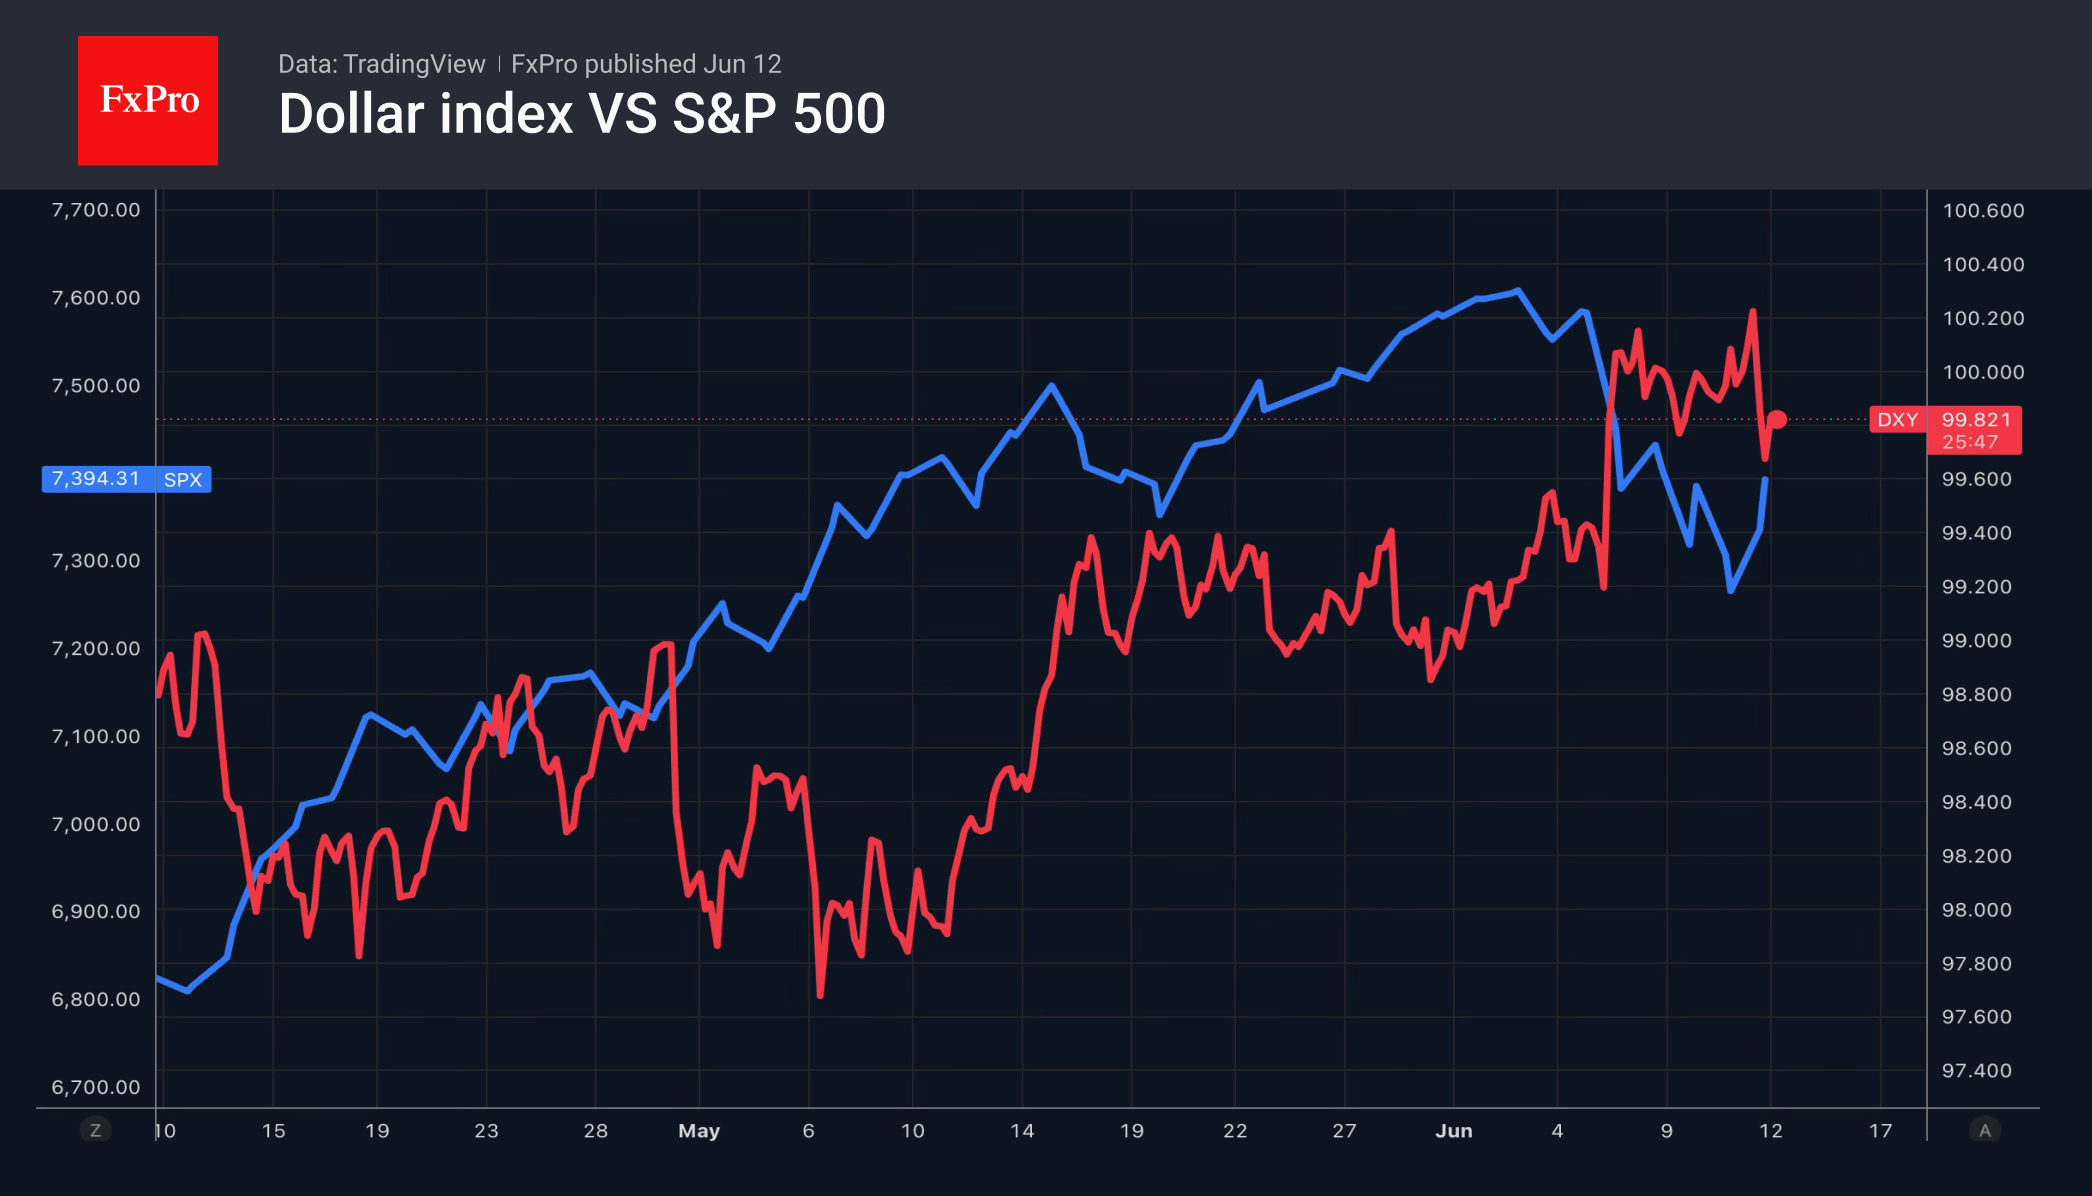
Before this, the US dollar had been unable to capitalise on the S&P 500’s pullback, as oil stubbornly refused to rise even amid the military strikes on Iran. As soon as the hostilities ceased and Donald Trump announced a peace agreement, Brent fell. This combination of falling North Sea crude and rising stock indices is creating a tailwind for EURUSD. It has allowed the euro to offset the disappointment from the ECB meeting.
The European Central Bank was the first to respond to the oil crisis-related price rises by raising interest rates. This is partly because borrowing costs in the eurozone are at a neutral level. They do not constrain economic growth, and the ECB can afford to act, unlike in the US, where a rise in the federal funds rate to 4% or higher would act as a headwind for GDP.
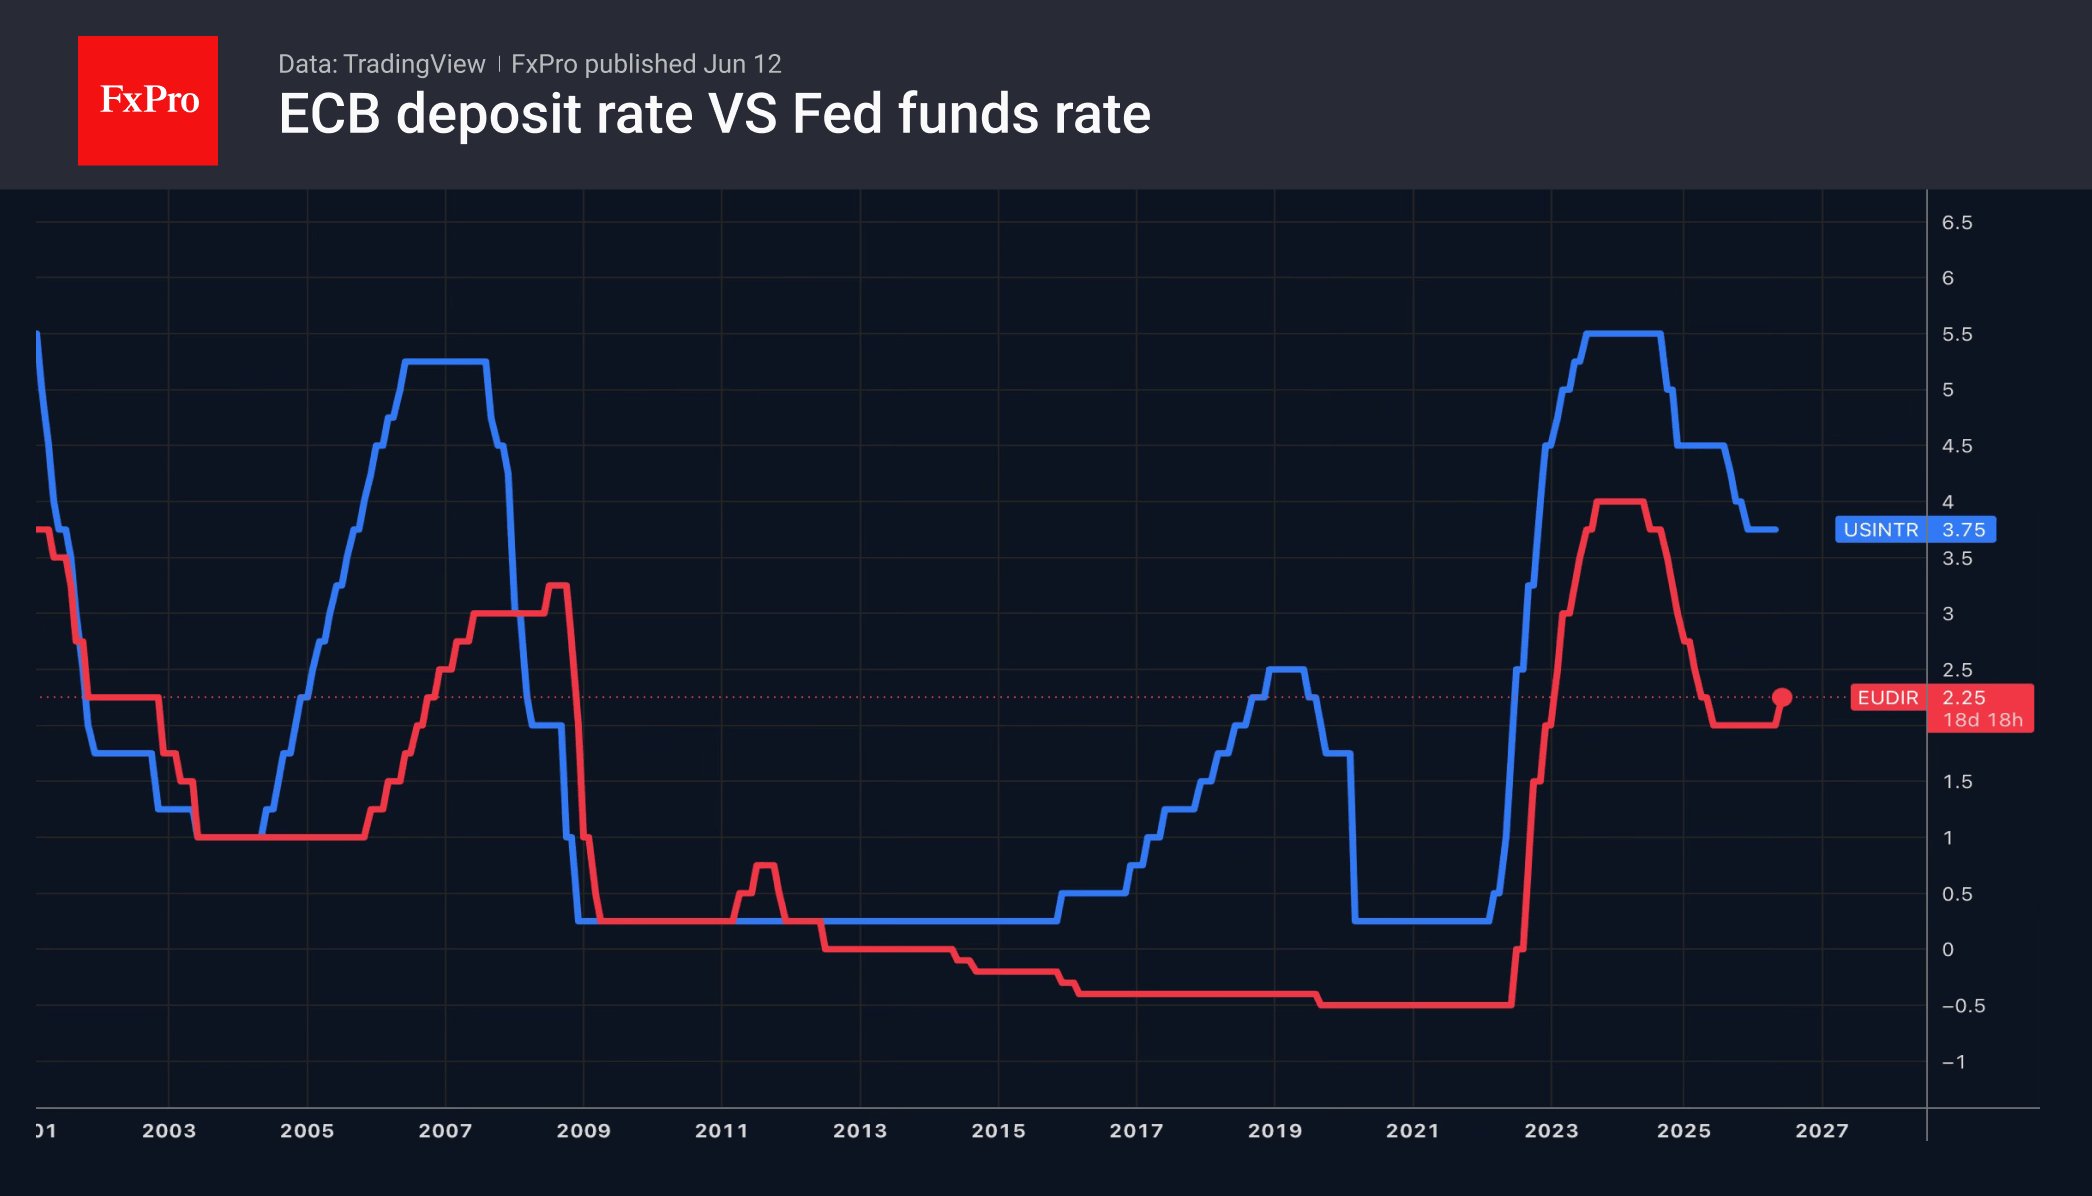
At the same time, Christine Lagarde did not give any clear signals about the continuation of the monetary tightening cycle. The European Central Bank’s future decisions will depend on the data, which has disappointed EURUSD bulls. The same applies to the stagflation scenario in the forecasts. Rising inflation estimates and slowing economic growth risk causing a rift within the ECB. As a result, the deposit rate may not reach the 2.5% expected by markets and Bloomberg experts by 2026.
The fall in the US dollar, driven by the de-escalation of the conflict in the Middle East, has come as a balm for the wounds of the Japanese government. Previously, USDJPY had broken through to the levels seen during the April-May interventions following rumours of Kazuo Ueda’s hospitalisation a few days before the BoJ meeting. The central bank is forecast to raise the overnight rate from 0.75% to 1%. However, investors were awaiting the regulator’s chief’s press conference with far greater interest.
Oil Collapses on Hormuz Optimism, EUR/CAD Rally May Be Just Getting Started
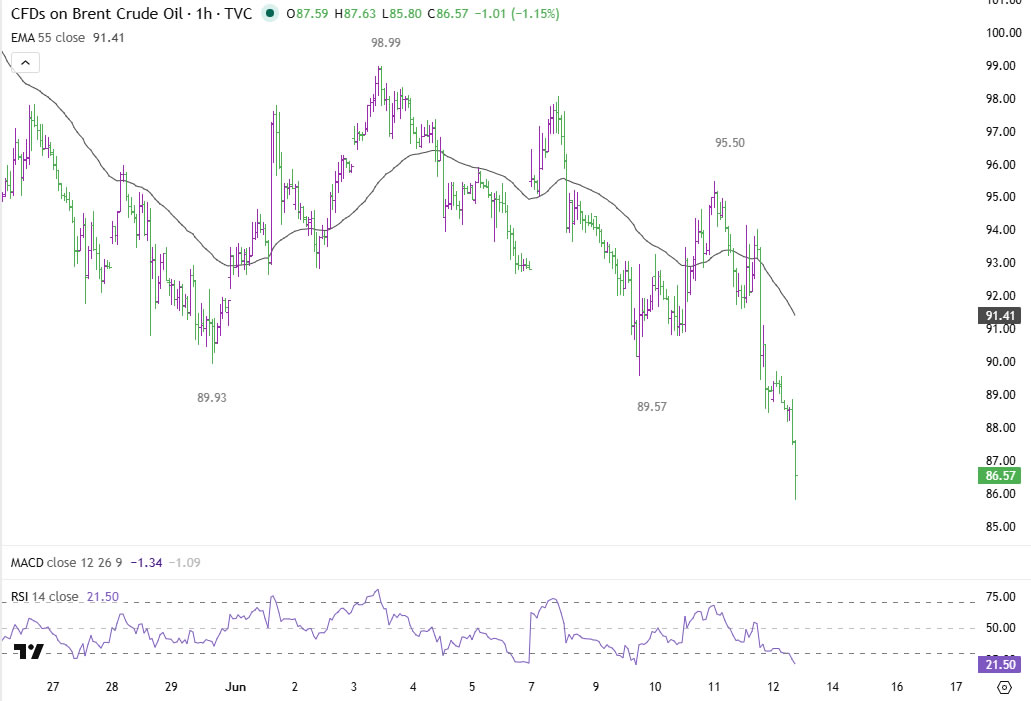
Oil prices extended their sharp decline on today as markets grew increasingly confident that a breakthrough in US-Iran negotiations could eventually restore normal energy flows through the Strait of Hormuz. Brent crude slipped back into the $86-87 region, with the break below the psychologically important $90 level reinforcing the view that traders are beginning to unwind part of the geopolitical risk premium. For currency markets, the move has translated directly into renewed pressure on the Canadian Dollar and fresh strength in EUR/CAD.
The latest catalyst came from Iranian state media, which reported that the draft memorandum of understanding between Tehran and Washington includes commitments to reopen the Strait of Hormuz within 30 days and lift US oil sanctions on Iran. According to reports, the 14-point framework would also require the release of part of Iran's frozen assets, the suspension of oil sanctions and the lifting of the naval blockade before final negotiations begin. While the agreement has yet to be formally signed, the details represent the clearest indication so far that both sides are moving toward a framework that could significantly increase oil supply and ease fears of prolonged disruptions to global shipping routes.
On the Euro side of the equation, support continues to come from ECB's rate hike this week and lingering expectations that policymakers may not be finished tightening. While a July move is not viewed as the base case, comments from hawks such as Bundesbank President Joachim Nagel have reinforced the message that another hike remains possible if inflation continues spreading beyond energy. Some economists continue to expect at least one additional move later this year, most likely in September. In contrast, markets generally view Bank of Canada will be on hold for the rest of the year.
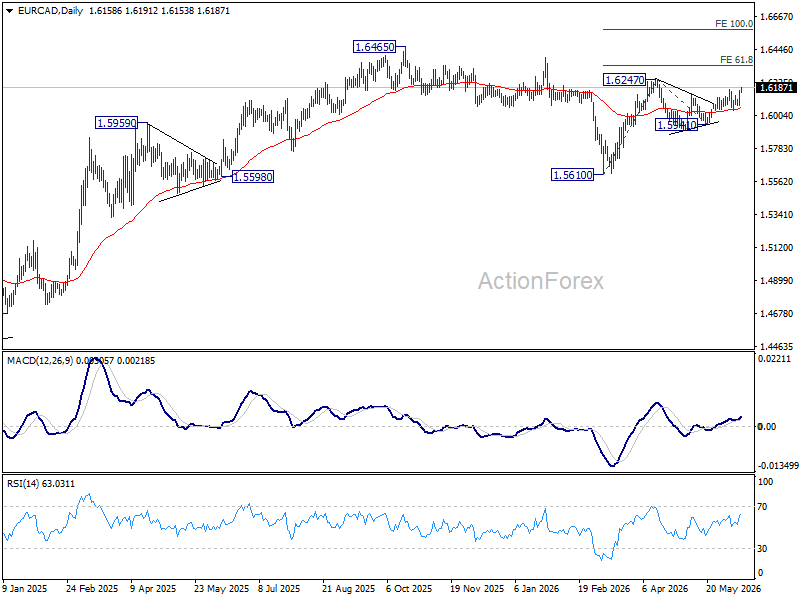
Technically, EUR/CAD has delivered an important bullish signal by breaking above 1.6176, resuming the rally from 1.5941 after a slightly deeper than expected pullback to 1.6035. The move supports the view that the consolidation from 1.6247 completed at 1.5941 and that the broader rise from 1.5610 is resuming.
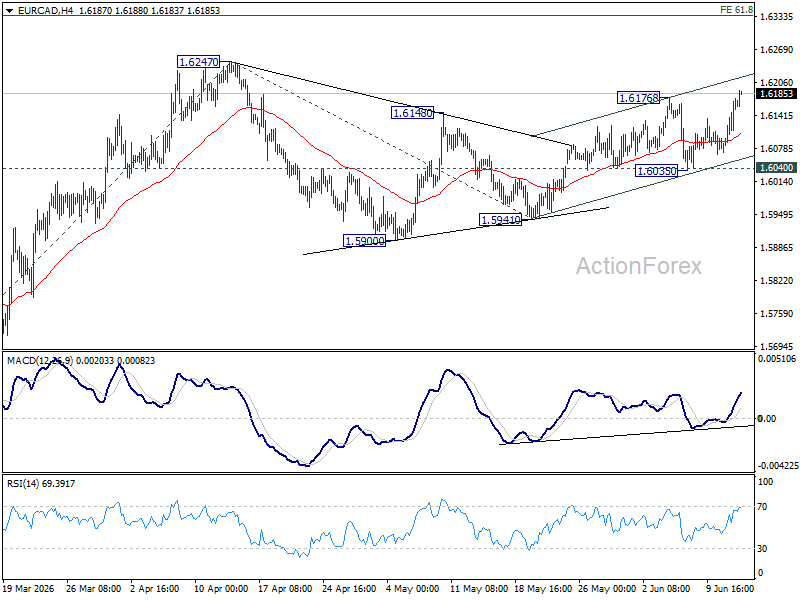
Immediate focus now turns to a retest of 1.6247. A firm break there would target 61.8% projection of 1.5610 to 1.6247 from 1.5941 at 1.6335. Beyond that, the 2025 high at 1.6456 would come back into view if oil continues to weaken and ECB tightening expectations remain alive.
US Natural Gas: Inventory Surplus Continues to Weigh on Prices
The US natural gas market (XNG/USD) is entering the summer season under the influence of two opposing forces. Domestically, the picture remains bearish. According to the EIA, working gas in underground storage stood at 2,688 billion cubic feet as of 5 June 2026, which is 151 billion cubic feet above the five-year average. At the same time, gas deliveries to major LNG export terminals have fallen to 16.3 billion cubic feet per day, as seasonal maintenance work at the Golden Pass and Freeport LNG facilities in Texas has constrained export flows.
On the other hand, global LNG demand is strengthening. On 9 June, Morgan Stanley warned that LNG prices could rise to levels not seen in more than three years. Hot weather across Asia and Europe’s need to replenish gas reserves are intensifying competition for available LNG supplies. Should demand continue to increase, a greater share of US LNG could be redirected to overseas markets, potentially providing support for domestic natural gas prices over the longer term.
Technical Picture
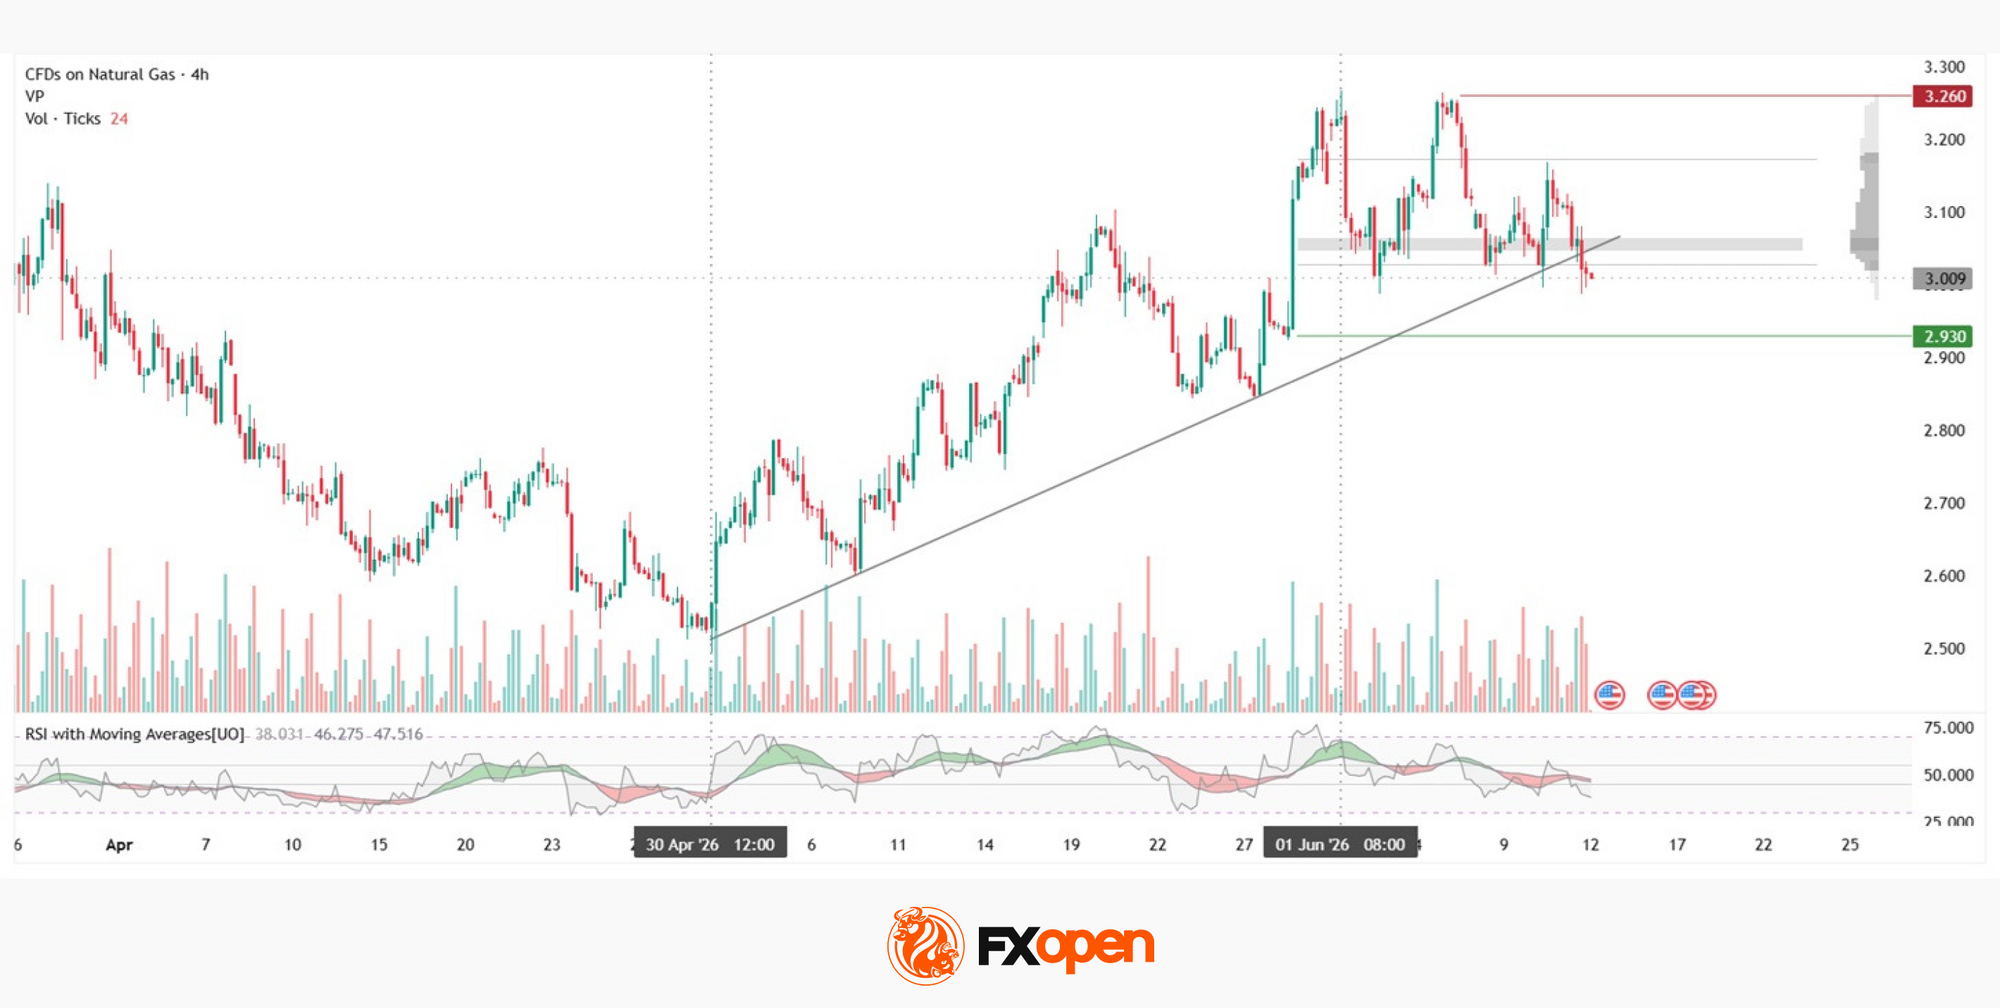
Since late April, US Natural Gas has been developing an upward trend on the H4 chart, supported by a series of higher lows. The trendline underpinned the advance up to the peak near $3.260 — a resistance level marked in red, from which the price was rejected twice. Following the second test, the current decline began, and by 11 June the price had moved below the ascending trendline, making its first attempt to break it. Volume on the bearish candle of 11 June increased noticeably, drawing attention to the significance of the attempted trendline break. Under such a scenario, the support level marked in green near $2.930 could come into focus for buyers.
The lower boundary of the horizontal profile at $3.030 and the point of control at $3.050–3.060 are positioned very close together, forming a cluster that could act as resistance should a recovery attempt develop. The RSI and its moving averages are currently reading 38/46/47. The oscillator remains below both moving averages but has not yet entered oversold territory, while the moving averages, highlighted in red, have yet to reach the lower boundary of the neutral zone at 45.
Key Takeaways
The inventory surplus in the United States and reduced export flows from US LNG terminals remain the dominant fundamental factors affecting the market. Technically, the price is testing the ascending trendline amid increased trading volume while remaining below the cluster formed by the profile’s lower boundary and the point of control. Further price action will largely depend on weather forecasts and the EIA’s weekly storage reports.
Start trading commodity CFDs with tight spreads (additional fees may apply). Open your trading account now or learn more about trading commodity CFDs with FXOpen.
This article represents the opinion of the Companies operating under the FXOpen brand only. It is not to be construed as an offer, solicitation, or recommendation with respect to products and services provided by the Companies operating under the FXOpen brand, nor is it to be considered financial advice.