
Sample Category Title
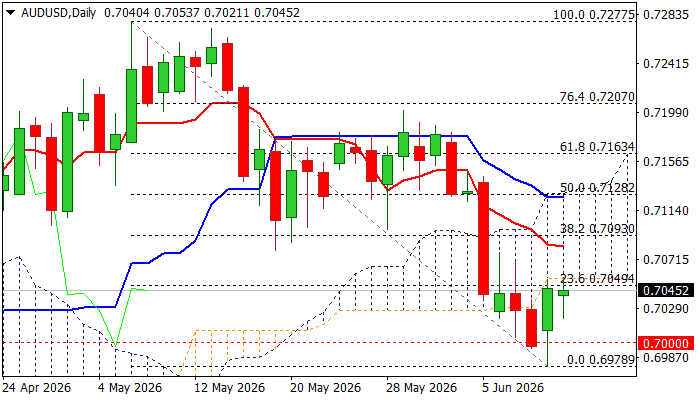
AUDUSD – Thick Daily Cloud Continues to Limit Recovery Attempts
Australian dollar remains at the front foot and continues to pressure strong barriers at 0.7050 zone (daily cloud base / Fibo 23.6% of 0.7277/0.6978) for the second consecutive day, but attempts to extend Thursday’s almost 1% advance, remain so far capped.
Strong bounce after repeated failure at 0.7000 support (psychological / Fibo 61.8% retracement of 0.6833/0.7277) started to lose traction under thick daily cloud which provides significant headwinds.
Near-term action is also weighed by predominantly bearish daily studies (strengthening negative momentum / 10/100 and 20/55DMA bear crosses) that challenges recovery attempts, although weekly Doji candle (after previous week’s large bearish candle) might signal developments of reversal pattern and fuel recovery.
Caution on repeated failure under cloud base that may deflate hopes for stronger advance, but also signal that traders reduce speed, ahead of RBA policy meeting next Tuesday (the central bank is expected to keep rates on hold at 4.35%, but may provide more details about their next steps in an environment of rising inflation and slower economic growth).
Res: 0.7050; 0.7083; 0.7108; 0.7129
Sup: 0.7021; 0.7000; 0.6978; 0.6938
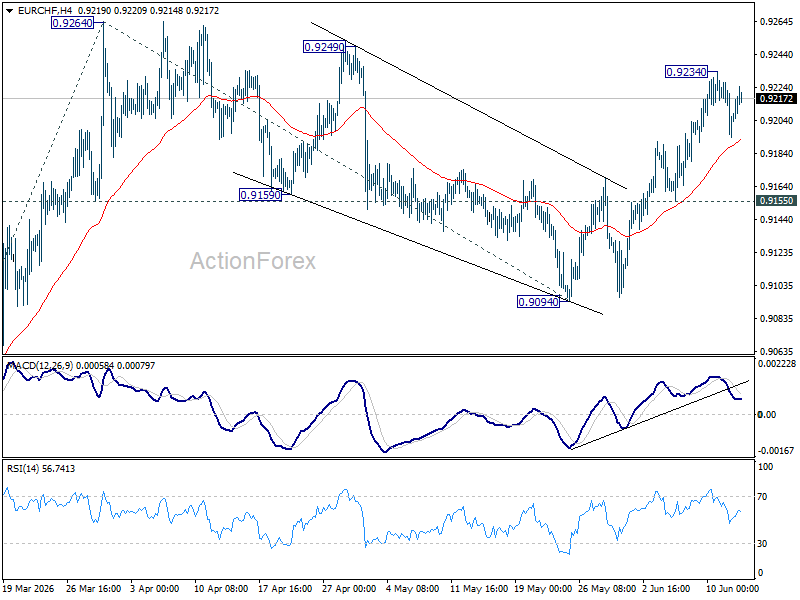
EUR/CHF Weekly Outlook
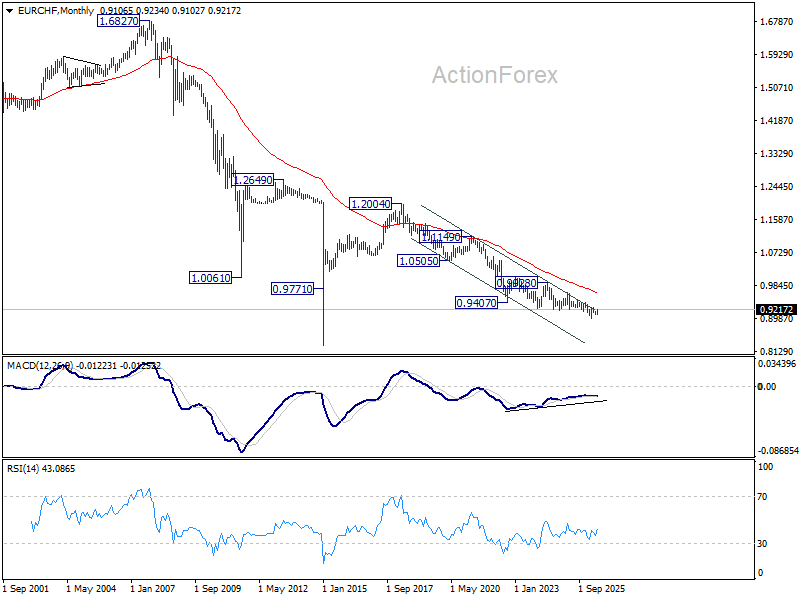
EUR/CHF rose further to 0.9234 last week but retreated since then. Initial bias remains neutral this week for some consolidations. Outlook is unchanged that corrective fall from 0.9264 should have completed at 0.9094. Above 0.9234 will bring retest of 0.9264 first. Firm break there will resume the rally from 0.8979 to 100% projection of 0.8979 to 0.9264 from 0.9094 at 0.9379. Risk will now stay on the upside as long as 0.9155 support holds.
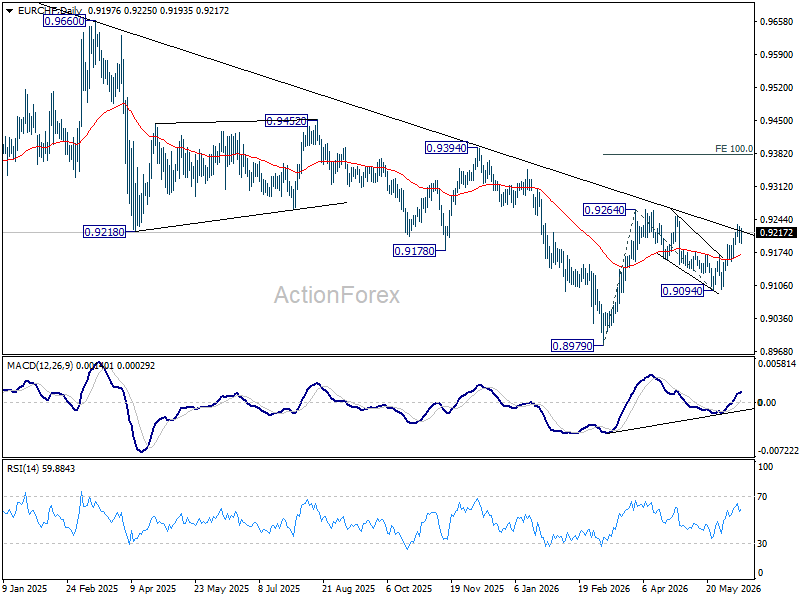
In the bigger picture, as long as 0.9394 resistance holds, down trend from 0.9928 (2024 high) could still be in progress. Firm break of 0.8979 will confirm down trend resumption. However, decisive break of 0.9394 will be an important sign of medium term bullish reversal.
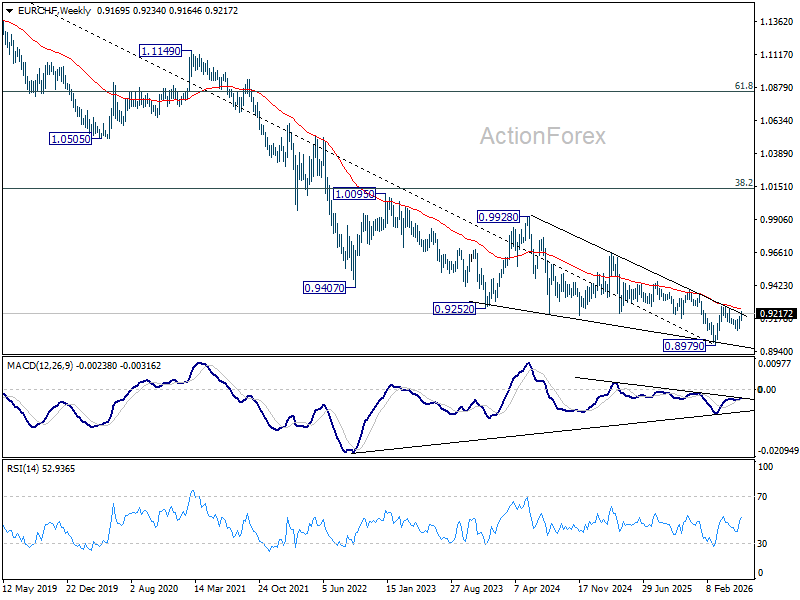
In the long term picture, outlook will stay bearish as long as 0.9407 support turned resistance (2022 low) holds. However, firm break of 0.9407 will argue that the down trend from 1.2004 (2018 high) has completed with five waves down to 0.8979. Stronger rebound should then be seen to 38.2% retracement of 1.2004 to 0.8979 at 1.0135 in the medium term.
The Weekly Bottom Line: Price Pressures Now on the Front Foot
Canada – Walking the Tightrope
The Bank of Canada took center stage this week, holding its policy rate at 2.25%. It reinforced a message that has become increasingly clear: Canada’s economic growth is soft at the same time that risks to inflation remain elevated. The tone of the announcement struck a careful balance. Policymakers acknowledged that growth disappointed in Q1 and that excess supply persists, but flagged that higher oil prices are complicating the inflation outlook, despite core inflation measures having recently eased toward target.
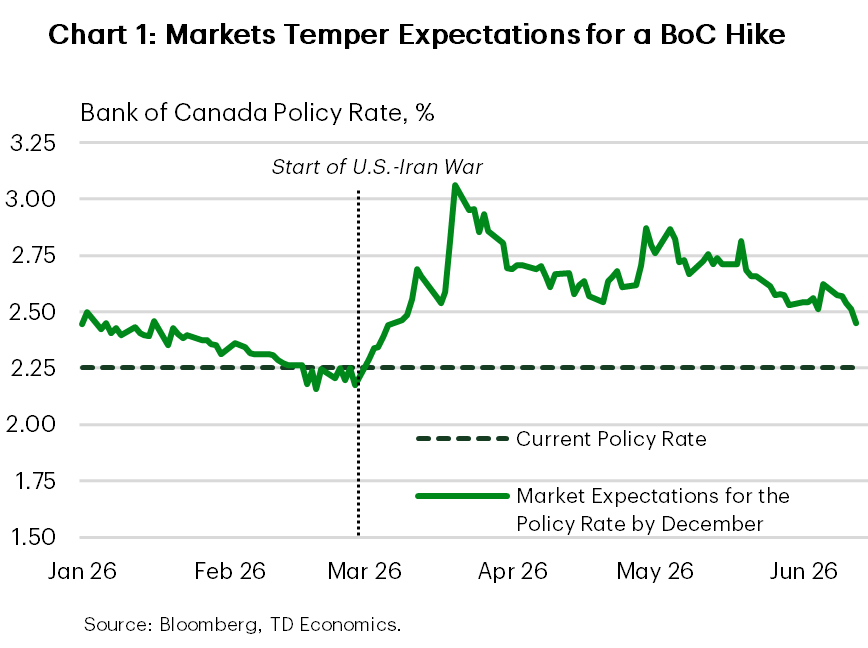
This leaves the BoC in a narrow channel for future policy decisions. Importantly, Governing Council preserved optionality in both directions, noting it could respond if growth deteriorates more sharply or if inflation pressures filter through to core inflation. Markets interpreted the message as modestly dovish, with pricing for a 25 basis points (bps) hike by year-end edging lower following the decision. Recall, at the onset of the war, markets expected up to three quarter-point hikes by December as inflation concerns dominated. In that sense, market expectations are converging to our view that the policy rate will stay on hold through the rest of the year (Chart 1). Elsewhere in financial markets, upward inflation and rate hike expectations in the U.S. pushed the CAD to a fresh 7-month low (0.7140/USD), while Canadian government bond yields dipped by roughly 10 bps across the curve.
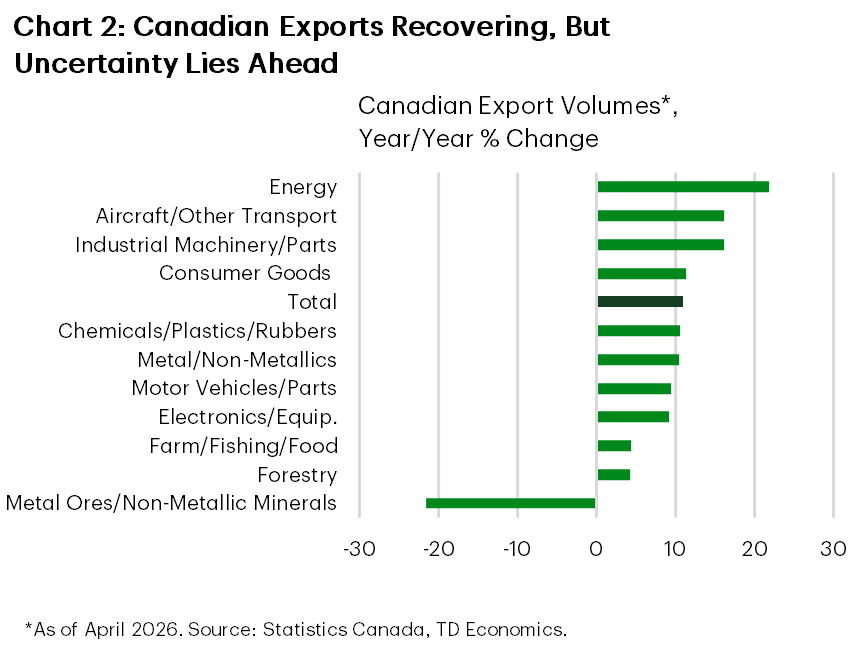
Away from monetary policy, this week’s data offered some constructive signals. Canada’s April merchandise trade surplus widened for a second consecutive month to the largest surplus since early 2025. While higher oil prices played a role, the details were encouraging: export volumes rose further and recent gains are reasonably broad-based (Chart 2). In other words underlying export momentum has improved after a weak start to the year. The upshot is that net trade now looks poised to contribute positively to Q2 growth, reversing its drag in Q1.
That improvement comes just as thse July 1 CUSMA review approaches. At this stage a timely renewal looks unlikely as negotiations have yet to gain steam. However, missing the deadline does not imply a collapse of the agreement. Instead, CUSMA would remain in force and would shift to rolling annual reviews, raising the spectre of prolonged negotiations and ongoing trade uncertainty. For the Canadian economy, that means that the backdrop remains unsettled, weighing on business confidence and investment decisions in the near-term.
Friday’s Q1 national balance sheet release added another piece to the puzzle. Household net worth rose 1.3% q/q, while the debt service ratio edged up to 14.8%, underscoring that while households continue to provide some support to activity, high debt burdens are a constraint for many. Taken together, this week’s developments point to an economy regaining its footing, but not yet strong enough – or stable enough – to declare the soft patch is over.
U.S. – Price Pressures Now on the Front Foot
Middle East tensions spiked and then eased again this week, with President Trump threatening new strikes on Iran and then calling them off as he noted progress toward a deal. WTI oil prices, which had been holding near $90/barrel, fell sharply toward $85/barrel. The 10-year Treasury yield also dipped initially, reflecting hopes that a resolution to the conflict would limit the energy shock’s spillover into broader inflation expectations, but recovered some lost ground later in the week as investors digested another firm inflation report.
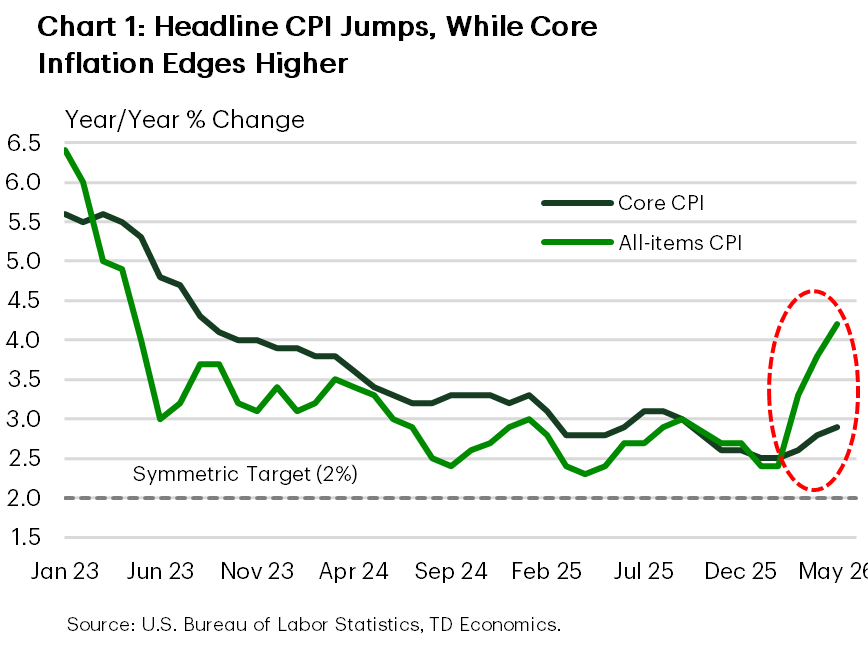
The May CPI report was the clearest evidence that inflation pressures continue to build. Headline inflation accelerated to the fastest pace in three years - 4.2% year-on-year (Chart 1). Higher energy costs accounted for the bulk of that increase. The gain in core inflation was more contained, but the annual rate still moved further above target (2.9% y/y), adding support to a “higher for longer” policy stance. Sifting through the details, shelter cooled after April’s outsized gain and core goods prices slipped, but non-housing services remained firm.
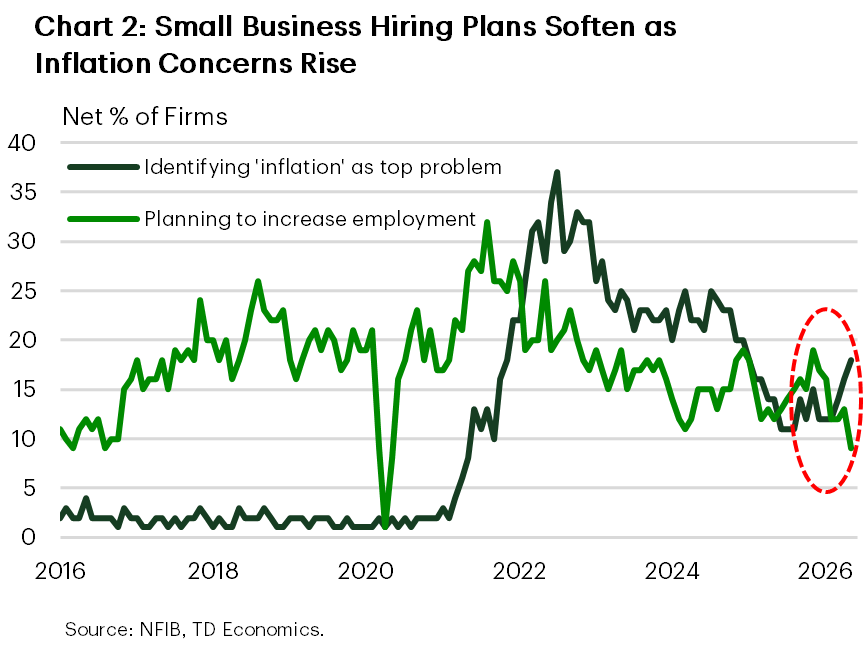
Inflation pressure was also evident in the NFIB small business survey, where a growing share of firms reported that they had raised average selling prices and that they planned further increases in the months ahead. This supports the view that higher energy and input costs are starting to ripple beyond the pump.
Housing offered a modest reprieve from the sour inflation news. Existing home sales rose a solid 3.2% in May to the highest level since December. Still, little has changed in the broader picture, with activity hovering near the 4-million mark for the third consecutive year and home price growth remaining in the slow lane.
Labor market signals, meanwhile, were mixed. Initial jobless claims ticked higher for the third week in a row but remained broadly range-bound, while continuing claims are still low by historical standards. Signals out of the small business survey, however, were less reassuring on this front. Small businesses are pointing to slower job creation ahead, with job openings and hiring plans softening recently amid an increase in inflation concerns (Chart 2).
All told, the effects of the Middle East conflict continue to show up in the data, and this is becoming harder for the Fed to ignore. Our view is that core inflation will likely remain elevated through year-end, supporting the case for an extended Fed pause. Next week marks Kevin Warsh’s first FOMC meeting as Chair. Markets will be watching not only for a clear rate signal, but also for clues on how he intends to communicate. Warsh has indicated a preference for a shift in communication strategy, like potentially not holding a press conference after every Fed meeting. We expect the committee to telegraph a “higher for longer” policy stance in its updated Summary of Economic Projections, which had reflected 25 bps of easing this year and next. It is also likely to drop its easing bias in the statement. This expected shift would move the Fed closer to market pricing, which now reflects a toss-up between “no action” and a 25-bps hike by year-end.
Economics Week Ahead
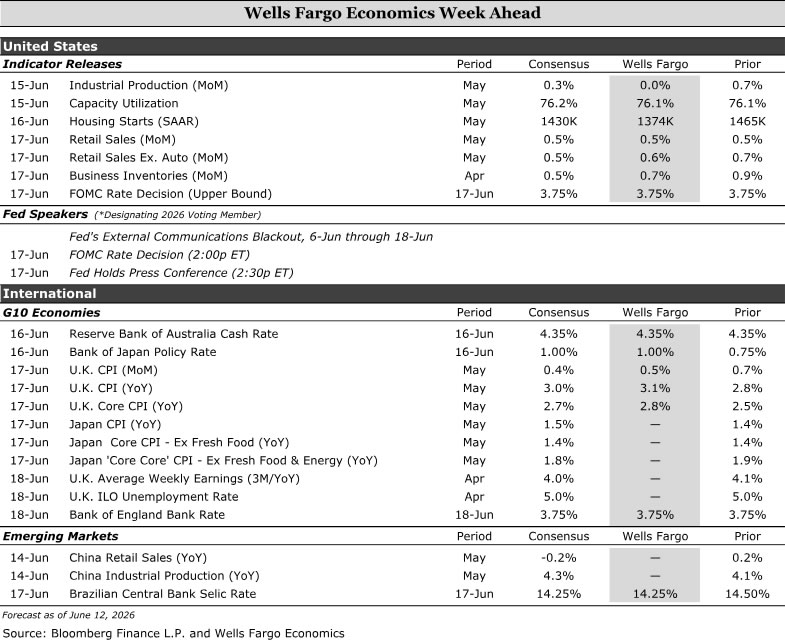
Next week’s calendar is dominated by central bank decisions, with policy paths still shaped by sticky inflation, softer growth and energy-driven uncertainty. We expect the FOMC to strike a neutral tone under Chair Warsh, with easing language likely removed but no clear tightening bias. U.S. retail sales should show consumer spending holding up, though higher gasoline prices are taking a larger share of the consumer wallet. In other advanced economies, the Bank of Japan is likely to hike 25 bps to 1.00%, while the Reserve Bank of Australia and Bank of England should hold for now as they wait for more evidence on inflation pass-through and growth. In emerging markets, we expect the Banco Central do Brasil to cut its Selic Rate by 25 bps to 14.25%, then pause, with easing resuming in Q4.
United States:
- FOMC (Wednesday), Retail Sales (Wednesday)
G10 Economies:
- Bank of Japan (Tuesday), Reserve Bank of Australia (Tuesday), Bank of England (Thursday)
Emerging Markets:
- Brazilian Central Bank (Wednesday)
U.S. Week Ahead
FOMC • Wednesday
We expect the theme of next week's FOMC meeting will be neutrality. This will be Kevin Warsh's first meeting as Chair, and we would be surprised if he rocks the boat at a precarious time for U.S. monetary policy. We doubt that Chair Warsh will be full-throated in favor of cutting rates in light of better labor market data and a core PCE deflator that is 130 bps over target. At the May meeting, the Committee debated removing the easing bias from the post-meeting statement, ultimately deciding in a divisive decision to leave it in. We believe that will change at this meeting with the removal of the phrase "the extent and timing of additional adjustments" to be replaced with something more neutral such as "In considering future adjustments to the target range for the federal funds rate, the Committee will...."
That said, we do not think most members of the FOMC, including the Chair, are ready to declare a tightening bias. Yes, the labor market data have been better lately, but there are few signs of overheating in wage growth or job openings, and the current unemployment rate (4.3%) is on the high end of the Committee's 4.0%–4.3% central tendency range for full employment. Furthermore, given that much of the excess inflation has been driven by supply shocks (tariffs, energy), we believe Chair Warsh will stress a patient and data dependent outlook in the presser.
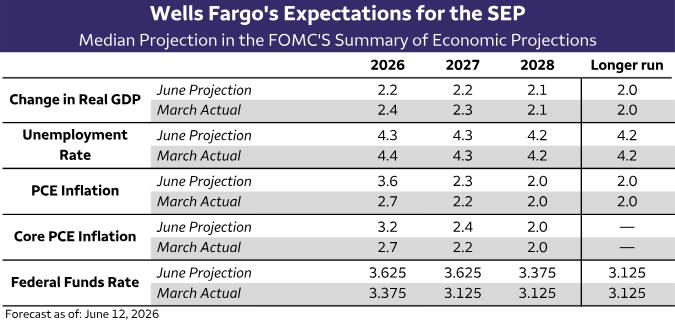
The dot plot looks like a close call. For starters, the dispersion of the dots is likely to tighten with Governor Miran’s low dot dropping out of the picture. The 2026 median dot should shift up to 3.625% thus removing the cut that was in place. Looking to 2027, our sense is this will be the linchpin for how the tone of the dots are perceived overall. If the Fed shows no cuts next year too (and assuming our view on their inflation call is right), they will be signaling a much tighter real rate, which would be an interesting way for the Committee to say they believe the backdrop warrants higher rates without actually hiking. In the end, while we think the dots will offer some interesting nuances, we think ultimately Warsh is likely to be fairly dismissive of the dots on balance.
Retail Sales • Wednesday
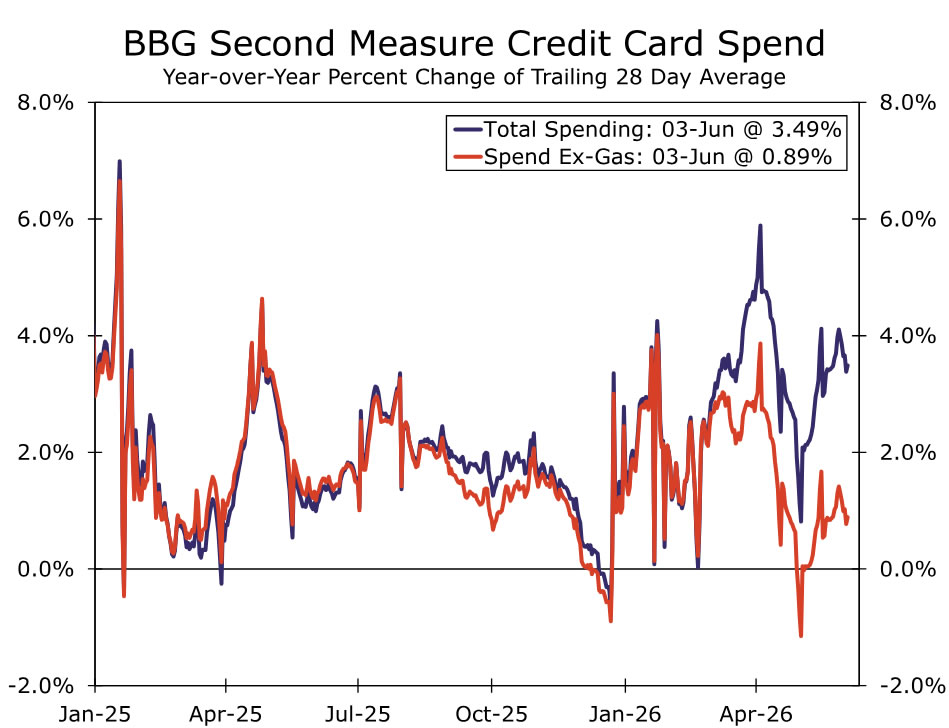
We will get a read on how consumer resilience is holding up in Q2 when the May retail sales report drops Wednesday morning. In April, nominal sales were boosted entirely by higher goods prices—particularly gasoline—while real retail sales slipped about 0.3%. There is little reason to expect a materially different story in May. Motor fuel prices rose another 6.8%, and high-frequency card data point to limited momentum outside of gas stations.
Control group sales (ex-gas, autos, building materials and restaurants) remained modestly positive in real terms, suggesting underlying spending has not rolled over. But the composition continues to do the heavy lifting—higher energy costs are increasingly taking first claim on the consumer wallet.
The upshot: spending is holding up for now, but the longer elevated energy prices persist alongside softer income growth, the greater the risk to broader demand. Next week’s report should show goods PCE started Q2 on a decent, but unspectacular, footing.
G10 Week Ahead
Bank of Japan • Tuesday
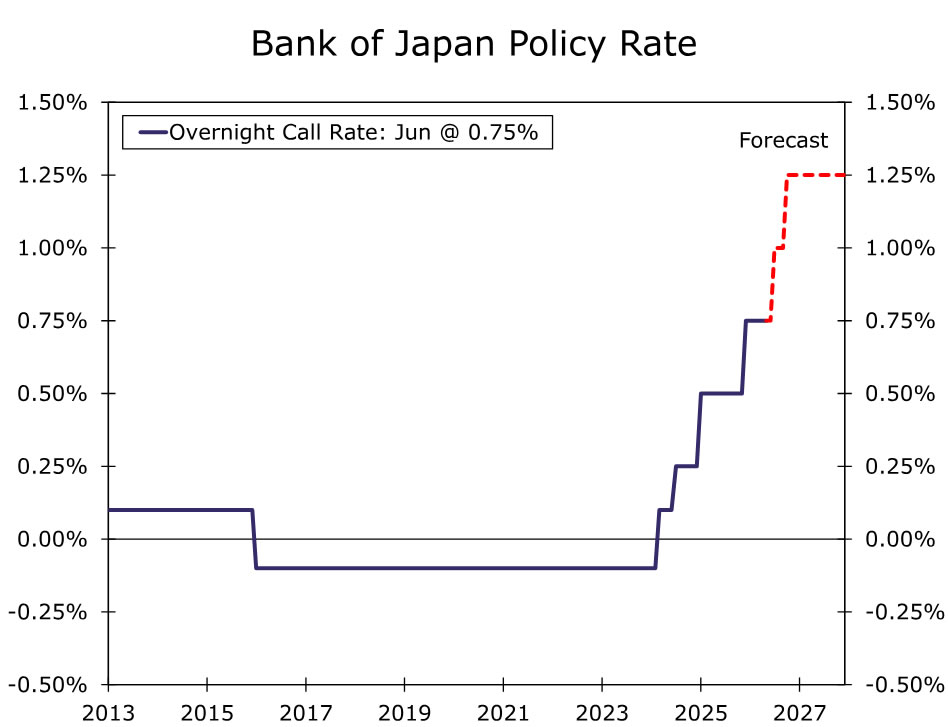
The Bank of Japan (BoJ) looks set to hike rates next week, with markets pricing a 97% probability of a 25 bps move to 1.00%. While the meeting is clearly “live” in our view, we see a non-trivial risk that the BoJ opts to hold. Easing geopolitical tensions around a potential US–Iran deal, alongside Governor Ueda’s recent hospitalization, could tilt the balance toward preserving optionality. That said, a near-term hike remains our base case. Abstracting from the highly uncertain outlook for commodity prices and global supply chains, which remain tightly linked to developments in the Middle East, domestic inflation dynamics are firming. Wage gains and fiscal support are set to push inflation higher with core-core measures (ex- food, energy and institutional factors) already at 2.8% year-over-year.
Whether the move comes in June or July, we expect the policy rate to reach 1.00% by end-Q3. Beyond that, we continue to see further tightening through year-end, taking rates to 1.25%, with additional hikes likely in 2027. Even then, policy would remain at the lower end of our estimated 1.0–2.5% neutral range. In the near term, we expect limited FX impact from a BoJ hike, with global drivers, particularly energy prices and Fed policy, continuing to dominate. However, this dynamic should shift over the medium-term. As the BoJ’s tightening cycle progresses and the global backdrop becomes more supportive, we see scope for a meaningful correction in the yen’s pronounced real trade-weighted undervaluation.
Reserve Bank of Australia • Tuesday
Reserve Bank of Australia (RBA) policymakers meet next week, and we expect them to keep the Cash Rate on hold at 4.35%. A hold would not necessarily signal the end of the tightening cycle. After three rate hikes this year, which addressed inflation pressures that were already elevated before the Middle East conflict, the RBA has room to wait for more evidence on monetary policy transmission.
April headline inflation eased to 4.2% year-over-year, helped by the government’s temporary fuel excise reduction. Still, automotive fuel prices were 23.5% above February levels, before the impact of the Middle East conflict, and the fuel relief measures are set to expire at the end of June. Underlying price pressures also remained firm, with trimmed mean inflation at 3.4% year-over-year. Wage risks have also moved back into focus. As part of the Annual Wage Review, the Fair Work Commission approved increases in modern award minimum wages and the National Minimum Wage, effective July 1. Although the increase was contained to some degree, it could still keep labor costs elevated and add to inflation persistence.
As such, we still see room for another rate hike in August, when policymakers should have more clarity on the economy, the Middle East conflict and the extent of pass-through to prices. That would bring the Cash Rate to a terminal rate of 4.60%, though risks are tilted to the downside if growth weakens sharply or pass-through remains contained.
Bank of England • Thursday
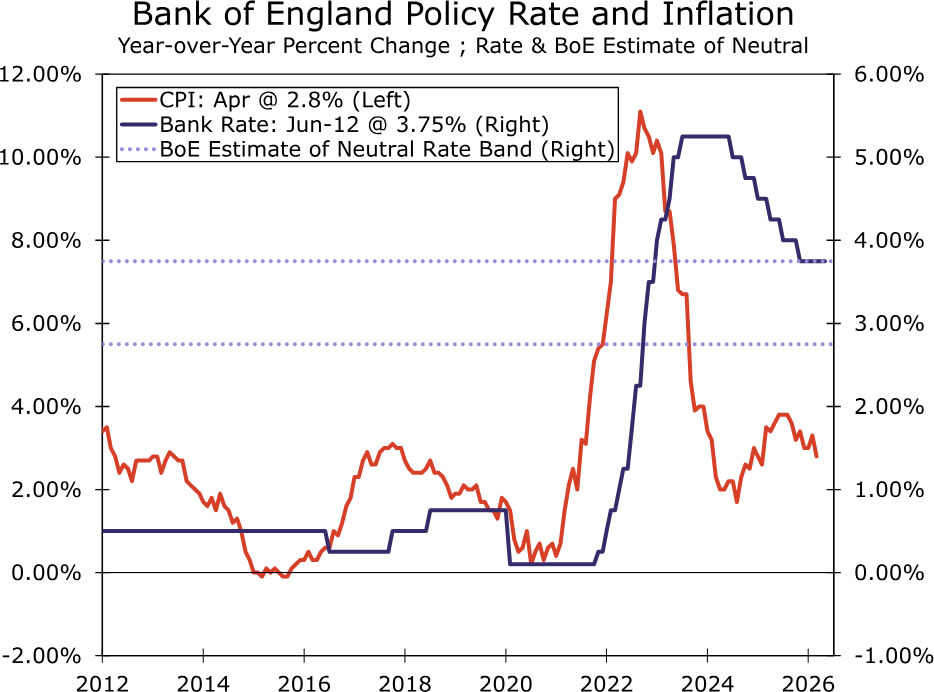
When Bank of England (BoE) policymakers meet next week, we expect them to leave Bank Rate on hold at 3.75%. The economy was subdued before the Middle East conflict, and policymakers had been expected to cut rates this year to support growth. That should keep the BoE cautious next week, even as some members may lean more hawkish and emphasize that they remain “ready to act.”
Recent data have been mixed enough to justify a hold for now. Q1 GDP surprised to the upside at 0.6% quarter-over-quarter, but much of that strength reflected pre-conflict conditions. April GDP then fell 0.1% month-over-month, which suggests momentum may already be softening. While April inflation remained contained at 2.8% year-over-year, higher energy prices should start to reverse the disinflation trend in the coming months. The BoE’s Inflation Attitudes Survey also showed a sharp rise in year-ahead household inflation expectations to 4.0%. At the same time, the labor market has weakened, with unemployment at 5.0% and forward-looking surveys pointing to softer labor demand.
As such, while we expect the BoE to stay on hold next week, we still see scope for tightening in H2 as second-round effects become more visible. We look for an initial 25 bps rate hike in Q3, potentially in July alongside the updated Monetary Policy Report, followed by another hike in Q4. That would bring Bank Rate to a terminal rate of 4.25%. Risks are tilted toward a more limited tightening cycle if growth weakens more sharply or the labor market loosens faster than expected.
EM Week Ahead
Brazilian Central Bank • Wednesday
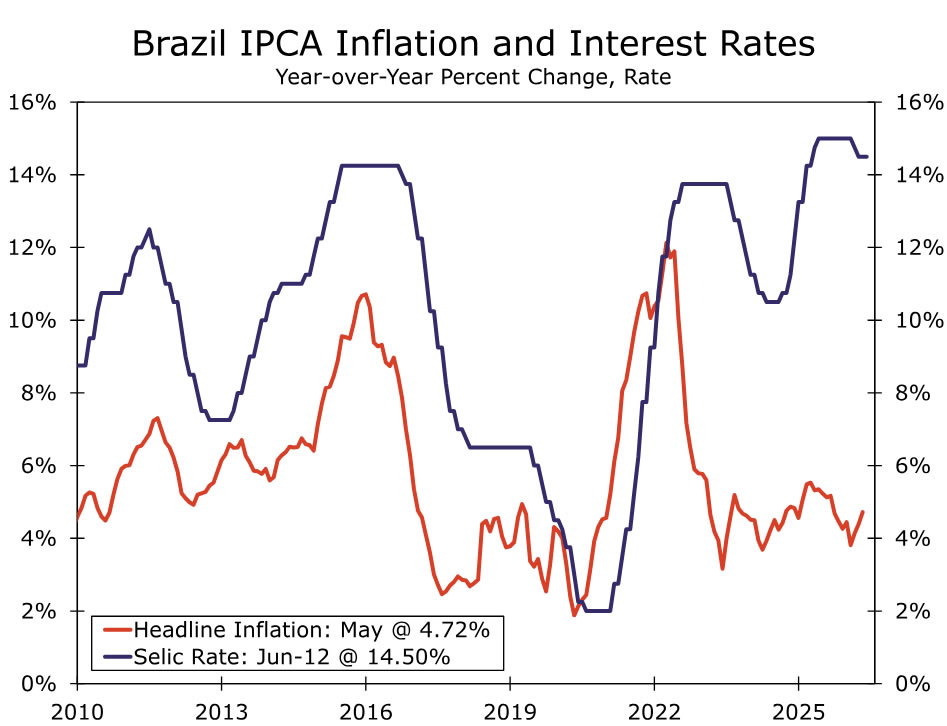
We expect the Banco Central do Brasil (BCB) to cut rates by 25 bps next week to 14.25%. Economic activity and domestic consumption have remained resilient despite high real interest rates, supported by directed credit programs, a strong labor market, rising real minimum wages and higher household incomes following tax reform. Inflation has picked up, rising to 4.72% in May, above the BCB’s 1.5–4.5% target range, while 12-month ahead inflation expectations remain stubbornly above 4%. The external backdrop of higher commodity prices is likely to be both inflationary and growth-supportive for Brazil, reflecting its net export position in energy, food and agricultural products.
On the political front, Lula continues to lead in the polls ahead of the October elections, with pre-election policy easing to address cost-of-living pressures posing upside risks to inflation. These dynamics are evident in inflation breakevens, which are at or above 6% across the curve from 1-year through 10-year tenors. Taken together, elevated inflation, political uncertainty and fiscal risks argue for a cautious approach beyond the June meeting. We expect the BCB to pause after this cut, with easing resuming in Q4. While our base case still incorporates further rate cuts in 2027, the market-implied policy path is likely to remain highly sensitive to both domestic developments and shifts in the global backdrop over the coming months.
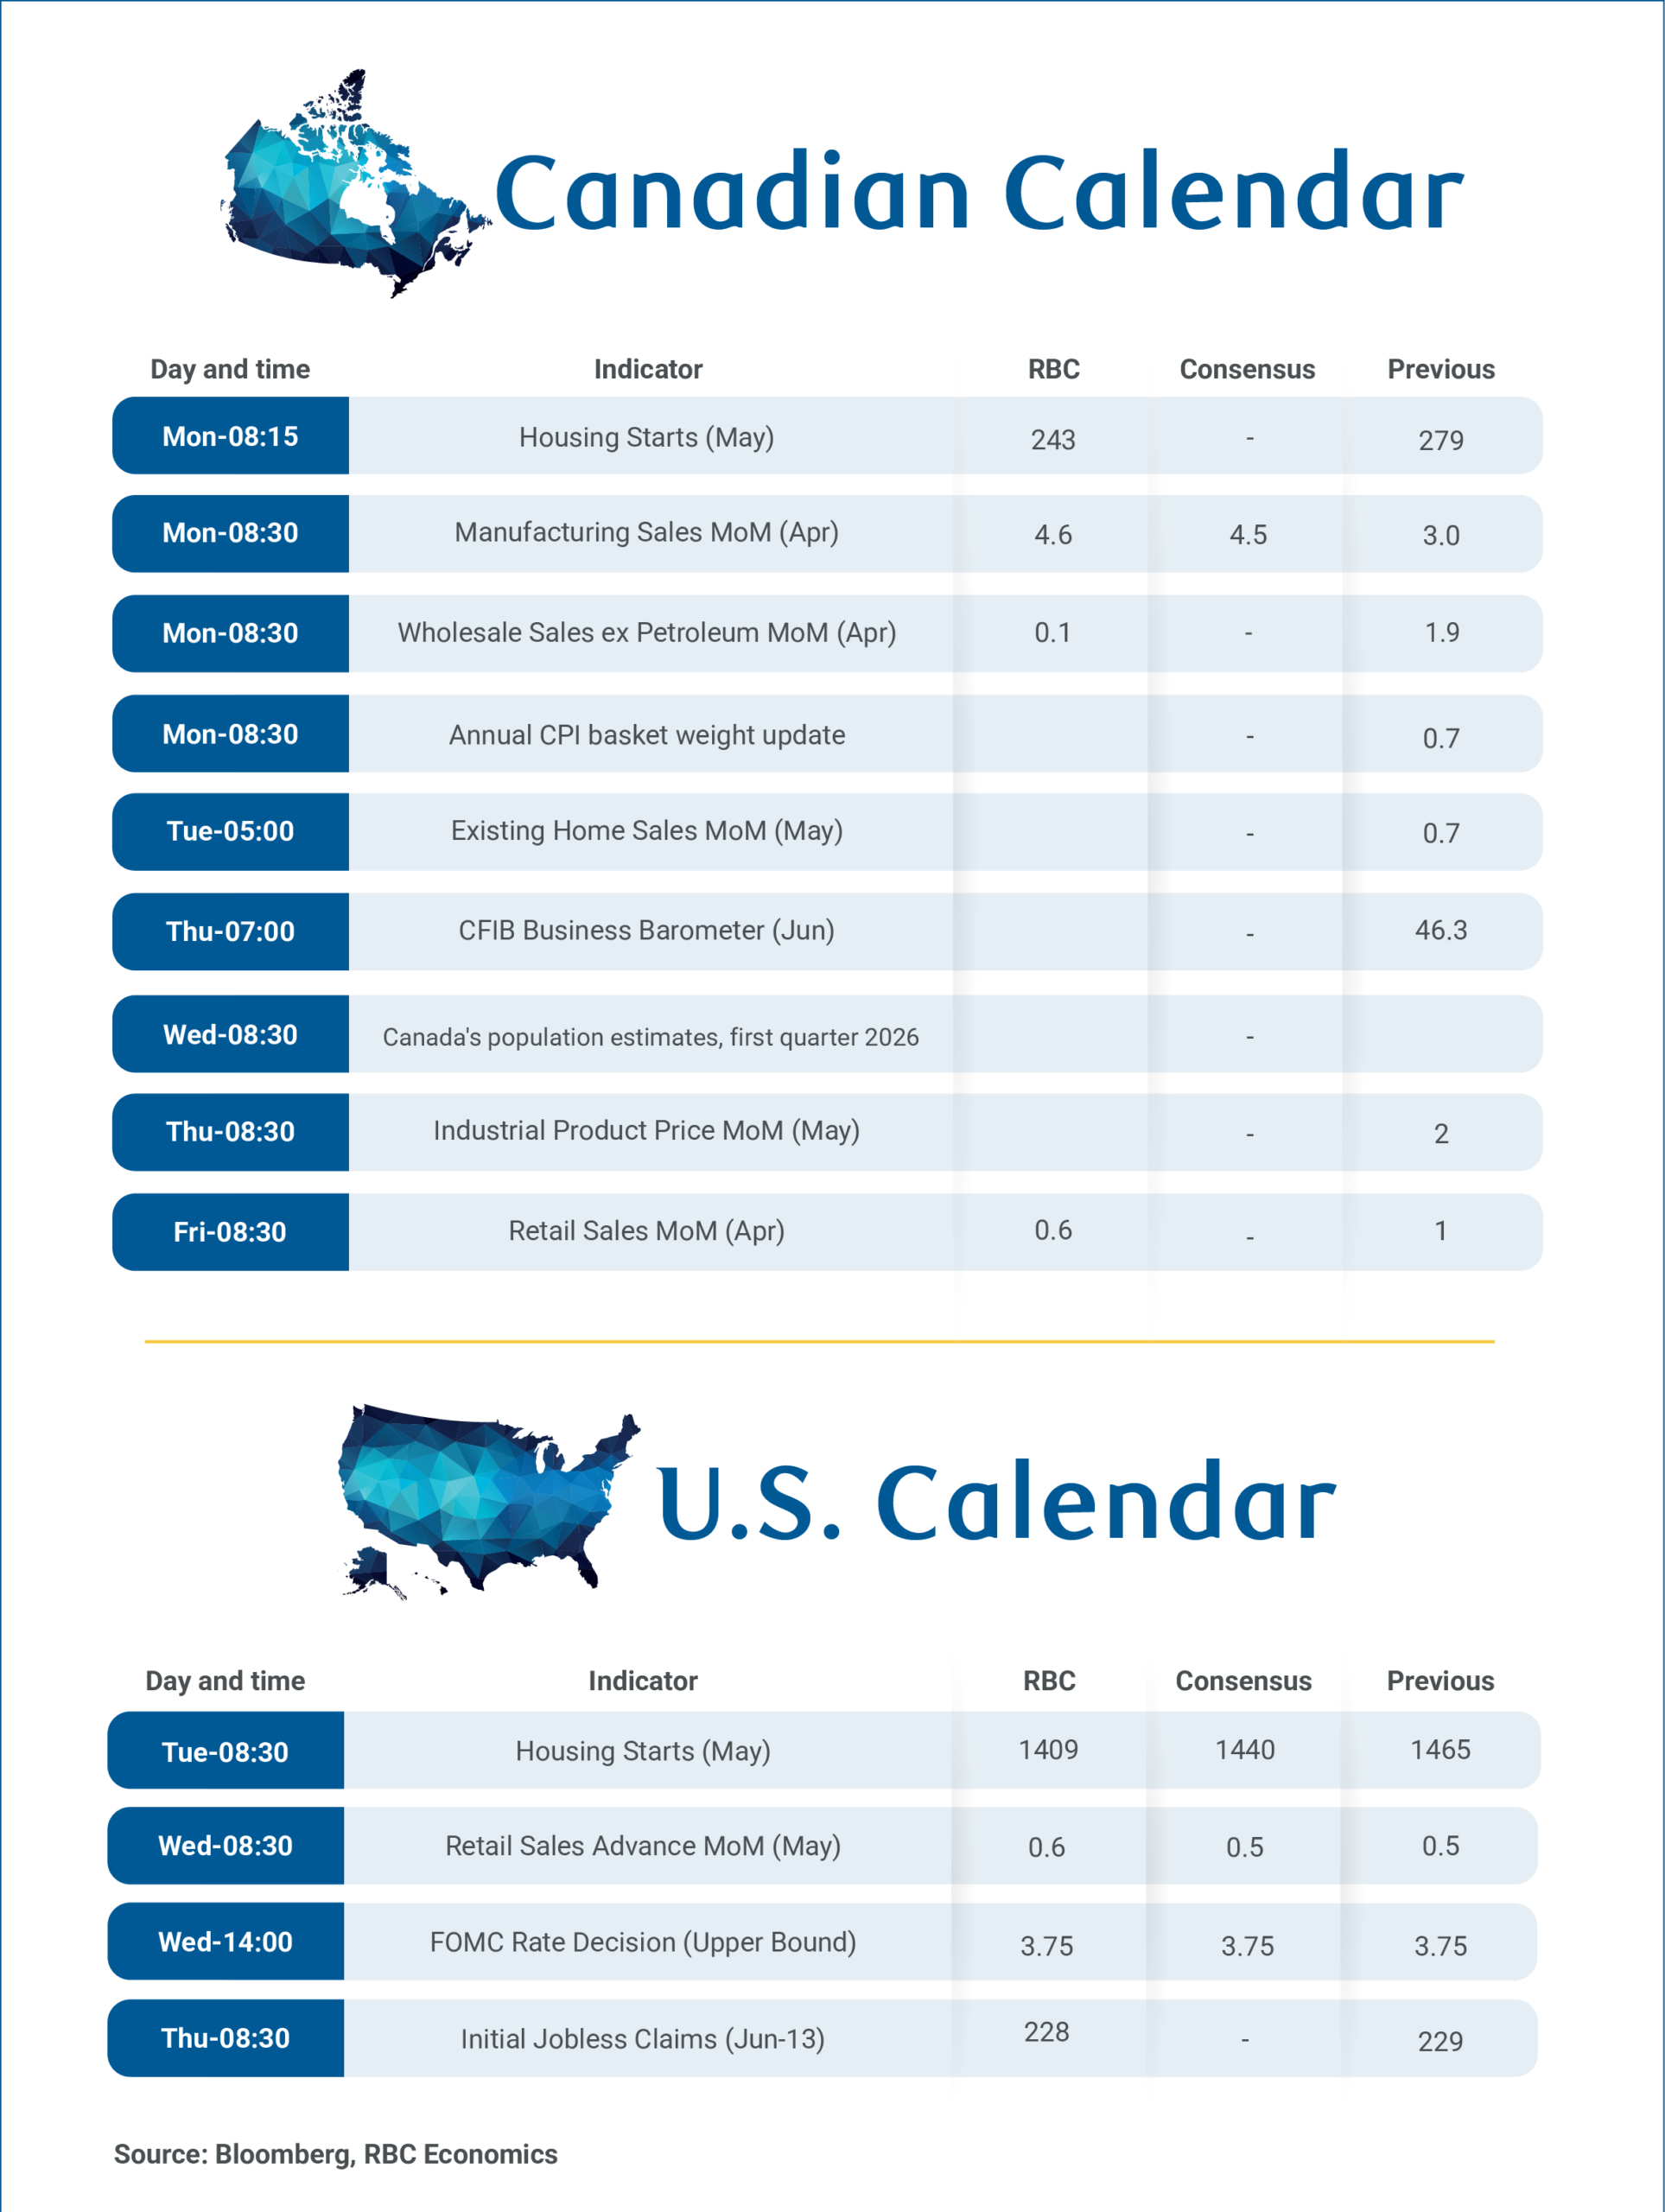
April’s Manufacturing, Wholesale and Retail Data to Point to Canada’s Growth Rebound
April’s manufacturing and wholesale reports on Monday and retail sales on Friday should support the Bank of Canada's (and our) outlook of Canada’s growth resuming in Q2 after Q1’s contraction.
Statistics Canada’s advanced estimate is a 4.6% rise in manufacturing sales, and a 0.6% increase in retail sales. Part of these reflect higher petroleum prices. But, manufacturing sales volume would still be up nearly 3% after accounting for that, and there’s little evidence so far that high gasoline prices are crowding out retail spending in other areas.
Wholesale sales (excluding petroleum) likely held onto strength in April after a larger 1.9% nominal increase (1.7% real) in March. Home resales in May should also point to further stabilization in housing markets with some of the least affordable and most depressed larger cities (like Toronto) showing green shoots in early reports.
Overall, data should be broadly consistent with the preliminary estimate that real Canadian gross domestic product rose 0.4% in April. However, these advance monthly production estimates have been highly volatile, prone to revisions, and are less reliable than usual as a gauge for quarterly GDP growth.
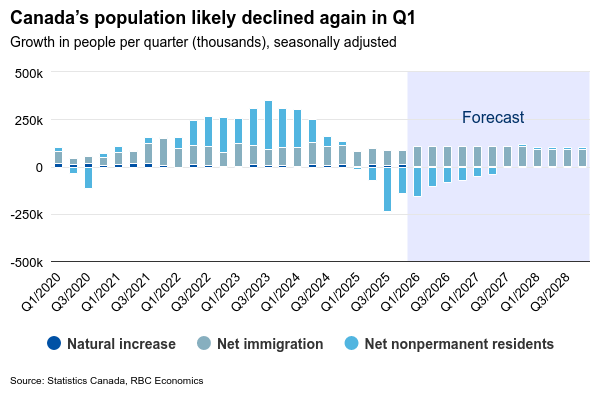
Importantly, headline GDP and employment data also remain heavily influenced by large population swings. Quarterly demographics’ estimates on Wednesday are expected to show a third consecutive decline in population in Q1 due to a rapidly shrinking pool of non-permanent residents. That should leave recent softer GDP numbers still looking better on a per-capita basis.
Warsh’s Fed moving further away from rate cuts
Between Canada and the U.S., we highlighted diverging macro trends with a stronger U.S. economy requiring the U.S. Federal Reserve to keep interest rates at higher levels than in Canada.
Our base case forecast, however, remains that the BoC and Fed will stay on the sidelines this year. We expect the FOMC to hold the Fed Funds rate steady on Wednesday, but move further away from a cutting bias towards a more neutral stance given the recent run of data.
U.S. labour market reports have consecutively surprised to the upside, alleviating concerns over the employment of the Fed’s dual mandate. In the meantime, headline U.S. inflation has risen on the back of surging gasoline prices and sticky core inflation. Attention next week will also be on the new Fed Governor Kevin Warsh, who will preside over his first FOMC meeting after taking office in May.
U.S. retail sales likely rose in May, but details will be closely watched for signs whether higher spending on gasoline from higher prices is beginning to squeeze spending on other products. U.S. consumer spending has remained resilient so far, but through a drawdown in savings that isn’t sustainable. Still, vehicle sales rose in May and we look for control sales (excluding gasoline, auto purchases, and building material store sales) to edge up 0.3%.
Summary 6/15 – 6/19
Monday, Jun 15, 2026
| GMT | Ccy | Events | Cons | Prev |
|---|---|---|---|---|
| 22:30 | NZD | Business NZ PSI May | 48.9 | |
| 04:30 | JPY | Tertiary Industry Index M/M Apr | 0.50% | -0.20% |
| 06:30 | CHF | Producer and Import Prices M/M May | 0.40% | 0.80% |
| 06:30 | CHF | Producer and Import Prices Y/Y May | -2.00% | |
| 09:00 | EUR | Eurozone Trade Balance (EUR) Apr | 7.8B | 3.5B |
| 09:00 | EUR | Eurozone Industrial Production M/M Apr | 0.20% | 0.20% |
| 12:15 | CAD | Housing Starts Y/Y May | 255K | 279K |
| 12:30 | CAD | Manufacturing Sales M/M Apr | 4.60% | 3.00% |
| 12:30 | CAD | Wholesale Sales M/M Apr | 0.10% | 1.90% |
| 12:30 | USD | Empire State Manufacturing Jun | 13.2 | 19.6 |
| 13:15 | USD | Industrial Production M/M May | 0.20% | 0.70% |
| 13:15 | USD | Capacity Utilization May | 76.20% | 76.10% |
| 14:00 | USD | NAHB Housing Market Index Jun | 37 | 37 |
| 22:30 | NZD |
| Business NZ PSI May | |
| Consensus | |
| Previous | 48.9 |
| 04:30 | JPY |
| Tertiary Industry Index M/M Apr | |
| Consensus | 0.50% |
| Previous | -0.20% |
| 06:30 | CHF |
| Producer and Import Prices M/M May | |
| Consensus | 0.40% |
| Previous | 0.80% |
| 06:30 | CHF |
| Producer and Import Prices Y/Y May | |
| Consensus | |
| Previous | -2.00% |
| 09:00 | EUR |
| Eurozone Trade Balance (EUR) Apr | |
| Consensus | 7.8B |
| Previous | 3.5B |
| 09:00 | EUR |
| Eurozone Industrial Production M/M Apr | |
| Consensus | 0.20% |
| Previous | 0.20% |
| 12:15 | CAD |
| Housing Starts Y/Y May | |
| Consensus | 255K |
| Previous | 279K |
| 12:30 | CAD |
| Manufacturing Sales M/M Apr | |
| Consensus | 4.60% |
| Previous | 3.00% |
| 12:30 | CAD |
| Wholesale Sales M/M Apr | |
| Consensus | 0.10% |
| Previous | 1.90% |
| 12:30 | USD |
| Empire State Manufacturing Jun | |
| Consensus | 13.2 |
| Previous | 19.6 |
| 13:15 | USD |
| Industrial Production M/M May | |
| Consensus | 0.20% |
| Previous | 0.70% |
| 13:15 | USD |
| Capacity Utilization May | |
| Consensus | 76.20% |
| Previous | 76.10% |
| 14:00 | USD |
| NAHB Housing Market Index Jun | |
| Consensus | 37 |
| Previous | 37 |
Tuesday, Jun 16, 2026
| GMT | Ccy | Events | Cons | Prev |
|---|---|---|---|---|
| 02:00 | CNY | Industrial Production Y/Y May | 4.20% | 4.10% |
| 02:00 | CNY | Retail Sales Y/Y May | 0.00% | 0.20% |
| 02:00 | CNY | Fixed Asset Investment (YTD) Y/Y May | -2.00% | -1.60% |
| 03:19 | JPY | BoJ Interest Rate Decision | 1.00% | 0.75% |
| 04:30 | AUD | RBA Interest Rate Decision | 4.35% | 4.35% |
| 05:30 | AUD | RBA Press Conference | ||
| 06:30 | JPY | BoJ Press Conference | ||
| 09:00 | EUR | Germany ZEW Economic Sentiment Jun | -6 | -10.2 |
| 09:00 | EUR | Germany ZEW Current Situation Jun | -77 | -77.8 |
| 09:00 | EUR | Eurozone ZEW Economic Sentiment Jun | -7.2 | -9.1 |
| 12:30 | USD | Building Permits May | 1.42M | 1.44M |
| 12:30 | USD | Housing Starts May | 1.42M | 1.47M |
| 12:30 | USD | Import Price Index M/M May | 0.90% | 1.90% |
| 02:00 | CNY |
| Industrial Production Y/Y May | |
| Consensus | 4.20% |
| Previous | 4.10% |
| 02:00 | CNY |
| Retail Sales Y/Y May | |
| Consensus | 0.00% |
| Previous | 0.20% |
| 02:00 | CNY |
| Fixed Asset Investment (YTD) Y/Y May | |
| Consensus | -2.00% |
| Previous | -1.60% |
| 03:19 | JPY |
| BoJ Interest Rate Decision | |
| Consensus | 1.00% |
| Previous | 0.75% |
| 04:30 | AUD |
| RBA Interest Rate Decision | |
| Consensus | 4.35% |
| Previous | 4.35% |
| 05:30 | AUD |
| RBA Press Conference | |
| Consensus | |
| Previous | |
| 06:30 | JPY |
| BoJ Press Conference | |
| Consensus | |
| Previous | |
| 09:00 | EUR |
| Germany ZEW Economic Sentiment Jun | |
| Consensus | -6 |
| Previous | -10.2 |
| 09:00 | EUR |
| Germany ZEW Current Situation Jun | |
| Consensus | -77 |
| Previous | -77.8 |
| 09:00 | EUR |
| Eurozone ZEW Economic Sentiment Jun | |
| Consensus | -7.2 |
| Previous | -9.1 |
| 12:30 | USD |
| Building Permits May | |
| Consensus | 1.42M |
| Previous | 1.44M |
| 12:30 | USD |
| Housing Starts May | |
| Consensus | 1.42M |
| Previous | 1.47M |
| 12:30 | USD |
| Import Price Index M/M May | |
| Consensus | 0.90% |
| Previous | 1.90% |
Wednesday, Jun 17, 2026
| GMT | Ccy | Events | Cons | Prev |
|---|---|---|---|---|
| 22:45 | NZD | Current Account (NZD) Q1 | -1.19B | -5.98B |
| 23:50 | JPY | Trade Balance (JPY) May | -0.21T | 0.24T |
| 23:50 | JPY | Machinery Orders M/M Apr | 4.10% | -9.40% |
| 00:30 | AUD | Westpac Leading Index M/M May | 0.05% | |
| 06:00 | GBP | CPI M/M May | 0.40% | 0.70% |
| 06:00 | GBP | CPI Y/Y May | 3.00% | 2.80% |
| 06:00 | GBP | Core CPI Y/Y May | 2.70% | 2.50% |
| 06:00 | GBP | RPI M/M May | 0.70% | |
| 06:00 | GBP | RPI Y/Y May | 3.30% | 3.00% |
| 06:00 | GBP | PPI - Input M/M May | 0.50% | 2.40% |
| 06:00 | GBP | PPI - Input Y/Y May | 8.80% | 7.70% |
| 06:00 | GBP | PPI - Output M/M May | 0.50% | 1.40% |
| 06:00 | GBP | PPI - Output Y/Y May | 4.00% | 4.00% |
| 06:00 | GBP | PPI Core Output M/M May | 0.40% | 0.70% |
| 06:00 | GBP | PPI Core Output Y/Y May | 2.40% | |
| 09:00 | EUR | Eurozone CPI Y/Y May F | 3.20% | 3.20% |
| 09:00 | EUR | Eurozone Core CPI Y/Y May F | 2.50% | 2.50% |
| 12:30 | CAD | New Housing Price Index M/M May | -0.10% | -0.40% |
| 12:30 | USD | Retail Sales M/M May | 0.50% | 0.50% |
| 12:30 | USD | Retail Sales ex Autos M/M May | 0.50% | 0.70% |
| 14:00 | USD | Pending Home Sales M/M May | 1.30% | 1.40% |
| 14:00 | USD | Business Inventories Apr | 0.50% | 0.90% |
| 14:30 | USD | Crude Oil Inventories (Jun 12) | -3.6M | -7.2M |
| 18:00 | USD | Fed Interest Rate Decision | 3.75% | 3.75% |
| 18:30 | USD | FOMC Press Conference |
| 22:45 | NZD |
| Current Account (NZD) Q1 | |
| Consensus | -1.19B |
| Previous | -5.98B |
| 23:50 | JPY |
| Trade Balance (JPY) May | |
| Consensus | -0.21T |
| Previous | 0.24T |
| 23:50 | JPY |
| Machinery Orders M/M Apr | |
| Consensus | 4.10% |
| Previous | -9.40% |
| 00:30 | AUD |
| Westpac Leading Index M/M May | |
| Consensus | |
| Previous | 0.05% |
| 06:00 | GBP |
| CPI M/M May | |
| Consensus | 0.40% |
| Previous | 0.70% |
| 06:00 | GBP |
| CPI Y/Y May | |
| Consensus | 3.00% |
| Previous | 2.80% |
| 06:00 | GBP |
| Core CPI Y/Y May | |
| Consensus | 2.70% |
| Previous | 2.50% |
| 06:00 | GBP |
| RPI M/M May | |
| Consensus | |
| Previous | 0.70% |
| 06:00 | GBP |
| RPI Y/Y May | |
| Consensus | 3.30% |
| Previous | 3.00% |
| 06:00 | GBP |
| PPI - Input M/M May | |
| Consensus | 0.50% |
| Previous | 2.40% |
| 06:00 | GBP |
| PPI - Input Y/Y May | |
| Consensus | 8.80% |
| Previous | 7.70% |
| 06:00 | GBP |
| PPI - Output M/M May | |
| Consensus | 0.50% |
| Previous | 1.40% |
| 06:00 | GBP |
| PPI - Output Y/Y May | |
| Consensus | 4.00% |
| Previous | 4.00% |
| 06:00 | GBP |
| PPI Core Output M/M May | |
| Consensus | 0.40% |
| Previous | 0.70% |
| 06:00 | GBP |
| PPI Core Output Y/Y May | |
| Consensus | |
| Previous | 2.40% |
| 09:00 | EUR |
| Eurozone CPI Y/Y May F | |
| Consensus | 3.20% |
| Previous | 3.20% |
| 09:00 | EUR |
| Eurozone Core CPI Y/Y May F | |
| Consensus | 2.50% |
| Previous | 2.50% |
| 12:30 | CAD |
| New Housing Price Index M/M May | |
| Consensus | -0.10% |
| Previous | -0.40% |
| 12:30 | USD |
| Retail Sales M/M May | |
| Consensus | 0.50% |
| Previous | 0.50% |
| 12:30 | USD |
| Retail Sales ex Autos M/M May | |
| Consensus | 0.50% |
| Previous | 0.70% |
| 14:00 | USD |
| Pending Home Sales M/M May | |
| Consensus | 1.30% |
| Previous | 1.40% |
| 14:00 | USD |
| Business Inventories Apr | |
| Consensus | 0.50% |
| Previous | 0.90% |
| 14:30 | USD |
| Crude Oil Inventories (Jun 12) | |
| Consensus | -3.6M |
| Previous | -7.2M |
| 18:00 | USD |
| Fed Interest Rate Decision | |
| Consensus | 3.75% |
| Previous | 3.75% |
| 18:30 | USD |
| FOMC Press Conference | |
| Consensus | |
| Previous | |
Thursday, Jun 18, 2026
| GMT | Ccy | Events | Cons | Prev |
|---|---|---|---|---|
| 22:45 | NZD | GDP Q/Q Q1 | 0.80% | 0.20% |
| 06:00 | GBP | Claimant Count Change May | 25.8K | 26.5K |
| 06:00 | GBP | Unemployment Rate Apr | 5.00% | 5.00% |
| 06:00 | GBP | Average Earnings Including Bonus 3M/Y Apr | 4.00% | 4.10% |
| 06:00 | GBP | Average Earnings Excluding Bonus 3M/Y Apr | 3.30% | 3.40% |
| 07:00 | CHF | SECO Economic Forecasts | ||
| 07:30 | CHF | SNB Interest Rate Decision | 0.00% | 0.00% |
| 08:00 | EUR | Eurozone Current Account (EUR) Apr | 18.5B | 14.9B |
| 11:00 | GBP | BoE Interest Rate Decision | 3.75% | 3.75% |
| 11:00 | GBP | MPC Official Bank Rate Votes | 1--0--8 | 1--0--8 |
| 12:30 | CAD | Raw Material Price Index May | 1.80% | 2.60% |
| 12:30 | CAD | Industrial Product Price M/M May | 1.40% | 2.00% |
| 12:30 | USD | Initial Jobless Claims (Jun 12) | 232K | 229K |
| 12:30 | USD | Philadelphia Fed Manufacturing Jun | 10 | -0.4 |
| 14:30 | USD | Natural Gas Storage (Jun 12) | 72.5B | 108B |
| 22:45 | NZD |
| GDP Q/Q Q1 | |
| Consensus | 0.80% |
| Previous | 0.20% |
| 06:00 | GBP |
| Claimant Count Change May | |
| Consensus | 25.8K |
| Previous | 26.5K |
| 06:00 | GBP |
| Unemployment Rate Apr | |
| Consensus | 5.00% |
| Previous | 5.00% |
| 06:00 | GBP |
| Average Earnings Including Bonus 3M/Y Apr | |
| Consensus | 4.00% |
| Previous | 4.10% |
| 06:00 | GBP |
| Average Earnings Excluding Bonus 3M/Y Apr | |
| Consensus | 3.30% |
| Previous | 3.40% |
| 07:00 | CHF |
| SECO Economic Forecasts | |
| Consensus | |
| Previous | |
| 07:30 | CHF |
| SNB Interest Rate Decision | |
| Consensus | 0.00% |
| Previous | 0.00% |
| 08:00 | EUR |
| Eurozone Current Account (EUR) Apr | |
| Consensus | 18.5B |
| Previous | 14.9B |
| 11:00 | GBP |
| BoE Interest Rate Decision | |
| Consensus | 3.75% |
| Previous | 3.75% |
| 11:00 | GBP |
| MPC Official Bank Rate Votes | |
| Consensus | 1--0--8 |
| Previous | 1--0--8 |
| 12:30 | CAD |
| Raw Material Price Index May | |
| Consensus | 1.80% |
| Previous | 2.60% |
| 12:30 | CAD |
| Industrial Product Price M/M May | |
| Consensus | 1.40% |
| Previous | 2.00% |
| 12:30 | USD |
| Initial Jobless Claims (Jun 12) | |
| Consensus | 232K |
| Previous | 229K |
| 12:30 | USD |
| Philadelphia Fed Manufacturing Jun | |
| Consensus | 10 |
| Previous | -0.4 |
| 14:30 | USD |
| Natural Gas Storage (Jun 12) | |
| Consensus | 72.5B |
| Previous | 108B |
Friday, Jun 19, 2026
| GMT | Ccy | Events | Cons | Prev |
|---|---|---|---|---|
| 22:45 | NZD | Trade Balance (NZD) May | 875M | 1920M |
| 23:01 | GBP | GfK Consumer Confidence Jun | -23 | -23 |
| 23:30 | JPY | National CPI Y/Y May | 1.40% | |
| 23:30 | JPY | National CPI Core Y/Y May | 1.40% | 1.40% |
| 23:30 | JPY | National CPI Core-Core Y/Y May | 1.90% | |
| 23:50 | JPY | BoJ Minutes | ||
| 06:00 | GBP | Retail Sales M/M May | 0.50% | -1.30% |
| 06:00 | EUR | Germany PPI M/M May | 0.80% | 1.20% |
| 06:00 | EUR | Germany PPI Y/Y May | 2.50% | 1.70% |
| 06:00 | GBP | Public Sector Net Borrowing (GBP) May | 18.9B | 24.3B |
| 12:30 | CAD | Retail Sales M/M Apr | 0.60% | 0.90% |
| 12:30 | CAD | Retail Sales ex Autos M/M Apr | 0.70% | 1.40% |
| 22:45 | NZD |
| Trade Balance (NZD) May | |
| Consensus | 875M |
| Previous | 1920M |
| 23:01 | GBP |
| GfK Consumer Confidence Jun | |
| Consensus | -23 |
| Previous | -23 |
| 23:30 | JPY |
| National CPI Y/Y May | |
| Consensus | |
| Previous | 1.40% |
| 23:30 | JPY |
| National CPI Core Y/Y May | |
| Consensus | 1.40% |
| Previous | 1.40% |
| 23:30 | JPY |
| National CPI Core-Core Y/Y May | |
| Consensus | |
| Previous | 1.90% |
| 23:50 | JPY |
| BoJ Minutes | |
| Consensus | |
| Previous | |
| 06:00 | GBP |
| Retail Sales M/M May | |
| Consensus | 0.50% |
| Previous | -1.30% |
| 06:00 | EUR |
| Germany PPI M/M May | |
| Consensus | 0.80% |
| Previous | 1.20% |
| 06:00 | EUR |
| Germany PPI Y/Y May | |
| Consensus | 2.50% |
| Previous | 1.70% |
| 06:00 | GBP |
| Public Sector Net Borrowing (GBP) May | |
| Consensus | 18.9B |
| Previous | 24.3B |
| 12:30 | CAD |
| Retail Sales M/M Apr | |
| Consensus | 0.60% |
| Previous | 0.90% |
| 12:30 | CAD |
| Retail Sales ex Autos M/M Apr | |
| Consensus | 0.70% |
| Previous | 1.40% |
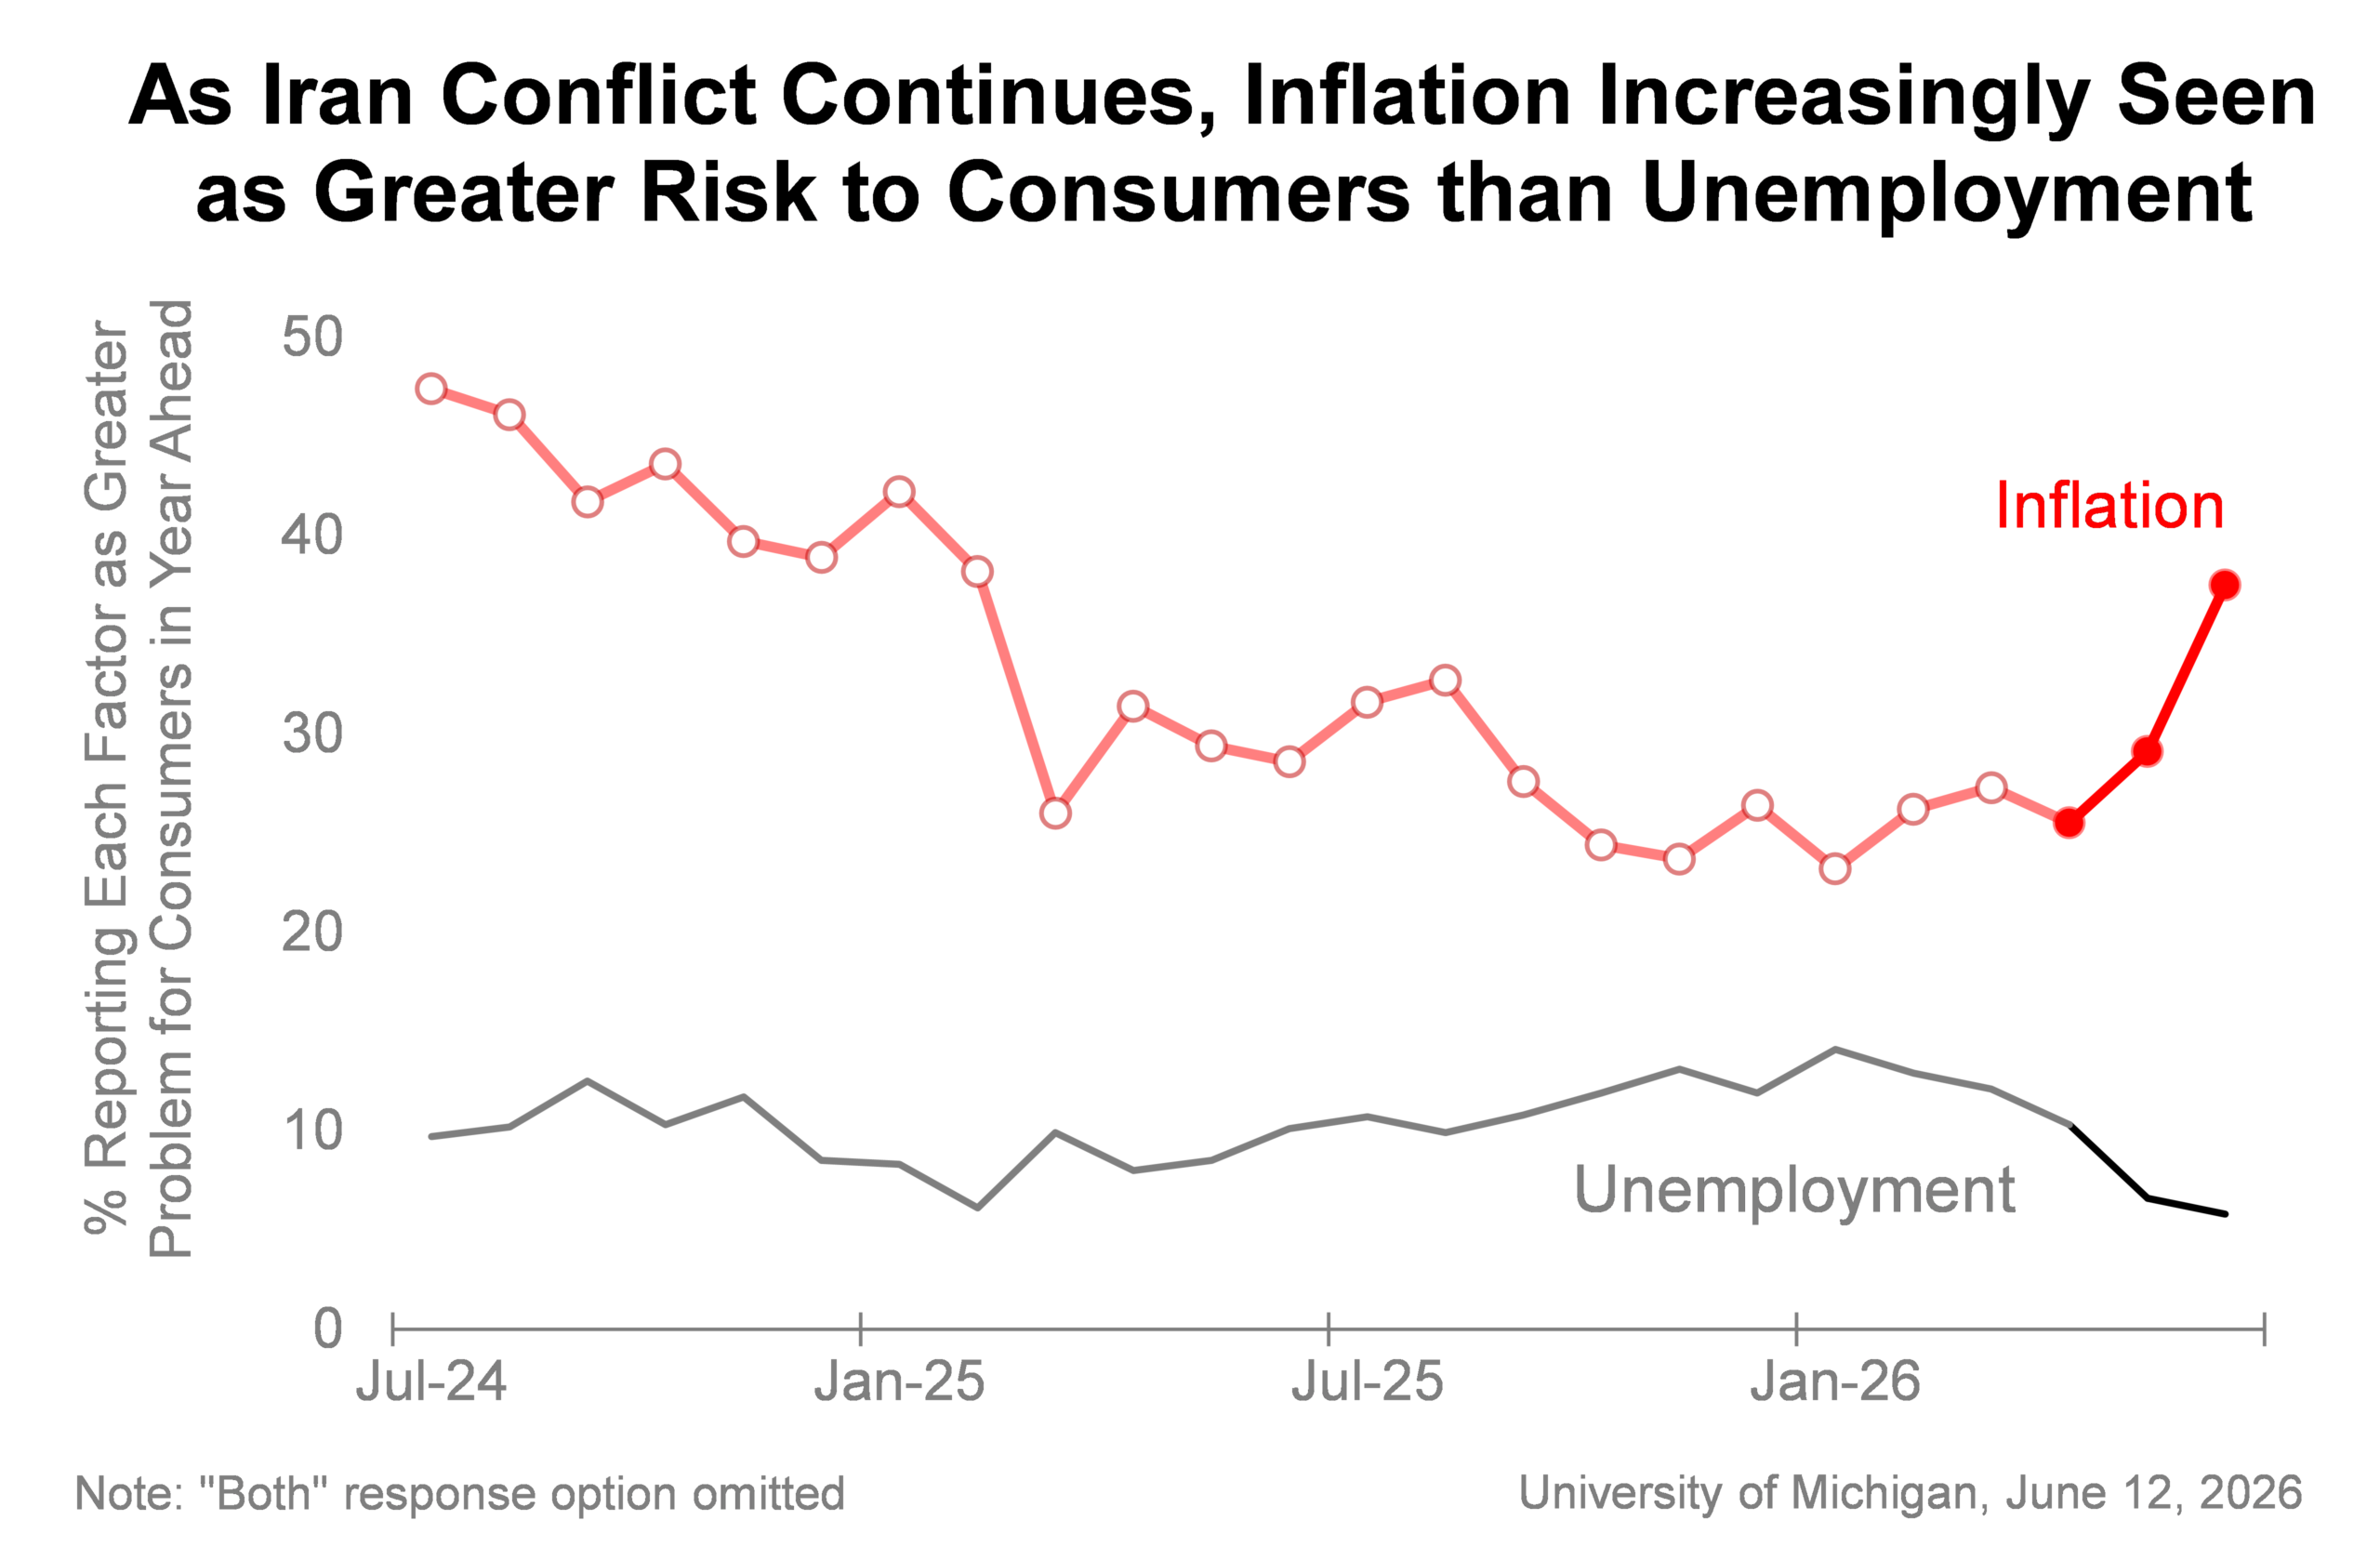
US Michigan Consumer Sentiment Improves in June, But Inflation Worries Remain Elevated
US consumer sentiment improved noticeably in June, with the University of Michigan's headline index rising from 44.8 to 48.9 as easing gasoline prices provided some relief to households. The gain was broad-based, with improvements recorded across age groups, education levels and political affiliations. The Current Economic Conditions index rose from 45.8 to 48.3, while Consumer Expectations climbed from 44.1 to 49.3, suggesting consumers became somewhat less pessimistic about both present conditions and the outlook ahead.
According to Surveys of Consumers Director Joanne Hsu, the improvement was largely driven by lower fuel costs early in the month. "Consumers experienced some relief due to the early-month easing in gasoline prices," she noted. Assessments of personal finances and business conditions also improved. However, Hsu cautioned that overall sentiment remains historically weak. Despite June's rebound, consumer confidence is still 13% below its January level and 19% lower than a year ago, reflecting continued concerns about rising living costs and the broader inflation environment.
Inflation expectations eased modestly but remain elevated. One-year inflation expectations edged down from 4.8% to 4.6%, while long-run expectations fell from 3.9% to 3.4%. Even so, both measures remain well above levels seen before the outbreak of the Iran conflict.
The data suggests consumers are becoming slightly less worried about near-term price pressures as energy costs retreat, but concerns that inflation could remain stubbornly high continue to weigh heavily on household sentiment.
| Indicator | Jun | May | Change |
|---|---|---|---|
| Consumer Sentiment | 48.9 | 44.8 | +4.1 |
| Current Economic Conditions | 48.3 | 45.8 | +2.5 |
| Consumer Expectations | 49.3 | 44.1 | +5.2 |
| 1-Year Inflation Expectations | 4.6% | 4.8% | -0.2ppt |
| Long-Run Inflation Expectations | 3.4% | 3.9% | -0.5ppt |
BoJ Set to Hike, but Will It Save the Yen?
- BoJ expected to lift rates to 1.0% amid energy crisis.
- But will it be a hawkish enough hike to offer the yen a lifeline?
- Government subsidies skew inflation data but wage growth accelerates.
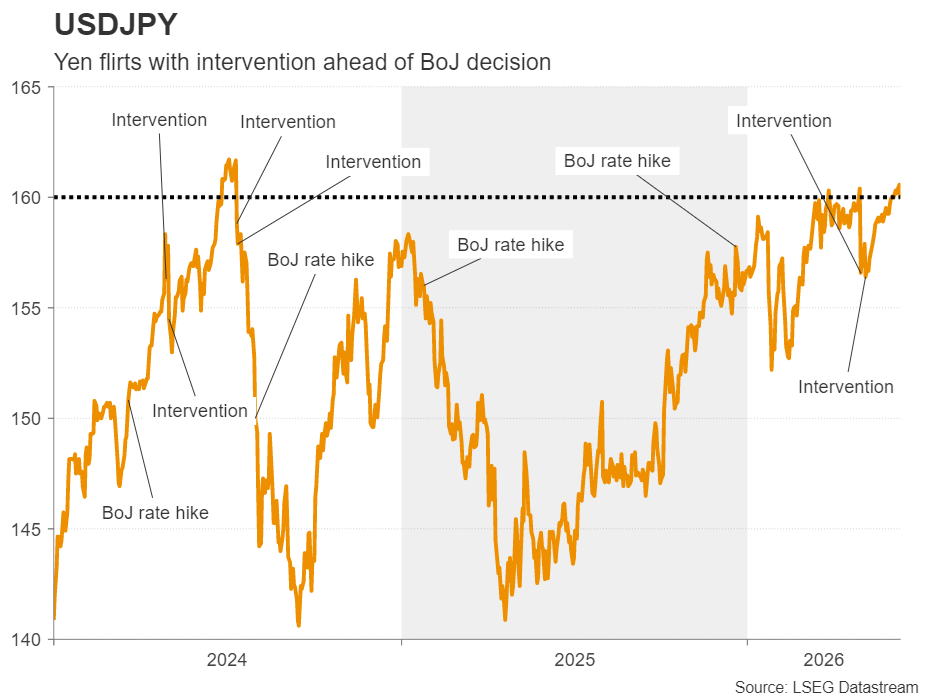
- Intervention risks remain high ahead of Tuesday’s decision.
Policy Rate to Rise to 31-Year High
The Bank of Japan is poised to hike interest rates for the fifth time in this tightening cycle on Tuesday, taking the policy rate from 0.75% to 1.00%. As has become customary for BoJ rate hikes lately, the hawkish rhetoric has been intensifying in the run up to the meeting, with Governor Ueda essentially locking in the move in his last appearance on June 3.
Yet, markets have only priced in around a 90% probability for a 25-bps hike next week, as persistent doubts about the BoJ’s commitment to policy normalization continue to dog the rate outlook, and in turn, the yen. Policymakers have been getting itchy about second-round effects of inflation, as energy prices remain elevated amid the ongoing blockade of the Strait of Hormuz.
Price Pressures Are Growing Despite CPI Fall
The longer oil and gas flows through the crucial Middle East shipping lane stay at a trickle of pre-war levels, the greater the risk that higher energy prices will spill over onto other sectors of the economy.
However, inflation for now appears to be heading lower, mainly due to government support measures to help households with the cost-of-living crisis. Fuel and education subsidies pushed both headline and core CPI down to 1.4% y/y in April, while the Takaichi government has announced a new fiscal package to lower energy bills from July to September.
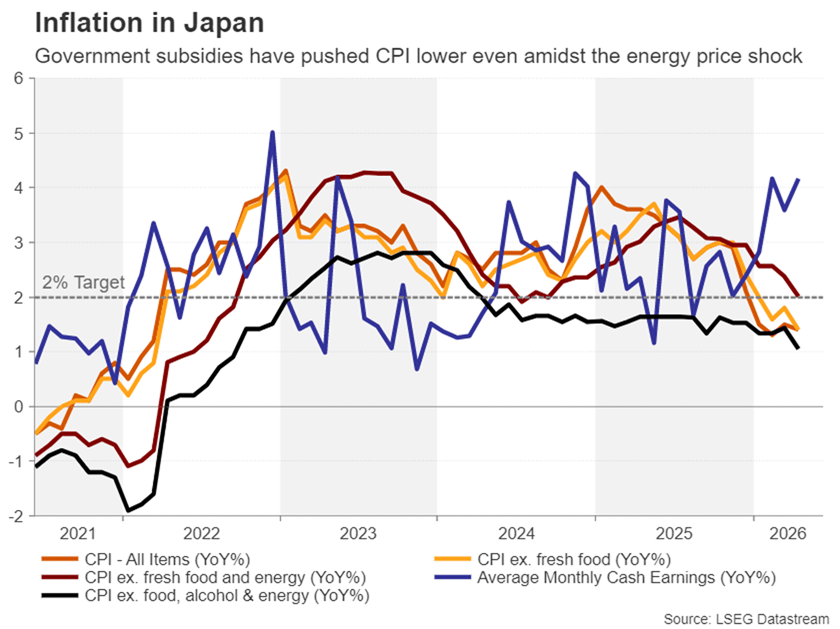
Under the hood, however, price pressures are brewing. Wage growth has exceeded 3.0% - a level seen as crucial by the BoJ for sustainably meeting its 2% inflation target - for most of 2026. Producer prices have also accelerated sharply in recent months, as the weaker yen has exacerbated higher import costs on top of the surging oil prices.
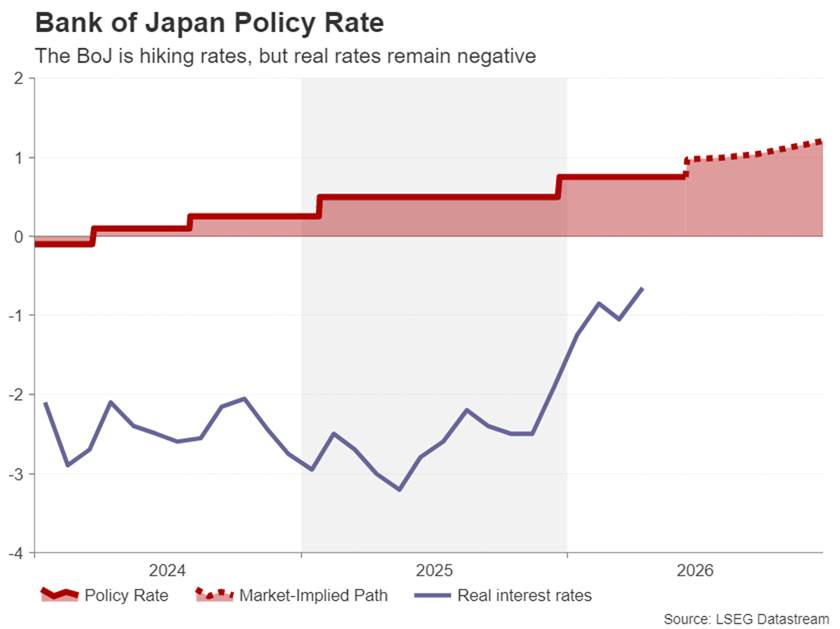
The BoJ’s Complicated Path
More importantly, despite the series of rate hikes since March 2024, real interest rates in Japan remain negative, meaning monetary policy is still highly accommodative. The Bank of Japan has been eager to point this out to signal it has plenty of scope to continue raising rates. Yet, there is a real risk the Bank of Japan has already fallen too far behind the curve and it should tighten policy at a much faster pace.
The election of Prime Minister Sanae Takaichi has added to the controversy for policymakers to proceed more hawkishly, as the new government has been vocal about being opposed to higher interest rates.
So where does all this leave the yen? The beleaguered Japanese currency has been under constant selling pressure since Takaichi came into power. The energy crisis has further cast doubt on rate hike bets on expectations that the BoJ will prioritize growth over inflation whilst the Middle East turmoil unfolds.
Yields Surge, but Yen Flounders
In contrast, long-term Japanese government borrowing costs have soared. The 10-year yield is at near 30-decade highs and the 30-year yield at historic highs. But concerns about Japan’s mounting national debt have been a bigger driver than inflation, hence, the boost to the yen has been limited.
However, even as the BoJ is likely to raise rates by a further 25 bps on Tuesday, not much is expected to change in its stance. Unless policymakers are in a position to signal a shift to more aggressive tightening, the yen will continue to struggle.
Yen Reaction in Ueda’s Deputy’s Hands
Following his sudden hospitalization, Governor Kazuo Ueda will not attend the June 16 meeting, which will now be chaired by Deputy Governor Ryozo Himino, while the press conference will be conducted by his other deputy, Shinichi Uchida.
Either way, whoever appears at the podium will have to pick his words carefully, as the slightest disappointment could trigger fresh selling in the yen. With the 160-level already being tested, a not-so-hawkish outcome could propel the US dollar towards 162 yen.
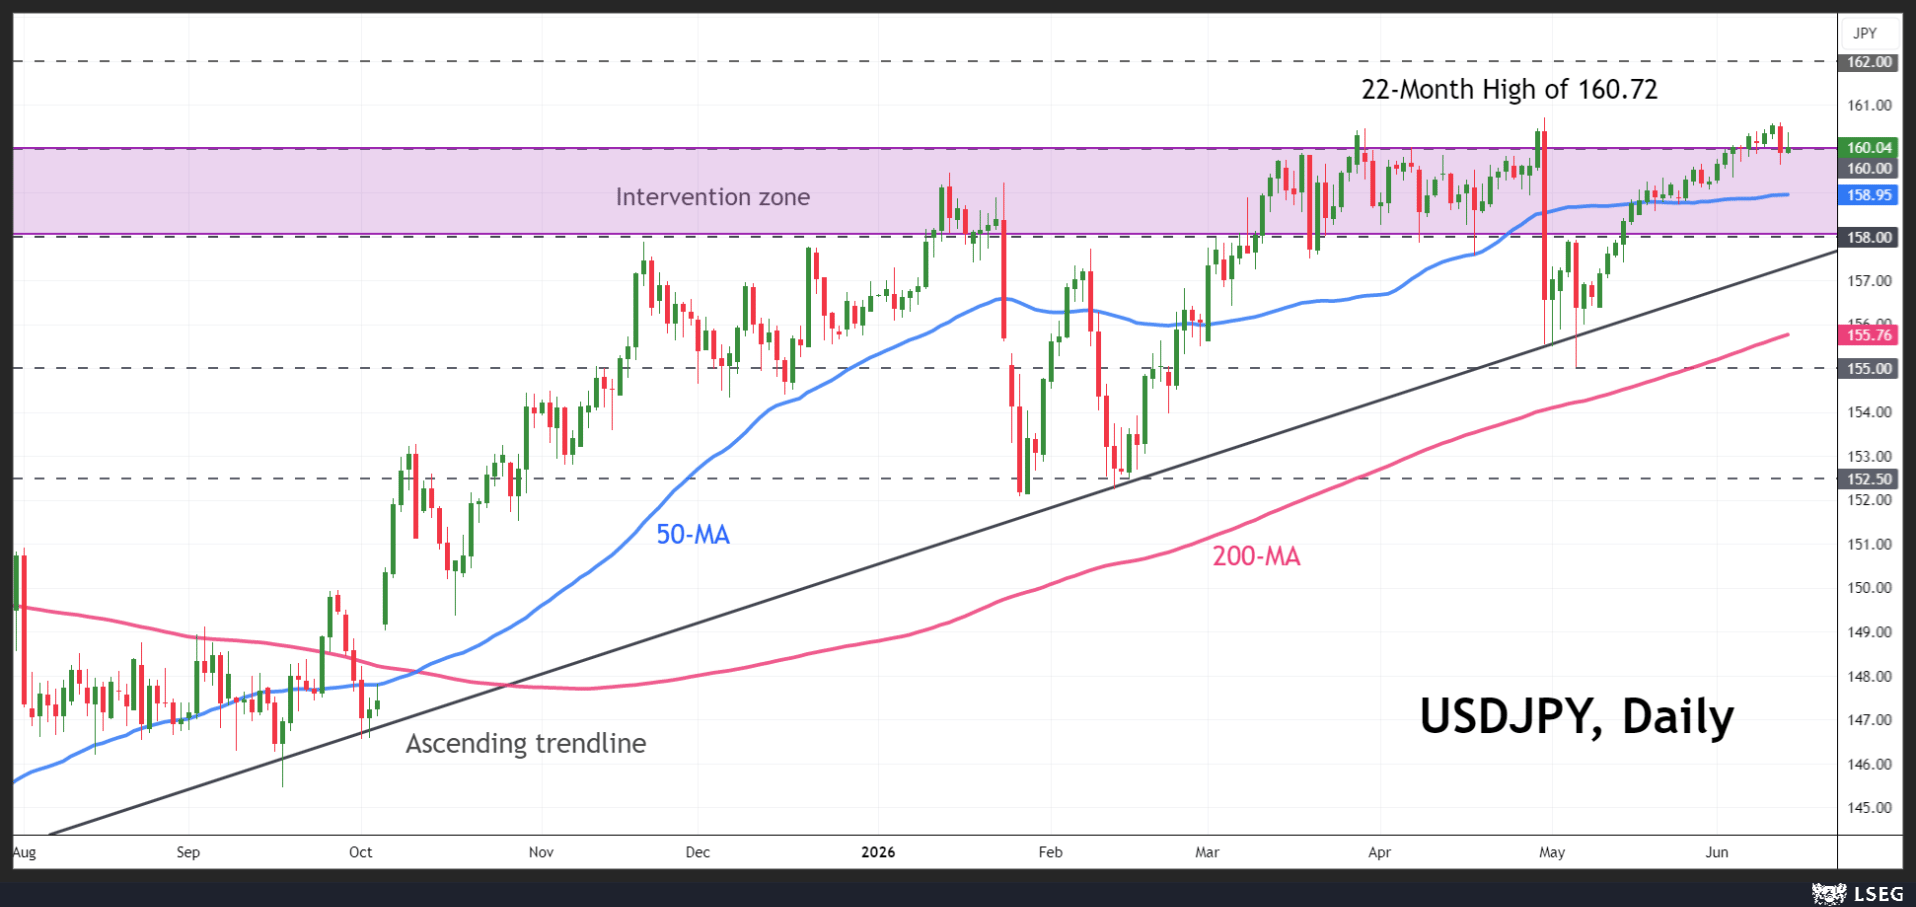
However, a surprisingly hawkish tone by Uchida would likely cause only minor damage to dollar bulls, with any drop struggling to extend beyond the ascending trendline in the absence of government intervention. But in the event a dollar spike forces the government to step in, the 155 level would be the initial target for yen bulls, followed by the 152.50 area.
The risk for traders is that any intervention may not come until the following day when the Federal Reserve announces its decision for US rates. Even if the BoJ manages to draw a line under the yen’s recent losses, it could all come undone should the Fed take a hawkish turn on Wednesday by removing its easing bias.
Sunset Market Commentary
Markets
Who else than Donald J. Trump to give stock markets a boost going into the weekend and ahead of the SpaceX IPO, the world’s largest ever. Sentiment improved rapidly and dramatically after the US president yesterday backtracked on his threat to hit Iran heavily and take its Kharg energy island and instead announced the end of the war with a deal that’s soon to be signed. The timespan between both announcements was mere hours. Wall Street rallied up to 2.5%. European stock markets missed out on the rally but are catching up today with a 1.5% gain. Turning back to the potential interim peace agreement, it does look like Trump’s optimism this time around is shared by Iranian officials as well, with one senior official indicating to Bloomberg that it could be signed as soon as Sunday on the sidelines of a G7 summit taking place in Geneva on June 15-17. The provisions are reported to include, amongst others, an extension of the ceasefire by 60 days, the reopening of the Strait of Hormuz within a month of the signing, the unfreezing of blocked Iranian funds, a recommitment from Iran not to have nuclear weapons, the end of the US blockade and withdrawal of troops. Official Iranian communication remains more cautious though, with local state media issuing the usual pushback. Brent oil prices in any case tumbled yesterday and today with one barrel now trading at $87.7. The oil drop drags core bond yields lower as well. The European front end of the curve at some point tanked 10 bps before cutting losses in half. That may suggest some doubts continue to linger. Longer-term yields hold up better, with net daily changes varying between -0.1 and -2.5 bps in the German 10-30 year bucket. US rates priced in the news already yesterday. They trade higher again today (1-3 bps). The US dollar maintains the upper hand in currency markets in what appears to be driven by US Treasury underperformance since risk sentiment is solid and oil prices have dropped. That said, EUR/USD is only returning about half of yesterday’s appreciation to trade around 1.156 currently. DXY marches north to 99.8. USD/JPY moves beyond the 160 psychological threshold that may or may not prompt renewed interventions by Japanese policymakers.
The ECB was the first G7 central bank to respond to the inflation surge earlier this week. Next week gives the stage to the likes of the Bank of England and the Fed. The former will keep rates steady, banking on what is still a restrictive policy rate to do the work. Markets are bracing for a more hawkish Fed that is all but certain to keep rates steady but drop its dovish bias. Attention will be focused on the Q&A, which is going to be the first one under the new chair, Warsh. The BoJ is readying a hike (to 1%), with the Czech central bank most likely doing the same. Norway, Sweden, Australia and Switzerland are all expected to hold steady.
News & Views
In an interview with Bloomberg, Czech central Bank (CNB) governor Michl said that ‘the case for a rate hike has strengthened’ and that a June move now has become a real possibility. The comments from the CNB governor came even as headline inflation in the country in May slowed to 2.1%. Core inflation, however, still printed at 2.9%. Amongst other factors, the CNB governor indicated that a ‘real problem is that there is too much money in the economy’ created by years of zero rates and real negative rates before Covid. This was also supported by fiscal deficits. Michl points to this combination still pushing core inflation higher. On a potential rate hike, Michl indicated that this “would be a policy adjustment - something like calibrating the degree of monetary policy restriction.” KBC already updated its outlook for CNB policy. It envisages a signalling rate hike at next week’s meeting, followed by one additional increase at a subsequent meeting later this year, most likely during the August-November window. The Czech koruna continues to trade strong near EUR/CZK 24.17, maintaining recent gains, with the EUR/CZK 24.10/24.00 area marking an important technical reference (lows touched at the end of last year and early this year).
The National Bank of Belgium today published an update of its forecast for the Belgian economy. The shock of the war in Iran causes headline inflation to average 3.4% in 2026, mainly due to rising oil prices. It should gradually ease back to 2% in 2028. GDP growth is expected to fall temporarily to 0.6% in 2026, down from 1% last year, but should pick up to 1.3% in 2028. According to the projections, the budget deficit will widen further by 2028 due to rising interest expense. The impact of extensive fiscal consolidation measures will largely be offset by growing ageing-related costs and defence expenditure, as well as declining revenues. The NBB now expects the budget deficit to widen from 5.2% of GDP in 2025 to 5.7% of GDP by 2028, pushing up the debt ratio to close to 115% in 2028. In this respect, the Belgian newspaper De Tijd quotes NBB governor Wunsch as saying that the Belgian government needs to look for savings and/or higher revenues of an amount of €14 billion to limit the deficit.
Week Ahead – Central Bank Barrage Ahead: Fed, BoJ, RBA, SNB and BoE in Focus
- Fed meets as strong US data bolster rate hike bets.
- BoJ expected to hike, intervention risk also in focus.
- RBA to remain on hold, hawkish message could boost Aussie.
- BoE to also stand pat, inflation outlook to shape rate path speculation.
Fed Rate Hike Expected by the End of the Year
The US dollar outperformed most of its major counterparts this week, with investors remaining convinced that the Fed may need to press the rate hike button before the end of this year.
Fed hike bets were significantly bolstered after the US jobs report for May came in much stronger than expected, with nonfarm payrolls rising to 172k and confounding expectations of a much more modest 85k gain. April’s figure was revised up to 179k from 115k initially, while the unemployment rate held steady at 4.3%.
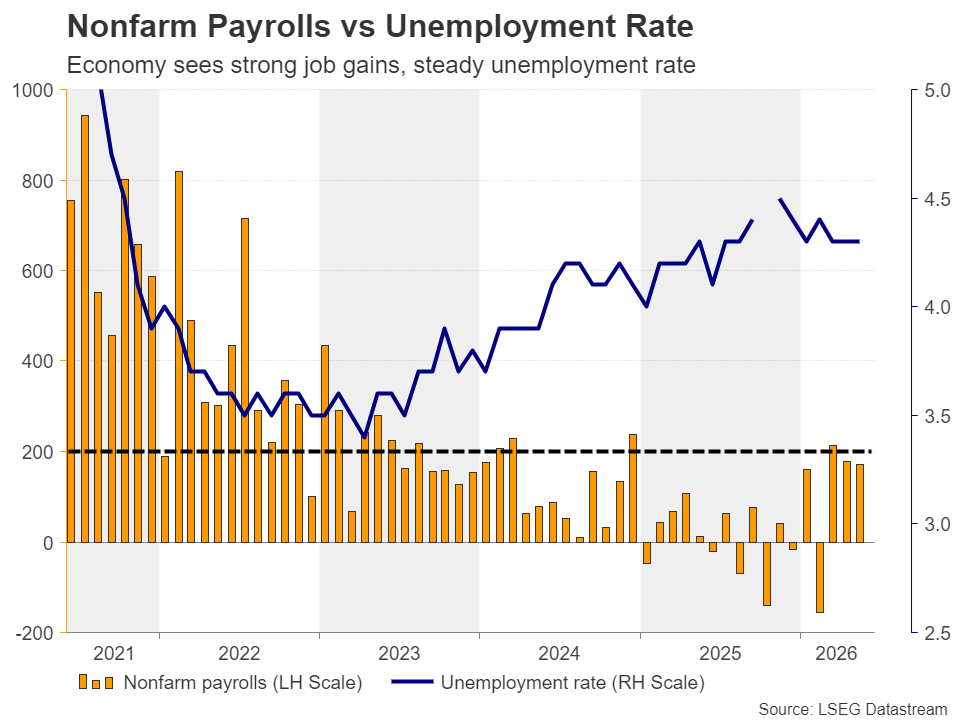
The report painted a picture of a labor market astoundingly strong considering the ongoing conflict in the Middle East and the resulting energy crisis, giving the Fed the green light to proceed with a tighter monetary policy stance.
Although investors remained somewhat hopeful about a truce in the Middle East despite several episodes of hostilities during the week, they maintained their hawkish bets, especially after the US CPI data for May revealed that the headline rate rose from 3.8% y/y to 4.2%, more-than-double the Fed’s objective of 2%, with the core rate ticking up to 2.9% y/y from 2.8%.
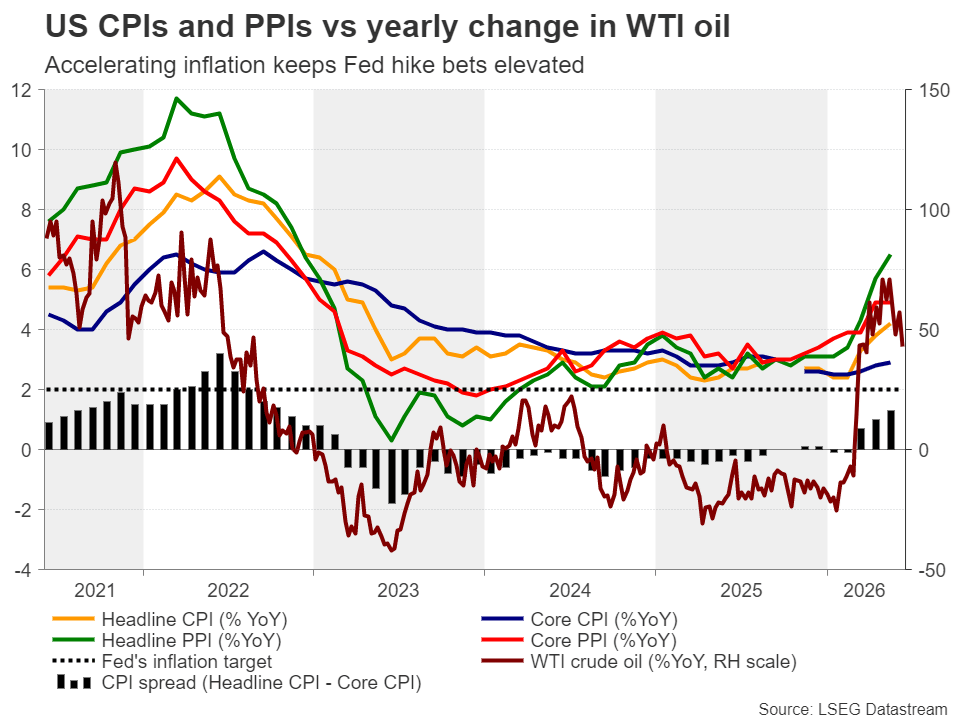
According to Fed funds futures, a 25bps rate hike is nearly fully priced in for December, while the probability of it being delivered in September is almost 35%. And this is even after US President Trump said that they have agreed with Iran on peace deal, which will be signed very soon.
Will the Fed Satisfy Hawkish Market Expectations?
With Wednesday’s meeting being the first of the new Chair, Kevin Warsh, it is unlikely that the Fed will press the hike button before September. After all, Warsh was appointed by US President Trump, on the premise that he holds a less hawkish view than his predecessor Jerome Powell.
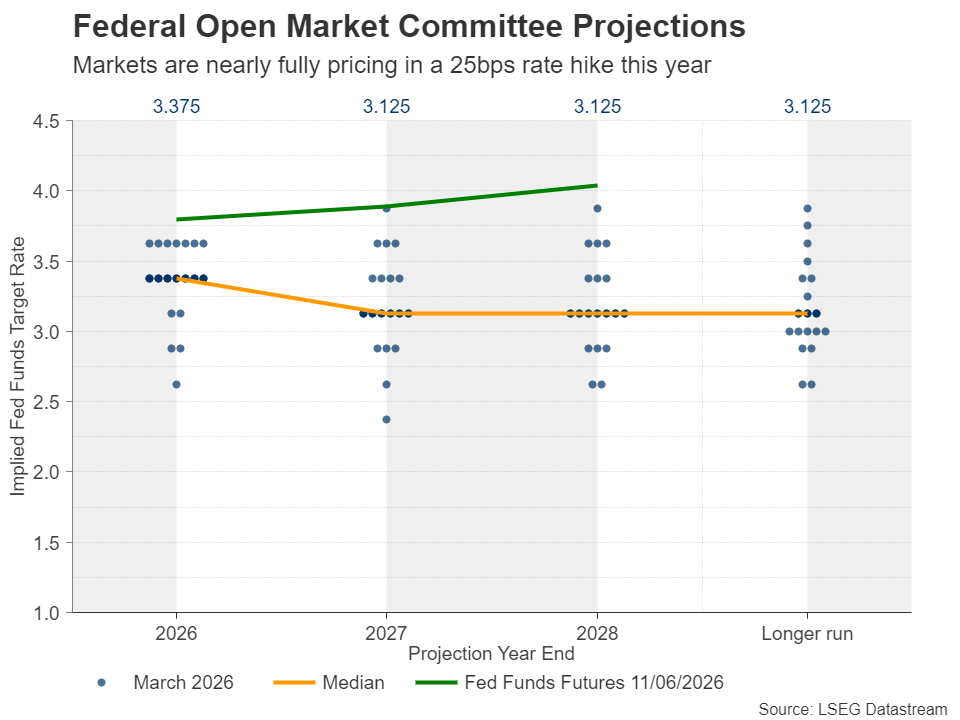
Thus, the spotlight will be on how Warsh’s communicates his views and whether there will be strong signals about rate hikes amid concerns and upside risks to the inflation outlook. If indeed Warsh and his colleagues maintain concerns about inflation spiraling out of control, and the new dot plot, not only removes previously anticipated rate cuts, but shifts towards rate hikes, then the US dollar’s engines are likely to receive more fuel as Treasury yields march higher and the probability of a September rate hike increases.
Strong US industrial production numbers on Monday, and solid retail sales prints on Wednesday, ahead of the Fed announcement, could add more credence to hawkish market bets.
BoJ Set to Hike, but More Is Needed for the Yen to Stage a Comeback
The yen continued suffering, with traders testing waters above the 160-per-dollar mark. Although market participants may be sitting on the edge of their toes in anticipation of a potential intervention episode, they are also keeping an eye on Tuesday’s BoJ decision, scheduled during the Asian morning.
The Bank is largely expected to raise interest rates at its upcoming meeting, but that is not necessarily a helping hand for the yen, as the move is already priced in. For the yen to stage a meaningful recovery, an intervention episode alone, even accompanied by an upcoming rate hike, may not be enough. The BoJ may have to appear even more hawkish, signaling additional increases in borrowing costs for the months to come. In other words, a hawkish hike by the BoJ and an intervention episode just ahead of or after the meeting may be the successful recipe for a bullish reversal in the yen.
Towards the end of the week, during the Asian session Friday, Japan’s National CPI data will be released and will prove whether the BoJ should remain concerned about inflation getting out of control, even if officials do press the hike button on Tuesday.
Will the RBA Keep the Door to More Hikes Open?
Soon after the BoJ, the RBA will announce its monetary policy decision. At its May meeting, the RBA decided to raise interest rates by 25bps for the third consecutive month, fully reversing the reductions made during last year. That said, the forward guidance was less hawkish than the previous ones, with policymakers not pre-committing to additional hikes and instead emphasizing data dependency.
This, combined with additional post-meeting comments by Gov. Bullock that rates are now in restrictive territory, prompted investors to bet on a pause at this gathering. On top of that, the increase in unemployment rate for April and the drop in household spending during the month added credence to the idea that the RBA may need to proceed at a slower pace from here onwards. Indeed, another 25bps rate hike is not even fully priced in by the end of the year, receiving only an 80% chance.
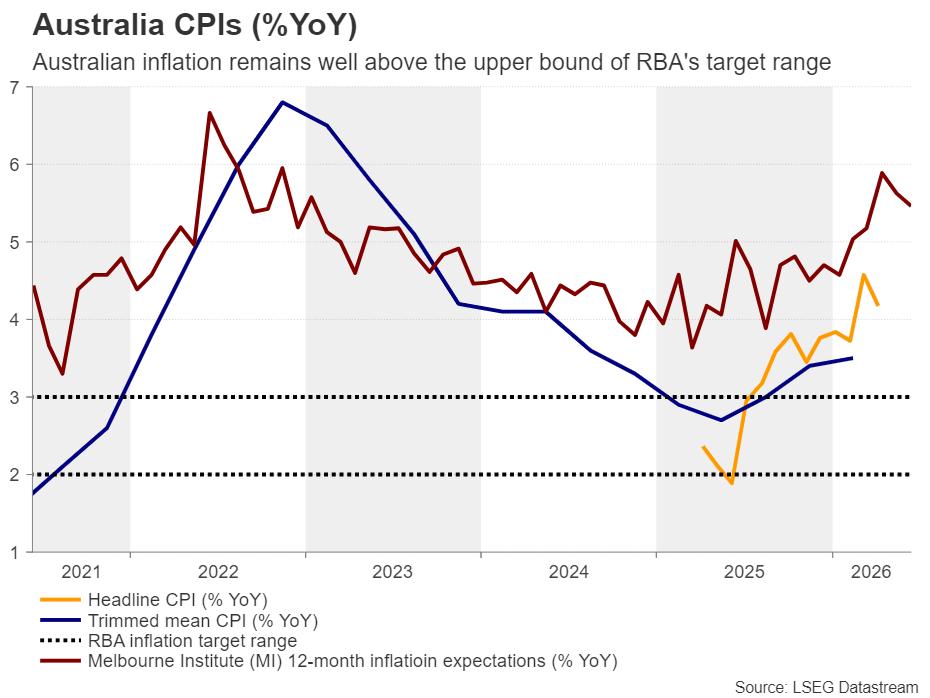
Having said that though, closing the door to additional rate increases may be a premature move, especially with Australian inflation remaining elevated. The headline CPI rate slowed to 4.2% y/y in April from 4.6% but remained well above the upper bound of the RBA’s 2-3% target range, while the trimmed mean rate ticked up to 3.4% y/y from 3.3%.
Therefore, with hostilities in the Middle East potentially escalating at some point and the strait of Hormuz remaining closed, the most likely outcome may be a hawkish hold that brings forward the timing of when the next rate hike may be delivered. This could prove positive for the Australian dollar.
The aussie may experience some early volatility though as ahead of the decision, China’s industrial production, fixed asset investment, retail sales and the unemployment rate, all for May will be released.
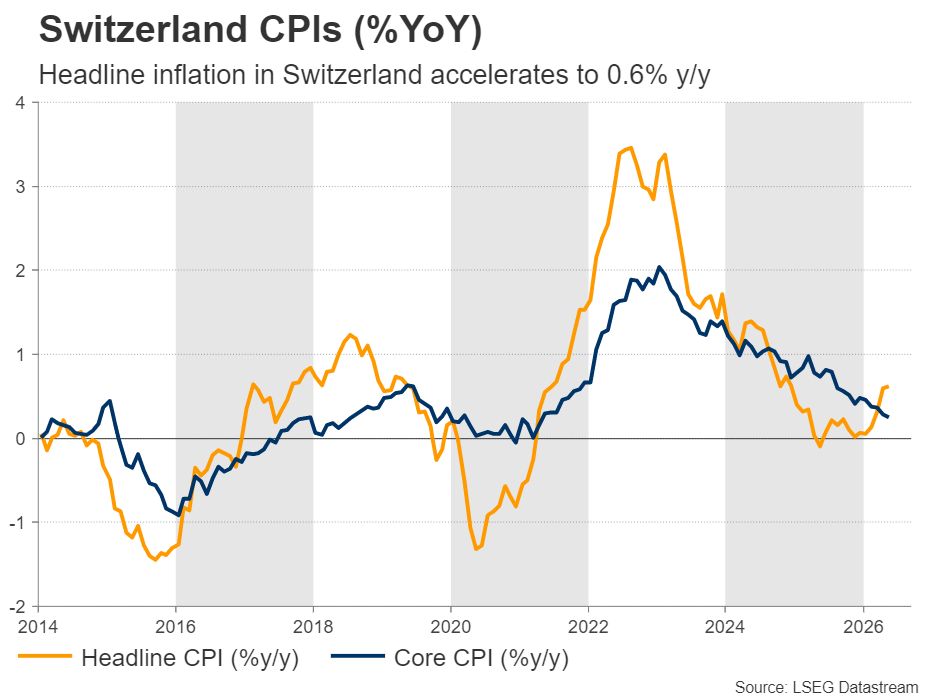
SNB to Stand Pat, Could Revise Up Inflation Projections
On Thursday, the central bank torch will be passed to the SNB and the Bank of England. Getting the ball rolling with the SNB, its latest meeting was on March 19, with the SNB keeping interest rates at 0.00% and policymakers acknowledging that inflation remained very low despite the spike in energy prices amid the Middle East conflict. They remained willing to intervene in the FX market to prevent the franc from appreciating amid increasing risk it could attract safe haven flows.
Having said all that, inflation accelerated since then, with the CPI rate rising to 0.6% in April and remaining there in May, erasing deflation fears but not raising concerns about overshooting inflation either.
This means that policymakers will be more than happy to stay sidelined once again, without having to think whether negative rates could be needed at some point. They may even revise their inflation projections higher, which could prove positive for the franc.
However, the franc has depreciated notably against the euro since then, and thus, any meeting-related spike is unlikely to trigger urgency for intervention, though officials are likely to reiterate their readiness to step into the FX market if and when deemed necessary.
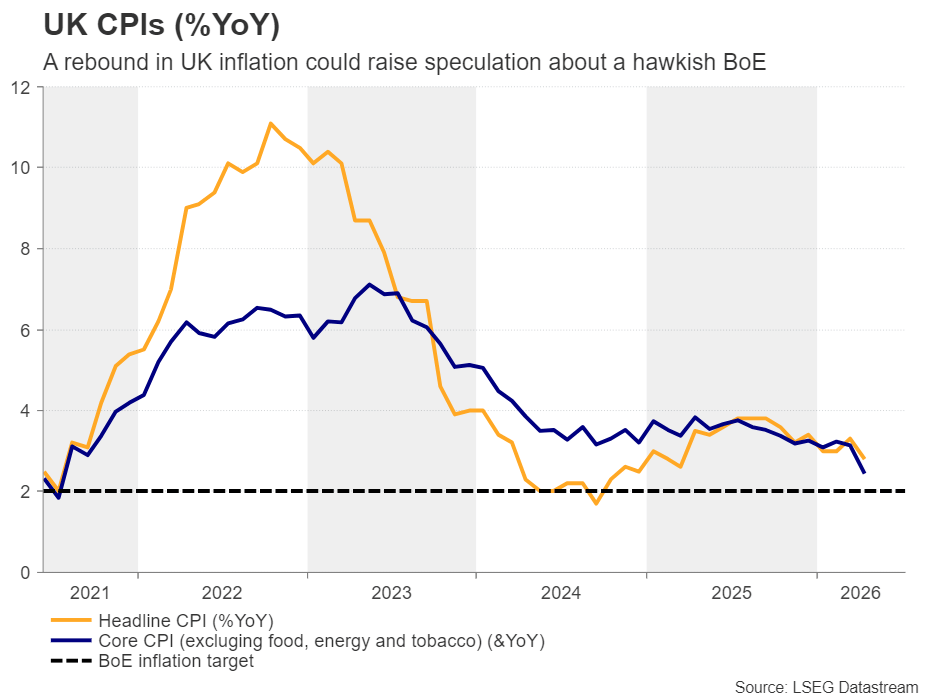
Will the BoE Reiterate Its No-Rush Mantra?
At its most recent gathering, on April 30, the BoE kept rates untouched, with the committee voting 8-1 in favor of that, with the dissenter preferring a quarter-point hike. Policymakers acknowledged that, due to the conflict in the Middle East, inflation risks have increased, but Governor Bailey most recently signaled that they are not in a rush to press the hike button and that allowing inflation to run above target is justified given the uncertainty about the impact of the Iran war on the economy.
Taking all that into account, traders are largely expecting the Bank to remain on the sidelines at next week’s gathering, with the rate-hike case receiving only an 11% probability. A 25bps rate increase is fully priced in for September and thus, investors will be looking for signals as to whether policymakers have the appetite to press the hike button sooner.
The UK CPI data for May will be out on Wednesday, and should they point to accelerating consumer prices after April’s slowdown, investors will be looking for a more hawkish message on Thursday. If they are satisfied, they could fully pencil in a rate hike for July, which could help the pound recover some ground.
The UK retail sales will be released on Friday, the day after the decision, while New Zealand’s GDP for Q1 and Canada’s retail sales are also on next week’s agenda, scheduled for Wednesday and Friday, respectively.