
Sample Category Title
Market Morning Briefing
STOCKS
Global indices look bullish in the near term except the Dow which could possible test some more levels on the downside before pausing.
Dow (20596.72, -0.29%) could possibly be on the verge of breaking below the daily channel support. The resistance on the 3-day and weekly candles seems to be holding good for now and while that holds, we could see a test of 20400-20000 levels in the near term.
Dax (12064.27, +0.20%) is clearly trading within the upward channel on the daily candle chart and while that holds, we could see the index move up in the near term. Immediate target if 12200 on the upside. Near term looks bullish.
Nikkei (18983.19, -1.45%) may continue to remain indecisive while it trades within the broad sideways range of 18600-19600. A bounce from current levels could be expected in case, Dollar-Yen also bounces back from immediate support. (Refer FOREX section below)
Shanghai (3275.78, +0.19%) has risen in line with our expectation almost heading towards our first target of 3300. A break above 3300 could take it towards resistance near 3400. Near term looks bullish.
Nifty (9108, +0.24%) bounced back well in the last sessions and could continue to move up towards 9200 and higher in the near term.
COMMODITIES
Fresh weakness in Dollar index (99.30) has boosted bullion significantly. Gold (1256) has broken its bearish channel resistance (since Sep 16) at 1248-50 and could move towards 1267 and 1307 respectively.
Similar kind of chart has been formed in silver (17.89) also as it is trading ab resistance around above its pivot of 17.45. The possibility of a rise towards 18.33 levels can’t be ruled out.
Copper (2.60) is trading within a range of 2.57-2.70. Only above 2.70, higher resistances of 2.80 can come into consideration. In the medium term 2.55-57 are going to be a strong support now and a close below that could open up 2.55 and 2.49 levels respectively.
Oil prices dipped again as rising U.S. drilling activity outweighed talks that an OPEC-led production cut initially due to end in mid-2017 may be extended. We think that prices may receive some support (Specially Brent at $50) from talks between OPEC and other producers, including Russia in order to prop up the market. Considering the short term oversold sate in Brent (50.75) and WTI (47.34), we may see some profit taking rally towards their respective resistances of 52-53 for Brent and 48.50-49.80 for WTI respectively. But the trend is still bearish in the near to medium term time frame. Any corrective bounce may face selling pressure at the higher levels.
FOREX
The collapse of the healthcare bill legislation by the Republicans not only signalled a setback for Trump but raised questions about the ability of the President fulfil his other promises including a boost in the infrastructure spending and tax cuts. Not a good position for Dollar.
Dollar Index (99.29) is very close to the major support area of 99.00-98.50 as expected and some short covering from the area leading to a bounce towards 100.00-40 this week can’t be ruled out.
Euro (1.0845) is trading right at the resistance of 1.0850 following a bounce from our support 1.0750 and now may rise past 1.0850 for 1.1000 in the next few sessions, negating the immediate bearish possibilities.
Dollar-Yen (110.39) has turned out to be more impatient than expected as it continues its decline without any consolidation. Sustained trading below 110.50 may drag it down to 109.40 and 108.50 soon with resistance coming at 111.50.
Pound (1.2524) continues its gradual rise towards 1.2650-1.2700 with near term support unchanged at 1.2440-20.
Aussie (0.7625) is holding above the support of 0.76 as expected and may continue sideways trading in the range of 0.7600-0.7750 for a couple of sessions more.
Dollar Rupee (65.52) is trading at 65.40 in the NDF, almost at the midpoint of our range 65.20-70 which may remain intact for the week.
INTEREST RATES
The German-Us 2YR (-1.97%) is heading towards near term channel resistance near -1.95% and could possibly come off from there in the near term. But looking at the German-US 10YR (-1.96%) which has broken above the horizontal resistance coming from Mar’15 there is enough room on the upside. Although there is lack of clarity just now, but if the 2Yr yield spread come off, the upside for Euro could be limited in the near term.
The US yields have broken below the immediate support levels and are headed lower. The 5Yr (1.90%), 10Yr (2.37%) and the 30YR (2.98%) have all fallen and could test 1.80%, 2.30% and 2.90% respectively.
The UK 10-5YR (0.57%) is falling sharply and could be headed towards 0.50% in the near term.
The German yields are in a pause mode and could possibly come off in the near term. The 5Yr (-0.31%), 10Yr (0.41%) and the 30Yr(1.14%) are slightly higher but could possibly come down again in the coming sessions.
USD/CHF Daily Outlook
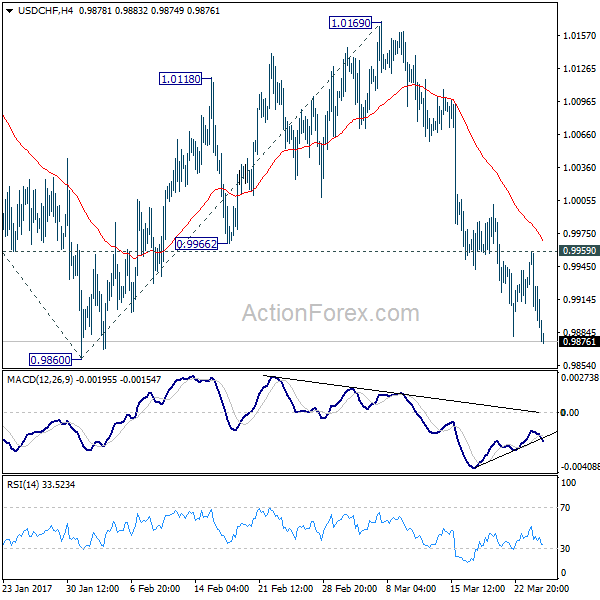
Daily Pivots: (S1) 0.9881; (P) 0.9920; (R1) 0.9952; More.....
USD/CHF's fall from 1.0169 resumes by breaking 0.9881 and intraday bias is back on the downside for 0.9860 support. Break will resume whole decline from 1.03420. In that case, next target will be 100% projection of 1.0342 to 0.9860 from 1.0169 at 0.9687 and possibly below. Meanwhile, break of 0.9959 minor resistance will indicate short term bottoming, on bullish convergence condition in 4 hour MACD. In such case, intraday bias will be turned back to the upside for 55 day EMA (now at 1.0035).
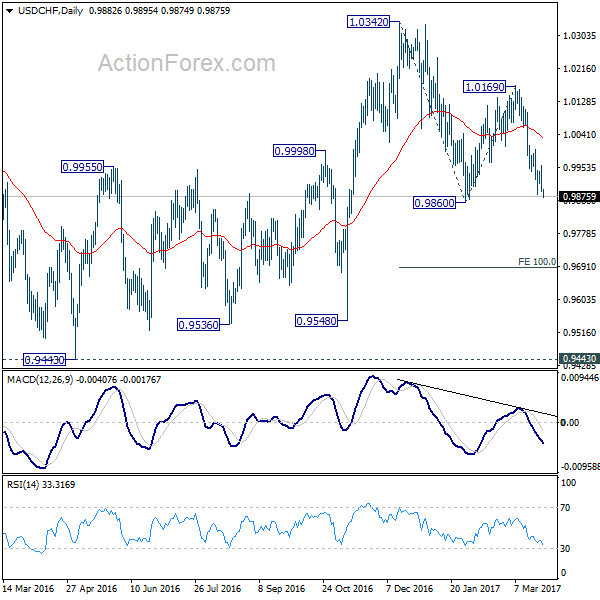
In the bigger picture, USD/CHF is staying in medium term sideway pattern between 0.9443/1.0342. In any case, decisive break of 1.0342 resistance is needed to confirm underlying strength. Otherwise, we'll stay neutral in the pair first. In case of deeper fall, we'd expect strong support from 0.9443/9548 support zone.
Dollar Tumbles Broadly, Yen Surges on Trump’s Health Care Flop
Dollar tumbles broadly in Asian session while the Japanese yen surges. Nikkei also trade deeply in red and is down -1.4%, below 19000 handle, at the time of writing. These developments are seen as markets' reactions to US president Donald Trump's failure in pushing through his health care act. Some analysts noted that markets are generally getting more cautious as the failure exposed Trump's on his limits. Meanwhile, Trump tweeted on Sunday saying that the Democrats were "smiling" with the help of conservative Republicans. That won't likely help him gain more support in the House. With a light quarter-end week ahead, movements in the markets could be exaggerated. It would take some time for the markets to readjust their expectations on US before committing to a stance.
BoJ opinions: monetary policy based on Japan, not overseas
In Japan, BoJ released summary of opinions from the March 15/16 policy meeting. The document noted that "some market participants argue that the Bank needs to change the monetary policy in response to the rise in the long-term yields overseas." But, majority believed that "monetary policy in Japan should be decided based on Japan's economic activity and prices". Therefore, "it will be a considerable length of time before the Bank will need to change its monetary policy." At the meeting, BoJ held interest rate unchanged at -0.1%. And under the Yield Curve Control framework, BoJ target to guide 10 year yield at around 0%. The annual target of asset purchase was held at JPY 80T.
UK PM May to meet Scotland FM Sturgeon
UK Prime Minister Theresa May is set to trigger the Article 50 for Brexit negotiation on Wednesday. Ahead of that, May will travel to Scotland for a meeting with its First Minister Nicola Sturgeon. The meeting is highly anticipated after recent verbal exchanges between May and Sturgeon. Sturgeon called for a fresh independence referendum but May insisted that would only take place until Brexit in completed in early 2019. Sturgeon called for a "face-to-face" debate on the topic with May, at one point.
OPEC to consider extending production cut
A joint committee of ministers from OPEC and non-OPEC countries "expressed its satisfaction with the progress made towards full conformity with the voluntary production adjustments and encouraged all participating countries to press on towards 100 percent conformity." There were reports that the committee recommended a six month extension on production cut in the draft statement. But in the final version, the committee only said that "review the oil market conditions and revert... in April, 2017 regarding the extension of the voluntary production adjustments". Kuwaiti Oil Minister Essam al-Marzouq said that "unless we have conformity with everybody, we cannot go ahead with the extension of the deal."
A light week ahead
The economic calendar is relatively light this week. German Ifo, US consumer confidence; might trigger some volatility in the markets in the early part of the week. Meanwhile, main focuses are on Friday with China PMIs, Japan CPI, Eurozone CPI and US PCE featured. Here are some highlights of the week ahead.
- Monday: German Ifo business climate; Eurozone M3
- Tuesday: US trade balance, wholesale inventories, S&P case-shiller house price, consumer confidence
- Wednesday: Japan retail sales; Swiss UBS consumption indicator; German import price; UK mortgage approvals; US pending home sales
- Thursday: Swiss KOF leading indicator; German CPI; Canada RMPI, IPPI; US GDP final, jobless claims
- Friday: Japan CPI, household spending, unemployment rate, industrial production; New Zealand NBNZ business confidence; China PMIs; German retail sales, unemployment; UK current account, GDP final; Eurozone CPI; Canada GDP; US personal income and spending, Chicago PMI
USD/CHF Daily Outlook
Daily Pivots: (S1) 0.9881; (P) 0.9920; (R1) 0.9952; More.....
USD/CHF's fall from 1.0169 resumes by breaking 0.9881 and intraday bias is back on the downside for 0.9860 support. Break will resume whole decline from 1.03420. In that case, next target will be 100% projection of 1.0342 to 0.9860 from 1.0169 at 0.9687 and possibly below. Meanwhile, break of 0.9959 minor resistance will indicate short term bottoming, on bullish convergence condition in 4 hour MACD. In such case, intraday bias will be turned back to the upside for 55 day EMA (now at 1.0035).
In the bigger picture, USD/CHF is staying in medium term sideway pattern between 0.9443/1.0342. In any case, decisive break of 1.0342 resistance is needed to confirm underlying strength. Otherwise, we'll stay neutral in the pair first. In case of deeper fall, we'd expect strong support from 0.9443/9548 support zone.
Economic Indicators Update
| GMT | Ccy | Events | Actual | Forecast | Previous | Revised |
|---|---|---|---|---|---|---|
| 23:50 | JPY | BoJ Summary of Opinions at March 15-16 Meeting | ||||
| 23:50 | JPY | Corporate Service Price Y/Y Feb | 0.80% | 0.50% | 0.50% | |
| 8:00 | EUR | Eurozone M3 Y/Y Feb | 4.90% | 4.90% | ||
| 8:00 | EUR | German IFO - Business Climate Mar | 111.1 | 111 | ||
| 8:00 | EUR | German IFO - Expectations Mar | 104.3 | 104 | ||
| 8:00 | EUR | German IFO - Current Assessment Mar | 118.3 | 118.4 |
GOLD – Bullish, Eyes Further Upside Pressure
GOLD - The commodity closed higher the past week leaving risk of more strength on the cards. But we may a correction lower occurring. On the downside, support comes in at the 1,240.00 level where a break will turn attention to the 1,230.00 level. Further down, a cut through here will open the door for a move lower towards the 1,220.00 level. Below here if seen could trigger further downside pressure targeting the 1,210.00 level. Conversely, resistance resides at the 1,260.00 level where a break will aim at the 1,270.00 level. A turn above there will expose the 1,280.00 level. Further out, resistance stands at the 1,290.00 level. All in all, GOLD looks to strengthen further.
The GOP Great Divide
The GOP Great Divide
Two distinct drivers monetary policy and political developments continue to mould investor sentiment. With the weekend to digest Friday's US political headlines. the picture is not much clearer, and that uncertainty saw opening market's sell USDJPY as we have not likely seen the last of the vast divide among the GOP. While there was little initial panic on Friday over the AHCA getting pulled, I suspect the markets will continue to view this failed vote as a litmus test for the ability of the Trump administration to drive the President's agenda going forward. How quickly the Whitehouse administration can pivot to and get a convincing message across on tax reform will likely be the major focus early in the week. The market is desperately seeking any glimmer of optimism that the tax reform agenda can unite Republicans
Australian Dollar
A very light week for Australian data so look for external drivers to remain dominant. I suspect we will continue to see the Aussie's tight correlation with global equities play out and with so much uncertainty brewing on Capitol Hill investors backbones will likely get tested out of the gates this week as stock markets will likely flounder.
In addition to the wobbly capital markets, iron ore prices rolled over collapsing some 19 % last week as rebar prices slumped. Markets sideswiped by China property kerbs and hikes in China's repo rates that are designed to kerb excessive financial speculation as the mainland leaders appear determined about reining in unbridled debt-fuelled speculators.
Japanese Yen
The dollar has been under early pressure as the JPY is benefiting from the political uncertainty unfolding on Capitol Hill. Traders are are thinking we've seen the near term e high water mark for USDJPY as the market views the AHCA debacle as a foreshadowing of a severe watering down of Presidents Trump's power in Washington. At a minimum, the lack of unity among the GOP suggests future Trump administration policies will be far from a rubber stamp. ON Friday we saw a case of buying the rumour on the significant tax reform hope, but today we sell the fact of the great GOP divide.
Euro
Ploughing through the 1.0830 level is very constructive for the EUR. The perception that political risks are diminishing in Europe but escalating in the US has the Euro poised to make further headway. The apparent shift in ECB to a less accommodative stance has traders thinking policy pivot as the recent inflation, and PMI data supports this notion.
EURUSD: Bullish With Eyes On Key Resistance
EURUSD: With the pair closing higher the past week, it now leaves risk of more strength on the upside. On the upside, resistance comes in at 1.0850 level with a cut through here opening the door for more upside towards the 1.0900 level. Further up, resistance lies at the 1.0950 level where a break will expose the 1.1000 level. Its daily RSI is bullish and pointing lower suggesting further weakness. Conversely, support lies at the 1.0750 level where a violation will aim at the 1.0700 level. A break of here will aim at the 1.0650 level. All in all, EURUSD faces further recovery threats.
Markets to Readjust Expectations after Trump Health Care Act Failure
Risk aversion was the dominate theme last week on reverse Trump trade. DJIA suffered the biggest decline this year and lost -317.9 pts or 1.51% to close at 20596.72. S&P 500 dropped -34.27 pts or 1.44% to close at 2343.98. Treasury yield followed with 10 year yield losing -0.101 to close at 2.400. Dollar index dive through 100 handle to close at 99.62, down from prior week's close at 100.31. In the currency markets, Yen was the biggest winner last week on risk aversion and falling yields. Swiss Franc closely followed as the second strongest major currency. Dollar weakened against European majors and Yen but ended up against Aussie and Canadian Dollar. The two were the weakest major currencies last week. In other markets, Gold extended recent rise from 1194.5 and closed at 1248.5, but kept below resistance at 1264.9. WTI crude oil continued to stay in sideway consolidation between 47/50.
Trump failed first Congressional Test
It should be reiterated the rallies in stocks and yields since the US presidential elections last year were based on anticipation of US president Donald Trump's expansive policies. Those policies include tax cuts as well as infrastructure spending. However, such assumptions were in serious doubt last week ahead of the "vote" on Trump's heath care act in House. There were talks that Trump couldn't get enough support even from Republican controlled House to pass the bill to repeal Obamacare. And indeed, the vote was firstly delayed from Thursday to Friday and then pulled because of insufficient support. The result somehow justified the selloff in stocks in the middle of the week.
Markets undecided after the failure
However, it should also be noted that markets were relatively steady on Friday before close. DJIA just lost -0.29% on Friday while S&P 500 lost -0.08%. There were talks that the situation now makes it more difficult for Trump to push through agendas on tax and fiscal stimulus. On the other hand, there were also talks that with healthcare off the table, Trump would expedite the agendas on tax and stimulus. These are two contradictory interpretations on the situations and we're yet to see which side the markets take. Nonetheless, technically, more downside is expected in stocks, yields as well as the greenback (to be covered later).
UK to trigger Brexit finally
A major focus this week is that UK Prime Minister Theresa May will finally trigger Article 50 for Brexit on Wednesday, March 29. Ahead of that, EU leaders gathered in Rome during the weekend to reinforce unity. EU President Donald Tusk said that "Europe as a political entity will either be united, or will not be at all". And, "only a united Europe can be a sovereign Europe." EC President Jean-Claude Juncker said on Friday that UK will need to pay roughly GBP 50b for leaving the Union. But Juncker emphasized that "the British government and parliament took on certain commitments as EU members and they must be honored". And, "this isn't a punishment or sanctions against the U.K." That is expected to be a key sticking point in the negotiation. Meanwhile, the news on Brexit so far should be well priced in. Thus, while's it a focus, it may not be that market moving.
The week ahead is not too busy with some important economic data scheduled. But trading could be a bit subdued ahead of quarter end. The economic data to watch include German Ifo on Monday, US trade balance and consumer confidence and Tuesday. US Q4 GDP final on Thursday, Japan CPI UK Q4 GDP final, Eurozone CPI and US PCE on Friday.
DJIA correction to extend
Technically, we maintain the view that 21169.11 is a medium term top is DJIA, on bearish divergence condition in daily MACD. Deeper correction is expected to extend to 55 day EMA (now at 20418.56) and below. At this point, we'd expect support from 38.2% retracement from 17883.56 to 21169.11 at 19914.03 to contain downside and bring rebound. On the upside, above 20757.89 will suggests short term bottoming and bring rebound. However, there is little chance for up trend resumption in near term. And correction/consolidation from 21169.11 should extend for a while.
TNX still on course to 2.314
10 year yield's decline from 2.615 extended lower as expected and took out 55 day EMA. Further fall is still in favor in near term. As noted before, there are two main interpretations of the price actions. Firstly, consolidation from 2.621 is extending with fall from 2.615 as the third leg. Secondly, rise from 2.314 to 2.615 is a failure fifth that ends the whole impulsive rally from 1.336. In both cases, TNX should now head to 55 day EMA at 2.435 and sustained break will target 2.314 and below. But still, in both cases, we'd expect strong support from around 38.2% retracement of 1.336 to 2.621 at 2.130 to contain downside and bring up trend resumption.
DXY's fall halted ahead off 99.23, stays bearish
Dollar index's decline continued last week as expected but lost some momentum ahead of 99.23 support. Nonetheless, with 100.47 resistance intact, deeper fall is still expected through 99.23. Whole decline from 103.82 should target 100% projection of 103.82 to 99.23 from 102.26 at 97.66. But considering that this level is close to 55 week EMA (now at 98.56), we'd tentatively expect strong support from there to contain downside.
To sell AUD/JPY on recovery
Regarding trading strategy, we suggested to sell USD/JPY on recovery to 113.50 to ride on anticipated weakness in Dollar and yeilds. That was directionally correct. But our entry was too conservative as USD/JPY didn't recover to that point before extend the decline. Our order was not filled. We're still holding on to the near term bearish view in Dollar and yield. But since USD/JPY is now struggling around key supprot level at 111.13, we're look for opportunity elsewhere.
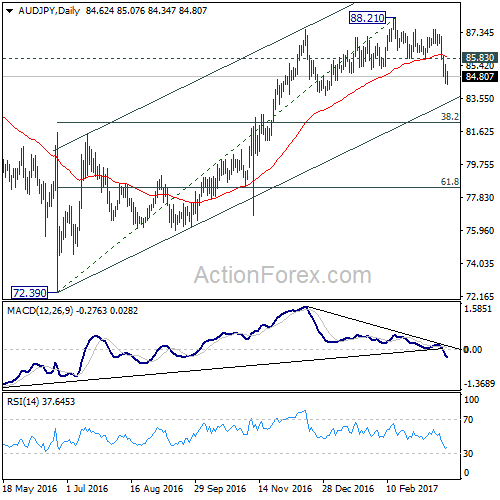
We tweeted on March 21 that AUD/JPY's 6H action bias turned red with a downside breakout. AUD/JPY subsequently dived to as low as 84.34 before recovering mildly.
Taking a snap shot on Friday's close, daily AB stayed red for three days while weekly AB was neutral.
Looking at the daily chart, bearish divergence condition in MACD indicates that 88.21 is a short term top at least, with possibility of being a medium term top. The structure of the rise from 72.39 to 88.21 looks corrective and such rise could be completed too. Further supporting bearishness is the near term bearish outlook in stocks and yields as mentioned above that should be AUD/JPY negative. Nonetheless, the cross is staying inside the medium term channel which doesn't really confirm bearishness.
Hence, while we'll try to short AUD/JPY this week, we will play a bit safer and sell on recovery to 85.83 resistance, with a stop at 87.50. We're looking at target at 38.2% retracement of 72.39 to 88.21 at 82.16 if it can get through the channel support.
GBP/USD Weekly Outlook
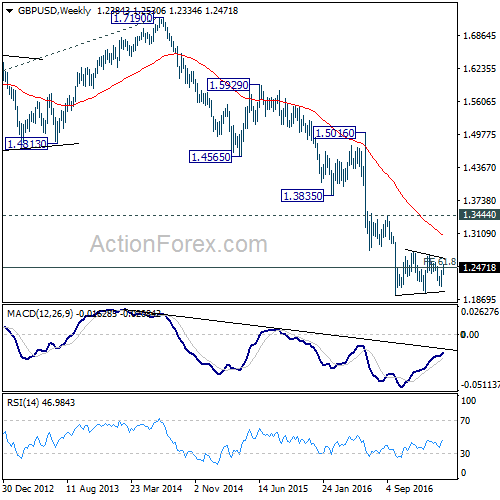
GBP/USD rebounded to as high as 1.2530 last week but lost momentum since then. Overall outlook is unchanged that price actions from 1.1946 are developing into consolidation pattern with 1.2108 as another leg. While such consolidation could extend, the larger down trend is expected to resume at a later stage.
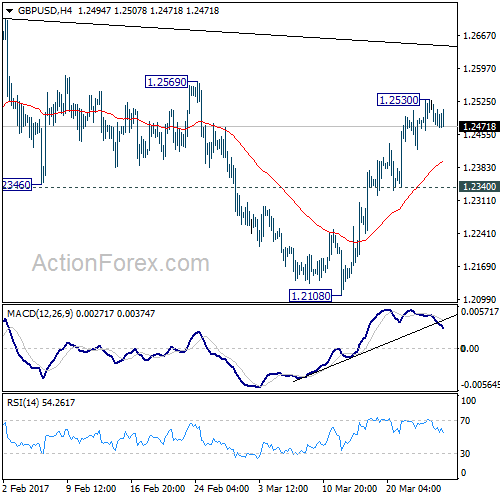
Initial bias in GBP/USD is neutral this week first. On the upside, above 1.2530 will target 1.2705/74 resistance zone. But we'd expect strong resistance from 1.2705/2774 resistance zone to limit upside and bring down trend resumption. On the downside, break of 1.2340 support will turn bias back to the downside for 1.2108 support. Though, sustained break of 1.2774 will extend the rise towards 1.3444 key resistance level.
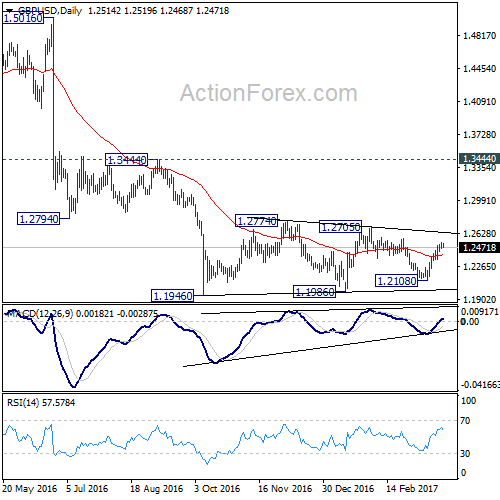
In the bigger picture, fall from 1.7190 is seen as part of the down trend from 2.1161. There is no sign of medium term reversal yet. Sustained trading below 61.8% projection of 2.1161 to 1.3503 from 1.7190 at 1.2457 will target 100% projection at 0.9532. Overall, break of 1.3444 resistance is needed to confirm medium term bottoming. Otherwise, outlook will remain bearish.
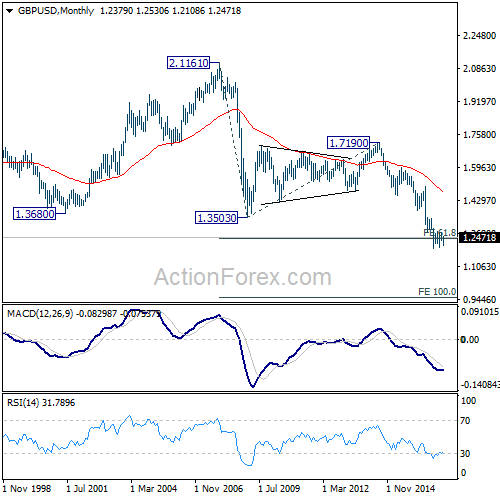
In the longer term picture, no change in the view that down trend from 2.1161 is still in progress. Current momentum suggests that the down trend will go deeper than originally expected to 100% projection of 2.1161 to 1.3503 from 1.7190 at 0.9532.
EUR/USD Weekly Outlook
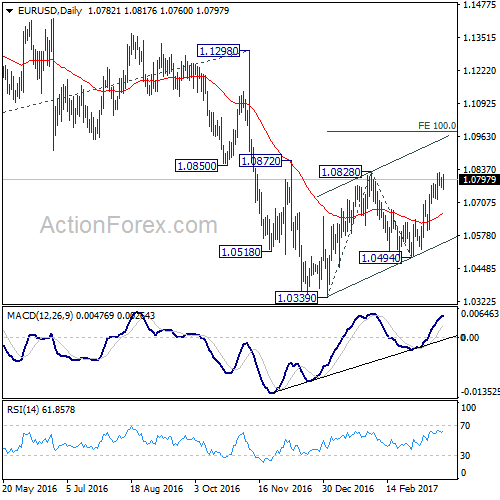
EUR/USD rose to as high as 1.0824 last week. But it lost momentum ahead of 1.0828 resistance and turned sideway. Some consolidations could be seen but outlook is unchanged. Rise from 1.0339 is seen as a corrective move and is still expected to extend higher.
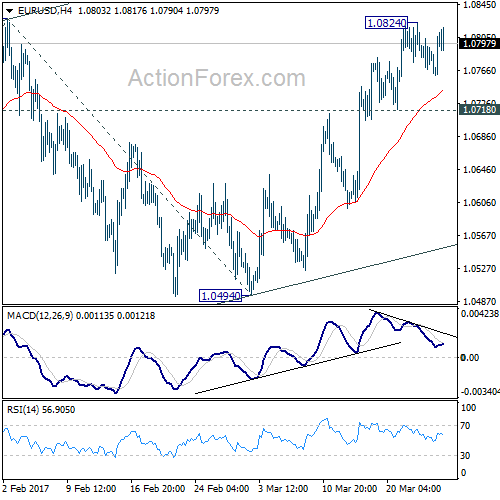
Initial bias in EUR/USD remains neutral this week first. Break of 1.0828 will target 100% projection of 1.0339 to 1.0828 from 1.0494 at 1.0983. However, as rise from 1.0339 is seen as a corrective move. We'd expect upside to be limited by 1.0983 to complete the correction. On the downside, break of 1.0718 minor support will turn bias to the downside for 1.0494 support first.
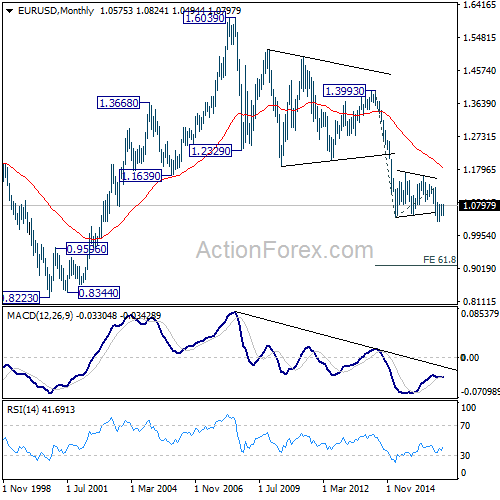
In the bigger picture, as long as 1.1298 key resistance holds, whole down trend from 1.6039 (2008 high) is still expected to continue. Break of 1.0339 low will send EUR/USD through parity to 61.8% projection of 1.3993 to 1.0461 from 1.1298 at 0.9115. However, considering bullish convergence condition in weekly MACD, break of 1.1298 will indicate term reversal. this would also be supported by sustained trading above 55 week EMA.
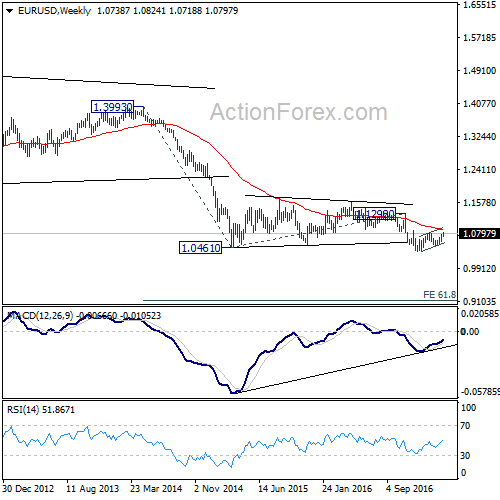
In the long term picture, the down trend from 1.6039 (2008 high) is still in progress and there is no clear sign of completion. We'd expect more downside towards 0.8223 (2000 low) as long as 1.1298 resistance holds. However, firm break of 1.1298 should now confirm long term reversal.
USD/JPY Weekly Outlook
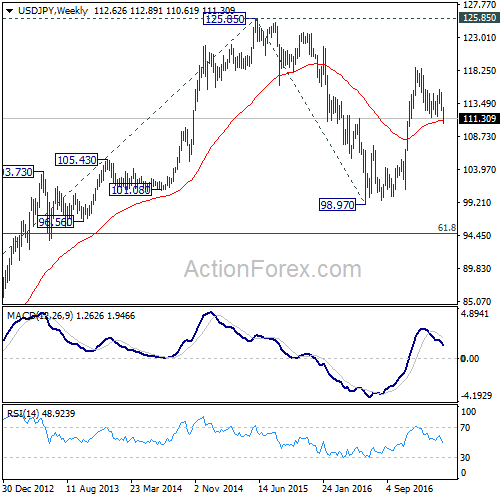
USD/JPY's decline from 118.65 resumed last week by taking out 111.58 support last week and reached as low as 110.62. 38.2% retracement of 98.97 to 118.65 at 111.13 was breached but there was no follow through selling yet. But in any case, price actions from 118.65 are still viewed as a correction for the moment.
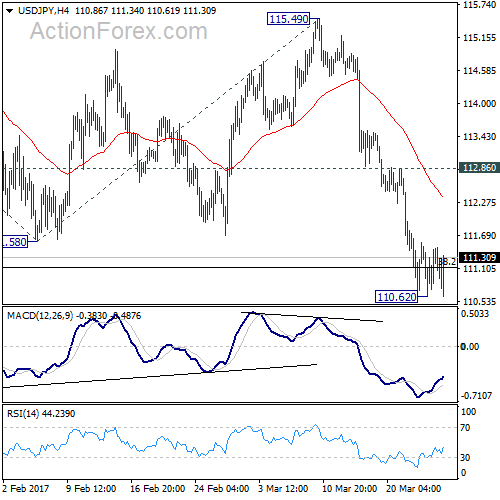
Initial bias is neutral in USD/JPY this week first. On the upside, break of 112.86 resistance will argue that a short term bottom is formed. In such case, intraday bias will be turned back to the upside for 115.49 resistance. Break will indicate completion of the correction from 118.65. Meanwhile, break of 110.62 will likely send USD/JPY to 100% projection of 118.65 to 111.58 from 115.49 at 108.42 to extend the correction.
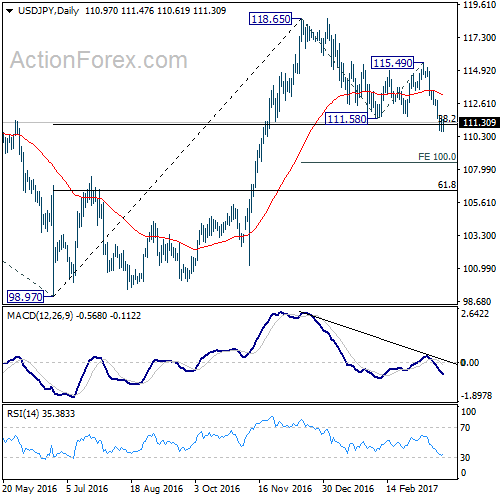
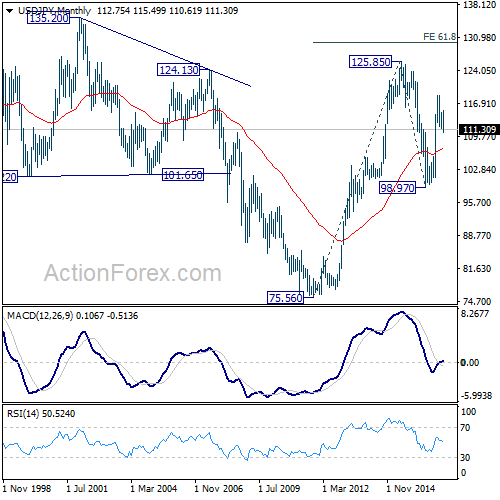
In the bigger picture, price actions from 125.85 high are seen as a corrective pattern. The impulsive structure of the rise from 98.97 suggests that the correction is completed and larger up trend is resuming. Decisive break of 125.85 will confirm and target 61.8% projection of 75.56 to 125.85 from 98.97 at 130.04 and then 135.20 long term resistance. Nonetheless, sustained trading below 55 week EMA (now at 111.08) will extend the consolidation from 125.85 with another fall through 98.97 before completion.
In the long term picture, the rise from 75.56 long term bottom to 125.85 medium term top is viewed as an impulsive move. Price actions from 125.85 are seen as a corrective move which could still extend. But, up trend from 75.56 is expected to resume at a later stage for above 135.20/147.68 resistance zone.
GBP/USD Weekly Outlook
GBP/USD rebounded to as high as 1.2530 last week but lost momentum since then. Overall outlook is unchanged that price actions from 1.1946 are developing into consolidation pattern with 1.2108 as another leg. While such consolidation could extend, the larger down trend is expected to resume at a later stage.
Initial bias in GBP/USD is neutral this week first. On the upside, above 1.2530 will target 1.2705/74 resistance zone. But we'd expect strong resistance from 1.2705/2774 resistance zone to limit upside and bring down trend resumption. On the downside, break of 1.2340 support will turn bias back to the downside for 1.2108 support. Though, sustained break of 1.2774 will extend the rise towards 1.3444 key resistance level.
In the bigger picture, fall from 1.7190 is seen as part of the down trend from 2.1161. There is no sign of medium term reversal yet. Sustained trading below 61.8% projection of 2.1161 to 1.3503 from 1.7190 at 1.2457 will target 100% projection at 0.9532. Overall, break of 1.3444 resistance is needed to confirm medium term bottoming. Otherwise, outlook will remain bearish.
In the longer term picture, no change in the view that down trend from 2.1161 is still in progress. Current momentum suggests that the down trend will go deeper than originally expected to 100% projection of 2.1161 to 1.3503 from 1.7190 at 0.9532.