Sample Category Title
Summary 3/27 – 3/31
Monday, Mar 27, 2017
[php_everywhere] [/php_everywhere]
Tuesday, Mar 28, 2017
[php_everywhere] [/php_everywhere]
Wednesday, Mar 29, 2017
[php_everywhere] [/php_everywhere]
Thursday, Mar 30, 2017
[php_everywhere] [/php_everywhere]
Friday, Mar 31, 2017
[php_everywhere] [/php_everywhere].
Weekly Market Outlook – Buy The Dip In EM Risk
FX Markets - Buy The Dip In EM Risk
After almost three months of an uninterrupted surge, emerging market currencies have finally taken a breather. In three months the ZAR has gained an impressive 12.20%, with MXN and KRW not far behind. In fact, among the liquid EM currencies, only the ARS, PHP and TRY saw losses against the USD. Last week's pullback in stocks spilled into rates and FX, raising questions on the sustainability of the current bullish view on risk appetite.
We suspect that this run is not over yet based on two key factors:
1) The Fed's policy path continues to be discounted with expectations for a June rate hike now below 60% probability. The FOMC's March communications were decidedly dovish. Also, Friday's CPI and durable goods orders ex transportation both disappointed, highlighting the fact that US investor optimism was based predominately on sentiment indicators rather than hard data (which as been unimpressive). In addition, Trump's failure to force through the Obamacare repeal bill indicates the challenge he faces in policy execution. This inability specifically threatens the administration's pro-growth agenda, which could accelerate the US economic outlook and position more hikes in play. We suspect that risk is skewed towards a less steep Fed policy path, but it's critical to highlight that the steady improvement in EM currencies means less sensitivity to US rates adjustment. A dovish Fed will further support EM risk taking.
2) EM growth is highly dependent on global trade, which President Trump has potentially endangered. Trump's protectionist trade policy was on display in the administration's first 30 day with the rejection of the TransPacific Partnership (TPP).
But other than some random, disorganised Twitter rants, his "America first" protectionism is more image then trade policy.
In our view, Trump's ability to create meaningful trade barriers such as punitive import tariffs has been discounted. We can just about hear Trump's words when discussing trade or FX policy "nobody knew that *insert policy here* could be so complicated." As with healthcare, just about everyone in the financial markets knows how complicated and non-mechanical these issues are. With the fear of excessive protectionism fading, EM currencies should continue to find buyers.
Economics - RBNZ Hopes The Market Will Collaborate
The New Zealand dollar, like most commodity currencies, has performed relatively poorly during the month of March as it failed to attract investors' attention in spite of the broad based USD weakness. On the other hand, its close neighbour the Australian dollar has had strong momentum over the same period. This divergence could be explained by the surprising switch in forward guidance of the Reserve Bank of New Zealand that delayed any tightening move back in early February. The last RBNZ meeting, which was held last week, was of the same stripe. Graeme Wheeler did not change his view on the overvaluation of the Kiwi, instead repeating the need for a weaker Kiwi "to achieve more balanced growth". He also allayed fears concerning rising inflationary pressure, arguing that the spike was temporary, stemming from a temporary rise in commodity prices.
Overall, the tone of the statement suggests that the RBNZ is ready to tolerate higher inflation in order to allow for a weaker Kiwi. This may be a good decision especially as core inflation has picked up at a slower pace than headline inflation. However, we are having a hard time believing that the market will collaborate. Indeed, the RBNZ has often struggled to drive the market the way it wanted. The sharp drop in US sovereign yields will force investors to switch in yield seeking mode. Moreover, Kiwi and Aussie rates have started to move in opposite direction last week with the Kiwi 2- year sovereign yields reversing momentum to reach 2.16% on Friday, while its Aussie counterpart slid to 1.75%. We favour long NZD positions, especially against the Australian dollar. NZD/USD has room for appreciation, even though the risk-off sentiment will limit risk appetite. AUD/NZD has already fallen 1.4% since mid-March and is now heading towards the next key support area at around 1.0755 (Fibo 38.2% on January-March rally).
Economics - SNB Releases Its Annual Report
In the latest annual report from the SNB, we have learned that the Swiss central bank bought around CHF67 billion in foreign currencies in order to defend the franc. Comparatively, this is lower than in 2015, when the floor was removed. Interventions amounted then at CHF86.1 billion.
The SNB still sees the franc as "significantly overvalued" and so the negative interest rate policy is more relevant than ever. The Swiss economy relies on the exports. Hence it is normal to consider medium and long-term risk valuation. For now, the central bank is sticking to its wait-and-see approach.
Europe's political uncertainties are weighing heavily on the EURCHF and we believe that bearish pressure shows no signs of easing. In terms of Swiss data, inflation has never been so high in the last five years at 0.6% y/ y and the unemployment rate remains moderate at 3.6%. Exports are a little more concerning with two consecutive declines in January and February (respectively -4% and -2.2%). In the short and medium-term, the Swiss Franc should remain below 1.0800 and the SNB is likely to intervene to avoid extreme strengthening.
What is certain is that the SNB is monitoring any development from the ECB which massive QEs keep running. We also believe that the ECB is likely to soon enter a tightening cycle - to reduce monetary policy divergence with the US - which in turn will definitely benefit the Swiss economy.
Currency-wise, it seems obvious that the Swiss National Bank is likely to increase currency intervention to defend the franc this year. Since the start of this year, the pace of intervention seems to have accelerated. In January total deposits were standing at CHF530 billion. Three months later, the deposits lies at CHF 557.2 billion. On top of that when looking at the price action of the EURCHF, selling pressures are way too important around 1.0800 and makes these interventions almost useless.
Themes Trading - Gold & Metal Miners
The sudden collapse in commodity prices in 2014 sent mining stocks into free fall. In the long term, however, precious metals - and gold in particular - are the perennial go-to sources of protection against inflation and economic downturns, something investors should be looking out for. The gold market is dynamic, and there are compelling reasons why gold producers could rally. Consumer demand remains solid, with around 2,500 tons of gold mined worldwide every year. Over the long haul, gold as a commodity has appreciated by more than 287% over the past 15 years; by comparison, the S&P 500 has gained less than 44% over the same period. In a period of central bank policy shifts, it is reasonable to envisage a rebound in metal prices - something mining stocks will benefit from. Gold miners are a good way to tap into the benefits of precious metals without paying storage costs.
Gold & Metal Miners theme can now be trading in an easy to execute Strategic Certificate.
The Weekly Bottom Line
HIGHLIGHTS OF THE WEEK
United States
- Stock markets inched lower this week as odds increase that the promise of regulatory reforms and tax cuts will be delayed.
- Normally falling stocks, dollar, oil, and Treasury yields would suggest concern about the health of the U.S. economy. However, the data this week remained supportive of an expansion in the U.S. and global economies in the first half of this year.
- Later today the U.S. congress will vote on a bill to amend the Affordable Care Act (ACA) that is likely to have market implications. If the bill passes, it moves onto the Senate, but if today's vote fails, future amendments to the ACA could be in doubt.
Canada
- The big-ticket economic attention-grabber this week was the federal government's 2017 budget. The budget was largely a stay-the-course type, with the federal government accepting larger deficits over the medium-term to push its spending agenda along.
- Budget aside, the economic data this week highlighted that the economy may outperform near-term expectations, with retail sales roaring back from a disappointing December reading. Motor vehicle and parts remain the biggest driver of retail spending, highlighting that consumer confidence remains strong in Canada. Having said that, inflation readings were soft, suggesting the Bank of Canada isn't likely to move anytime soon.
UNITED STATES - MARKETS TAKE A BREATHER
There was little in the way of data and news this week to move markets. Nevertheless, stock markets inched lower, as it became increasingly apparent that the promise of regulatory reforms and tax cuts is likely to be delayed beyond the summer. Despite the rate hike by the Federal Reserve last week, U.S. Treasuries rallied, with the 10-yr Treasury yield briefly dipping below 2.4% - roughly the going rate in play prior to the Fed jawboning the market in late February. Coinciding with these market moves has been a decline in oil prices and a weaker trade-weighted U.S. dollar.
Normally falling stocks, dollar, oil, and Treasury yields would suggest concern about the health of the U.S. economy. However, this is unlikely the reason behind the market moves this week. In fact, on a year-to-date basis, the S&P 500 is up 5%, and the 10-yr yield is less than 10 basis points from where it was at the end of last year, and about 50 basis points higher than when it was before the November election. Moreover, although oil prices have dipped below $US 50 per barrel, the recent weakness has more to do with rising supply than declining demand.
The only outlier is the trade-weighted dollar, which has dropped by about 2.5-3.5% since the start of the year, depending on which measure is used. But this too is not necessarily a result of a more negative outlook for the U.S. economy, but rather a reflection of stronger global economic growth. For example, growth in Europe is expected to be well in excess of its trend pace again in 2017 for the third consecutive year, and suggests that the next step for the ECB is likely to tighten rather than ease monetary policy. Strong economic activity by its trading partners should support demand for U.S. produced goods and services, although we still are of the view that net trade is likely to be a small drag on U.S. economic activity this year.
The admittedly sparse data this week is broadly consistent with this view. Preliminary survey data for March released this morning suggests that the Eurozone economy likely expanded at a slightly faster pace than in previous months. Conversely, according to the same survey data the U.S. economy likely saw growth slow a touch in March. Moreover, U.S. existing home sales in February dropped 3.7% m/m to 5.48 million units (annualized). Some payback was expected in existing home sales after an unexpectedly strong showing in January despite rising mortgage rates. Although sales declined, home prices rose 7.7% on a yearon- year basis, up from 6.4% y/y growth in the prior month. Home price growth was once again driven by a lack of inventory. While our outlook for the economic fundamentals driving the housing market remains optimistic, a persistent lack of supply could reduce affordability and act as a material headwind to the housing market.
In an environment of elevated policy uncertainty, every data point and every word uttered by policymakers seems to matter more to markets. Later today the U.S. congress will vote on a bill to amend the Affordable Care Act (ACA) that is likely to have market implications. If the bill passes, it moves onto the Senate. However, if today's vote fails, President Trump has threatened to leave the ACA unchanged, and in so doing reneging on one of his core campaign promises to repeal and replace it.
CANADA - MIND THE BUDGET GAP
'Tis the season for budgets, and the most anticipated one of them all (the federal Budget) was tabled on Wednesday of this week. The federal government is projecting larger deficits over the medium-term to push its spending agenda along.
The federal government embarked on a pretty aggressive spending plan last year and estimates of the medium-term deficit have been creeping up since. That deficit is expected to reach $28.5 billion in fiscal year (FY) 2017-18, or 1.3% of GDP and is now projected to be between $5 and $7 billion dollars higher per year over the medium-term than expected in Budget 2016. In fact, the government anticipates to still be running a deficit of $18 billion (0.8% of GDP) by 2021.
In large part, the higher deficit projections reflect more cautious economic assumptions. Still, the government opted not to introduce major revenue generating measures to help fill the gap. There were a few small items, such as raising taxes on alcohol and cigarettes, removing the public transit tax credit and applying the GST to Uber rides, but nothing that will substantially move the needle on revenues. Rather, the federal government added a few more investment dollars to its spending plan for hot-topic issues such as parental leave, affordable housing and skills and innovation. Funding for most of the new initiatives introduced in this budget however, has been shuffled out of prior planned projects and will only add a cumulative $4.8 billion to the deficit between fiscal years 2016-17 and 2020-21.
The course of action in this week's wait-and-see budget may be appropriate. The Canadian economy may prove a bit stronger in the near-term than what has been baked into this budget, which could give just a bit of a nudge to near-term revenues. This week's retail sales report was yet another sign that the Canadian economy is gathering considerable momentum in 2017. Retail sales were up 2.4% in January, the sharpest monthly gain in almost seven years. More importantly, motor vehicle and parts (+3.8% m/m) drove the gain, highlighting that Canadians are feeling confident in their future employment prospects. TD Economics is forecasting nominal GDP growth of 4.7% in 2017, compared to the federal government's more cautious estimate of just 4.1%. At the same time, the timing might not be right for restrictive fiscal policy given the extensive risks facing Canada and the global economy.
One of the key risks remains in the government's longterm interest rate outlook. This week's soft consumer price report showed that all of the Bank of Canada's measures of inflation are running below the 2% target, underscoring the view that the central bank will remain on hold at least until next year. However, TD Economics believes that ongoing Federal Reserve hikes could pull up the 10-year Government of Canada bond yield by 30 to 40 basis points in 2017 and 2018 above the Budget 2017 assumptions.
Still, while deficits remain on the horizon, the debt-to- GDP ratio is not expected to breach 30% over the forecast plan. This is quite low from a historical perspective, at half the peak reached in the late 1990's, leaving some fiscal room to work down the deficit only gradually.
Weekly Economic and Financial Commentary
U.S. Review
Hard Data Still Not as Spectacular as Survey Data
- Hard data from the U.S. housing market and durable goods orders from U.S. factories in February were mixed. Though readings were more muted than recent sentiment indicators, the hard data continue to point to a positive underlying trend.
- Existing home sales fell slightly in February, from January's strong read, but resales are still off to a strong start for the year. New home sales were boosted by warmer weather in February, pulling up the spring home buying season.
- Durable goods orders posted a gain in February, which was to be expected given the strong survey reads, but details were lackluster.
Housing Demand Still High in 2017
New data generally show a strong start to the year for the housing market. After January's cycle-high pace of existing home sales, contract closings dipped in February to a 5.48-million unit pace. This was somewhat expected as pending home sales, which are counted when a contract is signed and are a leading indicator for existing home sales, declined in January. Low inventory of homes for sale and higher mortgage rates were likely restraining resale activity. On the bright side, February's dip in resales allowed inventories to rebound slightly, but they remain 6.4 percent lower than the same time last year. There is now a 3.8-month supply of existing homes for sale, much lower than a balanced market, which would have around a 5.5-month supply. Lean inventories make this a sellers' market, as a typical home sold in February was on the market for just 45 days.
Similarly, now is a good time for home builders. Coinciding with the recent upswing in the NAHB/Wells Fargo Housing Market Index, a measure of builder sentiment, new home sales were up solidly in February. Besting consensus estimates, new home sales rose 6.1 percent in February to a 592,000-unit pace. The month ended with 266,000 new homes available for sale, a 5.4-month supply, which is down from January. Mild weather likely favored activity in the month, pulling the spring selling season forward into February. A correction is likely in coming months. Expectations of rising mortgage rates may have also played a role in the unseasonably strong showing in February. Still, underlying strength in the domestic economy supports housing demand. Job and income growth should continue to bring more potential homebuyers into the market, even as mortgage rates rise. Rising home prices and lean inventory of homes for sale should encourage more home construction going forward.
Still Waiting for Hard Order Data to Jump
Recent readings from the ISM manufacturing and regional Fed surveys of manufacturing activity have jumped much higher since the election. We continue to wait to see that jump reflected in hard data from the manufacturing sector. To be sure, factory data have firmed considerably from the weak patch that stretched from about mid-2014 to mid-2016 as manufacturers struggled with soft global demand, the strong dollar and a downturn in the energy sector. Much of those headwinds are largely fading and incoming data have reflected that. However, the upswing in survey readings we have witnessed since the election has yet to translate into the hard data. Durable goods orders for February bested expectations with a headline increase of 1.7 percent, but the underlying details were unimpressive. Orders of capital goods excluding defense and aircraft, which reflects demand for business investment in goods such as computers and machinery, declined 0.1 percent on the month, surprising forecasters who anticipated a 0.5 percent increase. Shipments in the same category are used to calculate GDP and were up 1.0 percent in February. Still, shipments reflect past activity, orders are what we watch to gauge demand going forward and, so far at least, businesses appear to be waiting to act on the excitement reflected in the survey data.
U.S. Outlook
Consumer Confidence • Tuesday
Consumer confidence continued to climb in February, rising 3.2 points to its highest level since July 2001. The present situation index climbed to 133.4, a new cycle-high, while expectations for the future recouped some of January's dip. Over the past year, views on both the present situation and future economic conditions have risen a sizable 18.4 and 22.5 points, respectively. The S&P 500 has jumped about 10 percent since the election, and home prices continue to rise amid relatively lean inventories. This has likely created a wealth effect which, coupled with the current administration's focus on economic growth and employment, have spurred much of the gain in consumer confidence.
We expect the consumer confidence index to moderate a bit from its recent highs. The index will likely remain near cycle-highs, however, which suggests some upside potential for the U.S. consumer in the months ahead.
Previous: 114.8 Wells Fargo: 113.1
Consensus: 113.6
GDP • Thursday
On Thursday we will receive the third look at economic growth in Q4. The initial round of revisions resulted in no change to the headline number, and we expect only minimal changes this time around. As we turn to Q1, economic growth once again looks a bit soft to start the year. Residential construction has been aided by warm weather, and business fixed investment looks likely to continue its gradual recovery. Government spending has been soft, however, and personal consumption looks likely to slow from the pace seen over the past few quarters. In addition, trade seems likely to weigh on growth, and we do not expect inventories to contribute as much as they have of late.
Through the volatility, real final sales to domestic purchasers, a measure of underlying domestic demand, has shown signs of a pick-up, a trend we expect to continue. Thursday's report also includes the first release of Q4 2016 corporate profits.
Previous: 1.9% Wells Fargo: 2.0%
Consensus: 2.0% (Quarter-over-Quarter Annualized)
Personal Income & Spending • Friday
Consumer spending started 2017 with a thud, falling 0.3 percent after accounting for inflation. Some of the weakness can likely be attributed to one-off factors, such as lower utilities spending due to unusually warm weather. A slow start to tax refund season in February could lead a one-off factor affecting spending at the margin. It remains to be seen if the robust gains in consumer confidence will translate into acceleration in consumer spending. As of January, the three-month annualized growth in real personal consumption was a trend-like 2.5 percent.
On the inflation front, both the headline and core PCE deflators are near the Fed's two percent inflation target. We expect inflation to remain firm, but the pace of gains will likely moderate as the base effects from the oil price slide begin to fade later this year. This should allow the Fed to meet its current projections of two more hikes in 2017 without warranting a more rapid pace of tightening.
Previous: 0.2% Wells Fargo: 0.2%
Consensus: 0.2 % (Spending)
Global Review
MPC: Between a Rock and a Hard Place?
- Real retail spending in the United Kingdom rose more than expected in February. That said, growth in retail spending has clearly downshifted in recent months. Higher inflation, which currently exceeds the Bank of England's two percent target, is eroding real income growth.
- For now, the Bank of England appears willing to allow inflation to exceed its target for an undisclosed period of time. We believe that the Monetary Policy Committee will refrain from hiking rates through at least the end of the year.
MPC: Between a Rock and a Hard Place?
Economic data that were released this week in the United Kingdom contained both good news and bad news. Let us start with the positive. Real retail spending rose 1.3 percent in February relative to the previous month. Not only did the outturn materially best the consensus forecast, but it more than reversed the 0.3 percent decline that was registered in January.
That said, the pace of retail spending in the United Kingdom has clearly downshifted over the past few months (top chart). If real retail spending in March remains unchanged at February's level, then spending will have contracted about 1 percent (not annualized) on a sequential basis in the first quarter. In Q4, real spending grew 1.2 percent despite the large decline registered in December. Consequently, spending momentum was weak entering 2017.
The culprit behind the spending slowdown seems to be the rise in inflation in recent months. As shown in the chart on the front page, the overall CPI inflation rate rose to 2.3 percent in February, the highest inflation rate in more than three years. Not only does the rise in the British inflation rate in recent months reflect the rebound in energy prices that has occurred over the past year, but it also reflects the effects of the sterling depreciation that has pushed up import prices. With growth in average weekly earnings remaining more or less constant in recent months (middle chart), the rise in inflation has eroded growth in real disposable income. Consequently, spending growth has slowed.
The simultaneous downshift in economic momentum and the rise in inflation present somewhat of a quandary for the Monetary Policy Committee (MPC) at the Bank of England. Does the MPC ease policy to shore up spending, does it raise rates to fight higher inflation, or does it keep policy on hold pending further developments? For now, the MPC has opted to remain on hold. In the statement that was released after its March 15 policy meeting, the MPC acknowledged that inflation likely will rise to 2-¾percent in coming months, which is well above its 2 percent target, before gradually drifting back toward target. For now, the MPC is willing to allow inflation to exceed its target for an undisclosed period of time. The MPC said that it could tighten policy in coming months if inflation moves even higher than it forecasts. Conversely, it could ease policy further if economic activity slows more than expected. In the meantime, the MPC appears to be in wait-and-see mode.
Prime Minister May is widely expected to formally trigger Article 50 of the Lisbon Treaty next week, thereby starting the two-year negotiating window that the United Kingdom and the European Union have to settle the terms of their divorce. Growth in investment spending has slowed over the past year or so, and a survey of investment "intentions" remains at a low level (right chart). The uncertainty that the Brexit negotiations will engender could weigh on investment spending going forward, giving monetary policymakers another reason to refrain from hiking rates. In our view, the MPC will indeed keep rates on hold through at least the end of this year.
Global Outlook
Germany IFO • Monday
The German IFO business climate and business expectations have remained relatively high and on an upward trend over the past several months, while the IFO current assessment index has seen an important improvement since mid-2016. This tends to indicate that the economic environment has continued to improve and markets should probably expect further improvement for Monday's release as the health of the global economy continues to improve.
Also on Monday, we will get the release of the retail sales index for February. This index has been very volatile both on a month-over-month basis as well as on a year-over-year basis. Still, it will be important for the domestic economy to see a rebound from the downwardly revised decline of 1.0 percent for January. A sustained improvement in domestic consumer demand will be a good complement to an improving global economy.
Previous: 111.0
Consensus: 111.1 (Business Climate)
Mexico Economic Activity • Monday
We have a call for a mild recession affecting the Mexican economy this year, and the release of the economic activity index for January will give us a first look at whether this call has a chance of becoming reality. Furthermore, many things happened in the first month of the year that could make the January number look even weaker than what otherwise would have been, like the 20 percent increase in gasoline prices and the ensuing social upheaval and discontent.
On Thursday, the central bank will decide if it continues with its tightening of monetary policy in order to counteract the more than doubling of inflation we are expecting for this year. The Mexican central bank has already increased the target interest rate by 250 basis points since June of 2016 and will probably continue with its higher interest rate campaign in March as it tries to reign in inflationary expectations.
Previous: 2.1%
China Manufacturing PMI • Thursday
The world will be looking closely at Thursday's release of China's manufacturing PMI for March on Thursday to see if the recent improvement in this index can be sustained. As of this week, markets believe that the index is going to remain at 51.6, which was the reading we had in February.
This manufacturing PMI, released by the National Bureau of Statistics tends to be biased toward manufacturing activity at state-owned enterprises. The Caixin manufacturing PMI index, on the other hand, tends to be biased toward measuring manufacturing activity of foreign owned firms. This index is scheduled to be released early the following week. However, both of these indices have remained above the 50 demarcation point during the past several months, so any improvement by these indices will be good news for the global economy.
Previous: 51.6
Consensus: 51.6
Point of View
Interest Rate Watch
Reality Sinks In
Financial markets pulled back this week, with the S&P 500 ending down and yields for U.S. Treasury maturing two or more years out also slipping. The decline in yields builds on a drop last week that followed a "dovish" hike by the FOMC.
Although comments from Fed officials in the weeks prior to the March meeting signaled that the timing of the first rate hike this year would be moved up, the FOMC left its outlook for the economy and interest rates at year-end virtually unchanged. The stable forecast calmed any fears that the Fed was may ramp up the pace of policy tightening later this year, leading benchmark yields out the curve to decline.
Doubt about the extent of reflation may also be creeping into investors' minds. Oil prices are down more than 10 percent since the start of the month, while core inflation is rising at an unhurried pace. Short term measures of inflation compensation, derived from 5-year TIPS spreads, fell to their lowest level since early February this week.
The biggest weight on markets this week, however, may be growing signs that the Trump administration could have a tough time getting its policies through Congress. The sharp rise in markets since the election suggests investors have banked on pro-growth policies from the new administration. However, as this week's showdown on the GOP's healthcare bill illustrated, unity among the Republican party should not be taken as a given (see Topic of the Week for more on the healthcare bill).
In addition, the time and political capital spent on replacing the Affordable Care Act as the first piece of major legislation from the new administration has pushed out the timing when tax reform is likely to be tackled.
We continue to expect growth and corporate profits to firm this year even in the absence of significant changes in fiscal policy. With growth picking up and the Fed set to hike a couple more times, the pullback in benchmark rates looks temporary, in our view.


Credit Market Insights
Unmet Consumer Credit Demand
This week, the Federal Reserve Bank of New York published results from its February 2017 Survey of Consumer Expectations (SCE) Credit Access Survey, which offers data on consumers' experiences and expectations related to credit demand and credit access. The results, which are published on a quarterly basis, reveal that the proportion of "discouraged" consumers rose, while respondents likely to apply for at least one type of credit over the next 12 months decreased. Credit application rates fell to 39.9 percent from 42.3 percent in October, the lowest rate since the series' inception in 2013. However, credit rejection rates also declined to 21.2 percent from 23.3 percent.
With regard to consumer expectations, respondents who reported that they are likely to apply for at least one type of credit over the next 12 months declined to 26.0 percent from 27.8 percent. Likewise, the expectation of having a credit application rejected rose. Mortgage applications displayed the most pronounced increase in this category, rising to 41.4 percent from 34.2 percent.
Despite the generally subdued outlook for credit expectations, the financial fragility metrics of U.S. households seemed to exhibit some optimism. The average probability of needing $2,000 for an unexpected expense in the next month was 32.5 percent, down from 34.1 percent. Moreover, the likelihood of coming up with $2,000 rose to 67.2 percent from 65.9 percent.
Topic of the Week
ACA Replacement Bill Still in Limbo
At the time of this publication, the long awaited replacement bill for the Affordable Care Act (ACA) is still pending. Known as the American Health Care Act, the proposed bill eliminates a number of tax provisions used to fund the ACA and jettisons the individual and employer mandates. The major reforms to the ACA include transforming Medicaid into a per capita allotment, expanding health savings accounts and providing a monthly tax credit for individuals to purchase insurance. On net, the analysis from the Joint Committee on Taxation (JCT) and the Congressional Budget Office (CBO) shows that the bill will reduce the federal deficit by $337 billion over the 2017-2026 period (CBO's "The American Health Care Act Cost Estimate," Mar. 2017). In the short-run, however, the immediate repeal of ACA-related taxes and the delay in Medicaid cuts would lead to an increase in the deficit, a factor already incorporated into our baseline deficit forecast.
The number of uninsured, relative to current law, is expected to increase by 14 million in 2018 and rise to 24 million by 2026 as more individuals opt out of purchasing insurance after the removal of the individual mandate. We expect a one or two quarter downshift in the pace of real consumer spending growth as individuals choose to cancel insurance coverage; however, this effect is likely too minimal on our baseline forecast. Higher insurance premiums for those remaining insured have the potential to crowd out other forms of consumer spending on the margin in 2018 and 2019. Besides the divisions within the Republican party likely resulting in potential amendments to the bill, there are procedural hurdles that need to be cleared before votes are taken in the Senate. With differing views on the bill between the House and Senate, there is likely to be a conference committee between the two chambers, further drawing out the legislative process. Our view is that this will likely push the debate over tax reform until after the August recess.


MPC: Between a Rock and a Hard Place?
Real retail spending in the United Kingdom rose more than expected in February. That said, growth in retail spending has clearly downshifted in recent months. Higher inflation, which currently exceeds the Bank of England's two percent target, is eroding real income growth.
For now, the Bank of England appears willing to allow inflation to exceed its target for an undisclosed period of time. We believe that the Monetary Policy Committee will refrain from hiking rates through at least the end of the year.
Economic data that were released this week in the United Kingdom contained both good news and bad news. Let us start with the positive. Real retail spending rose 1.3 percent in February relative to the previous month. Not only did the outturn materially best the consensus forecast, but it more than reversed the 0.3 percent decline that was registered in January.
That said, the pace of retail spending in the United Kingdom has clearly downshifted over the past few months (Figure 2). If real retail spending in March remains unchanged at February's level, then spending will have contracted about 1 percent (not annualized) on a sequential basis in the first quarter. In Q4, real spending grew 1.2 percent despite the large decline registered in December. Consequently, spending momentum was weak entering 2017.
The culprit behind the spending slowdown seems to be the rise in inflation in recent months. As shown in Figure 1, the overall CPI inflation rate rose to 2.3 percent in February, the highest inflation rate in more than three years. Not only does the rise in the British inflation rate in recent months reflect the rebound in energy prices that has occurred over the past year, but it also reflects the effects of the sterling depreciation that has pushed up import prices. With growth in average weekly earnings remaining more or less constant in recent months (Figure 3), the rise in inflation has eroded growth in real disposable income. Consequently, spending growth has slowed.
The simultaneous downshift in economic momentum and the rise in inflation present somewhat of a quandary for the Monetary Policy Committee (MPC) at the Bank of England. Does the MPC ease policy to shore up spending, does it raise rates to fight higher inflation, or does it keep policy on hold pending further developments? For now, the MPC has opted to remain on hold. In the statement that was released after its March 15 policy meeting, the MPC acknowledged that inflation likely will rise to 2-¾percent in coming months, which is well above its 2 percent target, before gradually drifting back toward target. For now, the MPC is willing to allow inflation to exceed its target for an undisclosed period of time. The MPC said that it could tighten policy in coming months if inflation moves even higher than it forecasts. Conversely, it could ease policy further if economic activity slows more than expected. In the meantime, the MPC appears to be in wait-and-see mode.
Prime Minister May is widely expected to formally trigger Article 50 of the Lisbon Treaty next week, thereby starting the two-year negotiating window that the United Kingdom and the European Union have to settle the terms of their divorce. Growth in investment spending has slowed over the past year or so, and a survey of investment "intentions" remains at a low level (Figure 4). The uncertainty that the Brexit negotiations will engender could weigh on investment spending going forward, giving monetary policymakers another reason to refrain from hiking rates. In our view, the MPC will indeed keep rates on hold through at least the end of this year.
Week Ahead Trump Administration Fails with Healthcare Bill
Dollar softer after week full of political uncertainty
The USD ended the week with a muted market reaction as the Trump administration pulled the healthcare bill as there was a lack of support from Republicans to pass the bill into law. The Trump administration has lost momentum as their choice of policies to champion out of the gate were not the ones the market expected after a Trump win in the U.S. election. The comments from House Speaker Ryan and President Trump is now to focus on pro-growth policies which were the ones that sparked the Trump trade, also known as the Reflation trade.
The week of March 27 to 31 will feature a light economic data calendar with the highlight being the German Business Confidence on Monday, March 27 at 4:00 am EDT, the U.S. Consumer Confidence on Tuesday, March 28 at 10:00 am.
The silver lining for the dollar on the failure to push the healthcare bill is that it clears the way for awaited reforms such as taxes and infrastructure spending. Treasury Secretary Steve Mnuchin said earlier today that a tax overhaul was coming soon even before of the healthcare bill was pulled. In his words tax reform is a lot simpler than health care. FOMC speakers will be also front and center with Evans, Kaplan, and Kashkari set to speak at several events during the week.
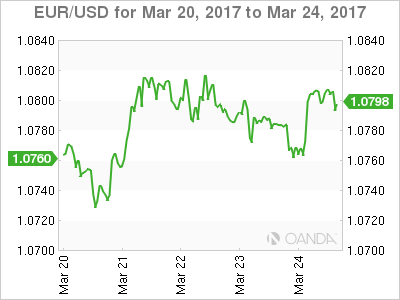
The EUR/USD gained 0.542 percent in the last five trading days. The single currency is trading at 1.0805 as President Trump's healthcare bill faces strong opposition. The President has declared that if the bill is not approved on Friday he will leave Obamacare in place.
There were few economic indicators released this week in Europe and the United States. Unemployment claims in the U.S. came in higher than expected at 261,000 with core durable goods also missing forecasts with a 0.4 percent gain.
The Trump administration is proving to be one of the fastest to lose the post election momentum. When he was the president-elect Trump was able to get markets excited with the promise of pro-growth policies focused on tax stimulus and infrastructure spending. The Trump trade started to crumble when due to political reasons the first policies signed by President Trump were aimed at immigration, anti-trade and now healthcare reform facing tough opposition form the Democratic party and in the case of healthcare even from Republicans.
On Monday, March 27 the German Ifo Business Climate will be released at 4:00 am EDT. Confidence from German manufacturers, builders, wholesalers and retailers participate in the survey that has been improving slowly since September 2016. Consumer confidence in the U.S. will be released on Tuesday, March 28. The disconnect from strong consumer confidence and softer retail sales is expected to continue with the release of the Conference Board data. The Final GDP will be released on Thursday, March 30 at 8:30 am EDT. The third release on the fourth quarter gross domestic product for the United States.
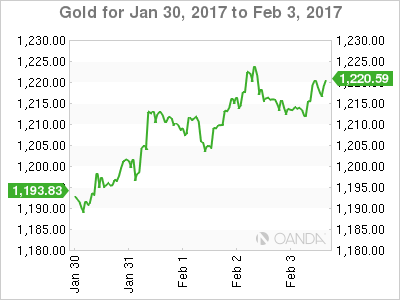
XAU/USD gained 1.806 percent in the past five days. The price of gold is trading at $1,253 as political uncertainty surrounding the healthcare bill in the U.S. made the yellow metal increase its appeal as a safe haven. Gold rose against the USD as the greenback lost ground ahead of the healthcare bill in congress. Eventually the bill was pulled for lack of support and it raises questions marks about the future of Trump policies in particular fiscal stimulus and infrastructure.
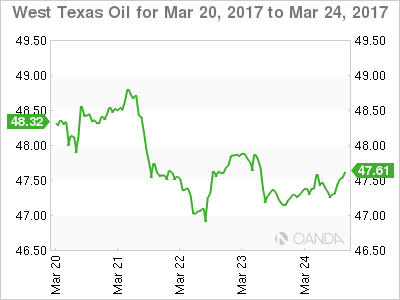
Oil lost 2.498 percent in the least week. The price of West Texas is trading at 47.47 as the effects of the Organization of the Petroleum Exporting Countries (OPEC) production cut agreement are being offset by higher inventories in the U.S. as more shale producers are coming online. U.S. drillers added the most oil rigs since January.
There is a meeting in Kuwait this Sunday where OPEC and non-OPEC members will discuss the future of the production cut agreement and a possible extension. The weakness of the USD has kept the price of oil from falling further, but as doubts emerge around the next agreement and the impact producers that are not part of it could have as they ramp up production as prices are stable.
Market events to watch this week:
Monday, March 27
- 4:00am EUR German Ifo Business Climate
Tuesday, March 28
- 10:00am USD CB Consumer Confidence
- 10:10am CAD BOC Gov Poloz Speaks
Wednesday, March 29
- 10:30am USD Crude Oil Inventories
Thursday, March 30
- 8:30am USD Final GDP q/q
- 8:30am USD Unemployment Claims
Friday, March 31
- 4:30am GBP Current Account
- 8:30am CAD GDP m/m
*All times EST
UK Government to Trigger Brexit Process, Key Data in Focus
Next week's market movers
- In the UK, the Brexit journey will officially begin. PM May is expected to trigger Article 50 of the Lisbon Treaty, which will set the stage for two years of negotiations.
- In Euro area, preliminary inflation data for March will be closely followed amid mounting speculation regarding whether and when the ECB could begin to reduce its stimulus dose.
- From the US, we get the core PCE price index for February, the Fed's favorite inflation measure. It could have a notable impact on market expectations regarding the timing of the next hike.
- We also get key economic data from Germany, the US, the UK, and Japan.
On Monday, we get Germany's Ifo survey for March. The forecast is for the expectations index to have risen somewhat, while the current conditions figure is expected to have ticked down. We see the risks surrounding the current conditions forecast as skewed to the upside, perhaps for an increase instead of a marginal fall. We base our view on the ZEW and PMI surveys for the month, both of which showed increased optimism in the German economy. In fact, the PMIs indicated that the German economy is growing at its strongest pace for nearly six years, something that could also be reflected in the Ifo survey.
On Tuesday, the economic calendar is light, with no major events or indicators due to be released.
On Wednesday, the main event will be in the UK, where PM May is expected to trigger Article 50 of the Lisbon Treaty and commence the formal process for leaving the EU. We do not expect the actual triggering to be a particularly big market mover for sterling, as the move and timing have been signaled repeatedly over the past months and weeks. However, this is not an event to overlook as it will mark the beginning of two years of negotiations between the two sides. The most crucial issue, at least for financial markets, will be what kind of trade deal will be agreed, if one is agreed at all. Therefore, the pound's forthcoming direction may be determined to a large extent by news headlines regarding how the negotiations are developing, particularly on the subject of trade. Signs that the UK is likely to end up with no free trade agreement, referred to as a "hard Brexit", could lead to further downside in the pound. However, given that much of the "hard Brexit" rhetoric may already be priced into the battered pound following months of tough comments from PM May, we believe that the political risks surrounding GBP are likely asymmetrical. Any positive developments during the negotiation process could generate a bigger upside reaction than the corresponding downside in case of the anticipated "hard Brexit" outcome.
On Thursday, we get Germany's preliminary CPI figures for March, just one day ahead of Eurozone's. The forecast is for the nation's CPI to have slowed to +1.9% yoy from +2.2% yoy previously, something that would be exactly in line with the ECB's target of "below, but close to, 2%". What's more, we think that any potential slowdown in the CPI will likely be owed to temporary factors, such as past movements in the prices of food and energy. We base that assumption on the fact that the nation's composite PMI survey for the month indicated that inflationary pressures remained extremely sharp, with firms raising their prices at the strongest rate since 2011. As a result, we doubt that any modest slowdown in headline inflation will be particularly worrisome for the ECB.
From the US, we get the final estimate of Q4. The forecast is for the figure to be revised up from the 2nd estimate, albeit marginally. Nonetheless, considering that the 1st quarter is almost over, we will treat these data as outdated. After all, it has only been a few days since the Fed's latest decision to hike interest rates. We think that market participants will now look forward to the release of the 1st estimate of GDP for Q1, due out on the 28th of April, in order to have an up-to-date indication of how the US economy is performing and thereby, adjust their expectations with regards to the timing of the next increase in borrowing costs.
On Friday, during the Asian morning, we get CPI data for February from Japan. In the absence of any forecast, we see the case for the core rate to have remained unchanged, and for the headline rate to have declined. We base our view on the nation's forward-looking Tokyo CPIs for February, where the core rate held steady, while the headline rate dropped notably. Even though a pullback in the headline rate may be discouraging news for BoJ policymakers, as long as the core rate does not fall, we do not expect this to spark speculation regarding further BoJ easing. The Bank could look through the decline in the headline rate as being transitory. With what we know today, we continue to expect the Bank to keep its ultra-loose QQE with yield-curve control framework unchanged in the foreseeable future. Although two BoJ policymakers have consistently called for reducing stimulus somewhat, most of the Board appears to have no intention of doing so, at least not until there has been significant progress in the profile for inflation, something not apparent yet.
From China, we get the official manufacturing and non-manufacturing PMIs for March, and then on Saturday, we get the nation's Caixin manufacturing index for the month.
From Eurozone, we get preliminary CPI data for March. The forecast is for the headline CPI rate to have ticked down to +1.8% yoy from +2.0%, while the core rate is expected to have remained unchanged for the fourth consecutive month. The focus will probably be on the core CPI rate, following repeated signals from ECB policymakers that the Bank is "looking through" movements in the headline rate, which are mostly a result of temporary energy-related effects. Thus, investors are likely to pay a lot of attention to the core figure for any potential surprises, amid mounting speculation regarding whether and when the ECB is likely to begin to reduce its monetary stimulus dose. Eurozone's PMI surveys for March were particularly upbeat on the subject of inflation, indicating that average prices charged for goods and services rose at the steepest rate since 2011. If incoming data continue to show mounting inflationary pressures, combined with robust economic growth, we expect the ECB to sound gradually more hawkish at its upcoming meetings, thereby preparing market participants for an eventual tightening, perhaps as early as next year. However, something like that is conditional upon the core CPI rate establishing an uptrend in coming months.
On Friday, we get the preliminary manufacturing and services PMIs for March from several European nations and the Eurozone as a whole. Most of these indices are expected to have ticked down, but to still remain at elevated levels. Considering that all of these surveys are expected to show that Eurozone's economy continues to perform well, we believe that they are likely to be another set of pleasant news for ECB policymakers, who at their latest meeting shifted to a more optimistic tone. Although President Draghi reiterated that there is no convincing upward trend in the core CPI yet and as such the Bank will keep its stimulus program unchanged, he made it clear that there is diminished willingness among the Governing Council for any more extraordinary easing measures. If incoming data continue to show that economic growth and inflationary pressures are gradually picking up, then we would expect the ECB to drop more dovish aspects of its forward guidance in coming meetings. We think that the Bank's next step is to remove the word "lower" from the reference regarding rates remaining at current, or lower levels in the foreseeable future.
In the UK, the final estimate of Q4 GDP is due out. Given that these data will be released on the final day of Q1, we see them as being outdated as well. However, we think that there is a particular component of the report that could attract market attention: business investment. The 2nd estimate was very interesting, because even though overall economic growth was revised upwards, business investment was revised significantly lower, with the updated numbers actually showing contracting investment. This generated concerns that the first real impact of Brexit-related uncertainties has already shown up, as firms appeared hesitant to invest ahead of the impending negotiations. As a result, we expect investors to look to the release of the 1st estimate of Q1 GDP, due out on the 28th of April, in order to determine whether this was a one-off, or if Brexit jitters have already began to weigh on economic growth.
From the US, we get personal income and spending data for February. Expectations are for both income and spending to have risen at the same pace as the previous month. We see the risks surrounding the spending forecast as skewed to the downside, perhaps for a slight slowdown, considering that retail sales slowed notably during the month.
What's more, we also get the core PCE price index for February, though no forecast is available yet. Nevertheless, considering that this is the Fed's favorite inflation measure, and that this rate has been range-bound since early 2016, it is likely to attract a lot of attention as investors try to determine the timing of the next rate hike. Our own view is that the core PCE rate may have remained unchanged, with risks skewed to the downside. The Price sub-indices of the nation's ISM manufacturing and non-manufacturing PMI surveys for February ticked down, indicating that although prices continued to rise at a sharp pace, they rose somewhat slower than previously. What's more, the core CPI rate for the same month ticked down, indicating that the latest pick-up in headline inflation is probably due to temporary factors, such as February's yoy slowdown in the oil uptrend.
USD Remains in Wait-and-See Modus
Headlines
US stocks open positively with the Nasdaq outperforming (0.57%), apparently confident that the House will pass the health care act today. European equities are narrowly mixed.
The euro zone economy is sparkling according to the latest PMI's, growing at a pace that easily explains the hints from some ECB policymakers of a pull-back from their easy-money regime. The composite PMI unexpectedly increased from 56 to 56.7 (vs 55.8 expected), the joint highest reading since Q1 2011.
US businesses boosted their orders for long-lasting manufactured goods in February for a second month running (1.7% m/m from 2.3% m/m In January). A closely-watched gauge that tracks investment spending was also better than expected (1.0% m/m from -0.3% m/m in January).
St. Louis Fed Bullard said that the Fed should be allowing the balance sheet to normalize naturally now by ending its reinvestment policy. Normalizing the BS during relatively good times is a good idea in case the Fed is forced to resort to BS policy in a future downturn, he added. There is no urgency to raise rates, according to Bullard.
ECB chief economist Praet stood by the ECB's pledge to keep its policy easy after comments by other rate-setters raised questions about the bank's next moves. He also took on euro-hostile movements, saying they were misleading people and hiding the fact that reverting to the old currency would involve huge costs for the population at large.
The Bank of Russia signalled a new easing cycle may be in sight after unexpectedly reducing borrowing costs from 10% to 9.75% for the first time since September, breaking with guidance last month that called into question its room for rate decreases in the first half.
Rates
Stellar EMU PMI's, but waiting game continues
Global core bonds traded with a small upward bias today, ignoring mixed eco data. EMU PMI's recorded another monthly increase, matching the highest level since Q1 2011. US durables goods orders also surprised on the upside, but the forward looking capital goods orders component disappointed. Neither eco report triggered market reaction. Investors await the outcome of the vote in the US House of Representatives on the Republican plan to dismantle Obamacare. Failure to push the bill through could signal problems ahead for his economic agenda and might falter markets' faith in the reflation trade. In that case, we expect more of Tuesday's risk off scenes with higher US Treasuries and a test of 2.3% support in the US 10-yr yield. The market reaction in case of a "novote" will probably be bigger than the relief rally (lower US Treasuries) in case of a "yes-vote". St. Louis Fed governor Bullard confirmed that he's rate projections are the lowest in the Fed's dot plot, but advocates halting the Fed's reinvestment policy to shrink the balance sheet starting H2 2017.
At the time of writing, changes on the German yield curve range between -2 bps (10-yr) and +0.3 bps (2-yr). Changes on the US yield curve vary between +0.5 bps (2-yr) and -0.9 bps (30-yr). On intra-EMU bond markets, 10-yr yield spread changes versus German narrowed up to 3 bps (Portugal). Portugal recorded its smallest budget deficit (-2.1% of GDP) in 40 years.

Currencies
USD remains in wait-and-see modus
Today, major USD cross rates were in a wait-and-see modus, as investors counted down to the vote on the US healthcare bill. EUR/USD gained slightly ground in European morning trading on strong EMU PMI's. The US durable orders were OK, but without a USD reaction. EUR/USD is again trading in the 1.08 area. USD/JPY is changing hands in the low 111 area.
Overnight, markets saw a rising chance that the last changes to the healthcare Bill would secure enough support for the bill to pass the House vote. This supported risky assets (equities) in Asia.. USD/JPY rebounded from yesterday's lows and filled offer just below 111.50. The dollar also gained slightly ground against the euro and traded in the 1.0760/70 area. The dollar rebound was supported a slight rise of US yields.
The focus of global FX trading remained on the fate of the US healthcare bill/vote. However, the EMU data also played a minor role. The French and German PMI's were much stronger than expected resulting in an EMU composite PMI of 56.7 (vs 55.8 expected). The strong EMU PMU had little impact on European yields and on the interest rate differential between the US and Europe. However it propelled EUR/USD back to the 1.08 area. At the same time, global risk sentiment remained cautious ahead of the Trumpcare vote, pushing USD/JPY back to the 111 barrier, as some end of quarter yen buying might have been at work.
US durable orders were mixed with the headline figure printing marginally stronger than expected. The report had no lasting impact on the dollar. For now, FX and interest rate markets stay in wait-and see modus. Stock are better bid going into the vote. USD/JPY trades in the 111.20 area. EUR/USD is changing hands just below 1.08.

Sterling rebound takes a breather
Overnight, dovish comments from BoE's Vlieghe caused some profit taking on the recent sterling rally. Admittedly most of the correction occurred in (thin) Asian trading. Cable settled in a tight range close to, mostly slightly below the 1.25 barrier in Europe. The rebound of EUR/GBP continued during the morning session due to broader euro gains after the strong EMU PMI's. EUR/GBP returned to about 0.8650. The BBA loans for home purchases were weaker than expected, but ignored.

Ideas for Oil Trading
There is a strong "bearish sentiment" on the oil market since the beginning of March. The WTI (#CL) futures have reduced by more than 10% during this time. The oil prices have reached the 47.00 USD support level. We can observe a flat (47.00-49.00 USD) currently.
The growth of petroleum resources reserves is expected according to the latest information from the US DOE and the API. We should keep in mind that the OPEC agreement that was adopted last year can't give any support to the oil quotes now. The next meeting of this organization will take place on March 25-26. But in case it doesn't take any strong measures, the downward trend may extend.
Another important event we have pay attention to is the report of Baker Hughes. It will be released on March 24, at 6:00 pm (GMT). If the data from the report announces the increase of drilling rigs, the minimal prices for the WTI oil may rise to 47.00 USD per barrel.
Technical analysis
Support level: 47.00 USD
Resistance levels: 49.00 USD, 51.50 USD, 54.00 USD
In the medium term we should expect the domination of sales on the "black gold market". Due to this fact I recommend opening short positions.
Source: tradingview.com
Conservative traders can wait for a correction to 50.0-61.8% (50.50-51.30 USD). After reaching this level, the entry points for selling oil could be found. Taking profit is likely to be at the 47.00 USD level.
Selling oil is possible after overcoming 47.00 USD as well. The price can move to 45.00 USD.
There may be a correction of #CL as well. The divergences of the MACD histogram and of the price have appeared. They indicate a possible reversal.
Aggressive traders will get an opportunity for opening counter-trend transactions, if the price overcomes the 49.00 USD local resistance. The price may move to the 50.50-51.30 USD zone in case of correction.
Durable Goods: Moderate Improvement in Capex Spending
Durable goods orders rose 1.7 percent in February on another strong month for aircraft orders, while orders for January were revised higher. Core orders slipped 0.1 percent, but continue to improve on trend.
Aircraft Lifts Headline, But Cracks in Auto Sector Emerging
For the second month in a row, durable goods orders came in stronger than expected, but disappointed in the details. Orders for long-lasting goods rose 1.7 percent in February (versus expectations for a 1.4 percent rise). In addition, orders in January were revised up and are now reported to have increased 2.3 percent (versus 2.0 percent previously).
The beat can be traced largely to another solid month for aircraft orders. After more than an 80 percent increase in January, orders for notoriously volatile nondefense aircraft rose almost another 50 percent.
Elsewhere, however, orders were less impressive. Orders for defense goods, which are also volatile from month to month, fell 8.3 percent amid falling aircraft orders. Potential cracks in the auto sector, which has been a bright spot in recent years, are beginning to emerge. Orders for vehicles & parts fell 0.8 percent and are nearly flat over the past year. The pullback in orders (and shipments over the past two months) is consistent with the softer sales environment since early this year. After falling the past three months, inventories, at least at the manufacturing stage, remain contained and should limit the near-term hit to production for motor vehicles & parts. Excluding transportation, orders rose 0.4 percent, which was also a bit softer than what markets were looking for. However, orders for this group were revised a couple ticks higher in January, leaving the level of orders about on par with expectations.
Despite a Weak February, Capex Spending Still Set to Improve
Our preferred barometer of near-term business spending, nondefense capital goods orders ex-aircraft, posted the biggest miss in February. Orders for this component slipped 0.1 percent compared to expectations for a 0.5 percent gain. Still, core orders indicate stronger momentum for capital expenditures in the coming months, having risen at a 9.1 percent average annualized pace over the past three months - the fastest clip in two and a half years.
Shipments have also improved, pointing to stronger outlays in Q1. Total shipments were up 0.3 percent in February. Excluding defense, however, capital goods shipments were down slightly for a second straight month, and point to only a moderate pickup in private equipment spending in Q1.
The strengthening in core orders of late still looks a bit weak when compared to softer data like the purchasing managers indices. Business optimism has been at cycle highs since the start of the year, but has yet to translate into commensurate strength in real activity. Nevertheless, we still look for business spending to improve in the coming months given the general strength of the survey data as well as the improvement in growth overseas and improving corporate profits.