
Sample Category Title
EUR/JPY Elliott Wave Analysis
EUR/JPY - 121.95
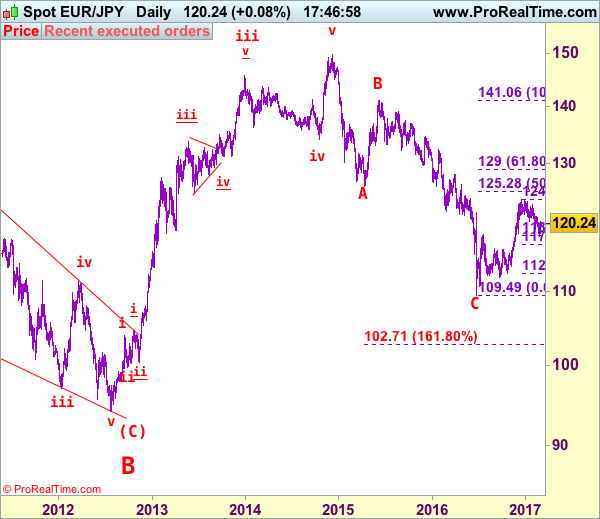
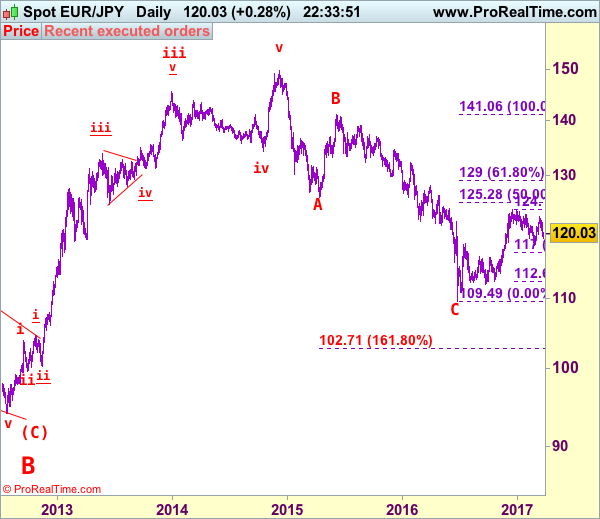
EUR/JPY: Wave v as well as larger degree wave (C) ended at 94.11 and first leg of larger degree wave C upmove has possibly ended at 149.79 and wave 2 correction has possibly ended at 109.49.
The single currency ran into renewed selling interest at 121.84 earlier this week and has dropped quite sharply, suggesting the fall from 122.89 top (last week’s high) is still in progress, this move also signal the rebound from 118.24 has ended at 122.89, hence downside risk remains for further weakness to 119.00-10, however, still reckon said support at 118.24 would remain intact and bring another rebound later. Looking ahead, only a break below said support at 118.24 would retain bearishness and signal the erratic decline from 124.10 top has resumed for further fall to 117.50-60 and later towards 117.00 (61.8% Fibonacci retracement of 112.61-124.10) but downside should be limited to 116.00.
The daily chart is labeled as attached, early selloff from 169.97 (July 2008) to 112.08 is wave (A) of B instead of end of entire wave B and then the rebound from there to 139.26 is wave (B), hence, wave (C) has possibly ended at 94.12 with a diagonal triangle as labeled in the daily chart, hence upside bias is seen for further gain. Recent rally above indicated retracement level at 116.69 (50% Fibonacci retracement of the intermediate fall from 139.26-94.12) adds credence to this view and signal major reversal has commenced but first leg of this wave C has possibly ended at 149.79, hence wave 2 has commenced with wave A ended at 126.09, followed by wave B at 141.06, wave C commenced and could have ended at 109.49, above 125.00 would add credence to this view.
On the upside, although initial recovery to 120.40-50 cannot be ruled out, reckon upside would be limited to 120.70-75 and bring another decline later. Only above said resistance at 121.84 would abort and signal the retreat from 122.89 has ended instead, bring further gain to 122.25-30, however, as broad outlook remains consolidative, reckon upside would be limited and said resistance at 122.89 would remain intact.
Recommendation: Sell euro at 120.50 for 118.50 with stop above 121.50.
To re-cap the corrective upmove from the record low of 88.93 (18 Oct 2000), the wave A from there is subdivided as: 1:88.93-113.72, 2:99.88 (1 Jun 2001), 3:140.91 (30 May 2003), 4:124.17 (10 Nov 2003) and 5 ended at record high of 169.97 (21 Jul 2008). The brief but sharp selloff to 112.08 is viewed as a-b-c x a-b-c wave (A) of B. The subsequent rebound to 139.26 is (B) of B and (C) of (B) has possibly ended at 94.12 and in any case price should stay well above previous chart support at 88.93, bring rally in larger degree wave C towards 150.00.
USD/CHF Elliott Wave Analysis
USD/CHF – 1.0125
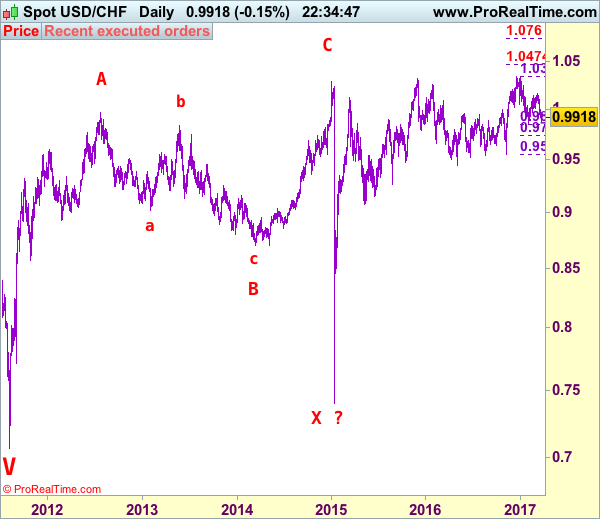
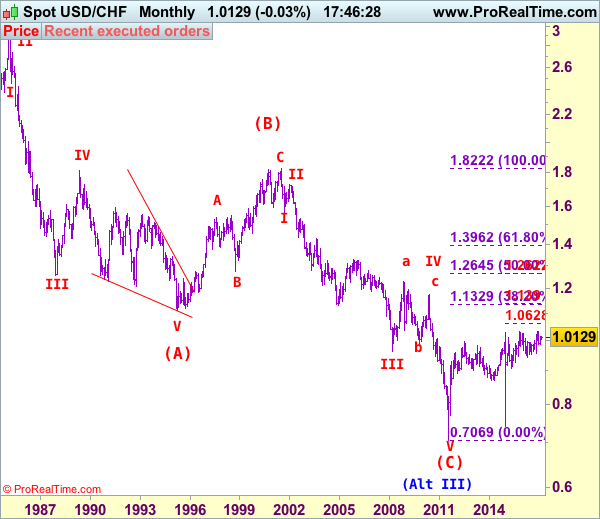
USD/CHF – Wave IV ended at 1.1730 and wave V has possibly ended at 0.7068
The greenback dropped again after last week’s selloff, suggesting the decline from 1.0171 top is still in progress and although price has recovered from 0.9882, reckon upside would be limited to resistance at 1.0003 and bring another decline later, below said support at 0.9882 would bring retest of support at 0.9861. Looking ahead, only a break below this level would confirm another leg of major fall from 1.0344 top is underway for further fall to 0.9800 and possibly towards 0.9735-40, however, near term oversold condition should prevent sharp fall below 0.9675-80 and price should stay well above 0.9600, bring rebound later.
Our preferred count on the daily chart is that early selloff to 0.9630 is an end of the larger degree wave III and major correction is unfolding from there with a leg ended at 1.2298 (Nov 2008 with (a): 1.0625, (b):1.0011 and (c):1.2298), wave b ended at 0.9910 with (a): 1.0370, (b): 1.1967, (c): 0.9910. The rise from there to 1.1730 is the wave c which also marked the end of wave IV and wave V has possibly ended at 0.7068.
On the upside, whilst initial recovery to resistance at 1.0003 cannot be ruled out, reckon previous support at 1.0060 would cap upside and bring another decline later. Only a daily close above 1.0060 would suggest low is formed instead, bring a stronger rebound to 1.0105-10 but price should falter below said resistance at 1.0171. In the unlikely event dollar breaks above said resistance at 1.0171, this would revive our bullish view for the erratic rise from 0.9861 to extend further gain to 1.0200 and possibly test of resistance at 1.0248, however, a daily close above there is needed to signal the retreat from 1.0344 has ended at 0.9861, bring eventual retest of 1.0344. Looking ahead, only break of said resistance at 1.0344 would retain bullishness and extend the major rise from 0.7401 (2015 low) to 1.0400 and later towards 1.0470-75 but upside should be limited to 1.0500 and price should falter below 1.0600.
Recommendation: Sell at 1.0000 for 0.9800 with stop above 1.0100.
Dollar's long-term downtrend started from 2.9343 (Feb 1995) and it was unfolding as a (A)-(B)-(C) with (A): 1.1100, (B): 1.8310 (26 Oct 2000), then followed by another impulsive wave (C) with wave III ended at 0.9630 (Mar 2008). Under this count, correction in wave IV has possibly ended at 1.1730 and wave V already broke below support at 0.9630 and met indicated downside target at 0.7500 and 0.7400. The reversal from 0.7068 suggests the wave V has possibly ended and the breach of resistance at 0.9595 add credence to this view and indicated upside target at 1.0000 had been met, however, the sharp retreat from 1.0296 to 0.7401 suggests choppy trading would be seen but price should stay above said record low at 0.7068.
Weekly Focus: UK Finally Filing for Divorce
Market movers ahead
- Comments from the last FOMC meeting indicated that the Fed will be willing to let inflation slightly overshoot the 2% target. Thus, we expect the PCE core inflation figures on Friday to attract special interest. We expect an increase of 0.2% m/m, implying 1.7% y/y.
- In the euro area, we are due to get HICP inflation figures for March. We believe headline inflation will decline to 1.6%, partly as the energy price inflation support starts to wear off. We also look for a small increase in the German IFO expectations, as other surveys still indicate optimism in the business economy.
- In the UK, we look for the Article 50 trigger on Wednesday and the EU's Brexit guidelines, which should be published within 48 hours of Article 50 being triggered.
Global macro and market themes
- We see an increasing risk of a market correction.
- We see less support for risk sentiment, as we are close to a peak in global PMIs and the risk of Donald Trump disappointing the markets is increasing.
- Monetary policy is set to stay accommodative in both the US and Europe.
- Changes to US economic policy are likely to come later and be smaller than previously expected.
- In our view, the risk of US military conflict with North Korea is rising.
Canadian Inflation Little Changed at 2% in February
- The year-over-year rate of headline CPI inflation edged down to 2.0% from 2.1% in January. The reading fell slightly short of market expectations for an unchanged 2.1% rate but inflation continues to track above the Bank's Q1/17 forecast of 1.8%.
- The rate of energy price inflation was little changed at 12% as the drop in energy prices in February (including gasoline -5%) was similar to the dip seen a year ago.
- Food prices were 2.3% lower than a year ago when exchange-rate-driven increases in some food prices were most intense. This continues the most significant period of food price deflation in more than two decades, though base effects should see the pace of decline softening going forward.
- Excluding food and energy, consumer prices were up 2.0% year-over-year after January's rate (2.2%) was the fastest since 2007.
- The Bank of Canada's three new core measures averaged 1.6% in February for a fourth consecutive month (after rounding). CPI-Common, remaining at its lowest level in two decades (1.3%), is somewhat out of sync with the other two measures which are closer to their longer-run averages.
Our Take:
After an upside surprise on inflation in January, today's report was a bit more ho-hum as the annual rates of headline inflation and major components (food, energy, and core) were all little changed in February. All items CPI is tracking above the Bank of Canada's latest forecast but that largely reflects transitory factors (namely energy prices) that the Bank said they were "looking through" in March's policy statement. Meanwhile, their new core measures, all of which remained below 2%, will likely continue to be cited as evidence of excess capacity in the economy. There has been some evidence of firming in other core measures - ex food and energy inflation is running at 2% and prices for services ex shelter, a gauge of domestic price pressure, have picked up in the last two months. That said, today's report fits with the Bank's narrative on slack in the economy, and given heightened uncertainty regarding US policy, we doubt their neutral tone will change much at April's meeting despite the solid run of data we've seen in recent months.
USD/JPY Mid-Day Outlook
Daily Pivots: (S1) 110.50; (P) 111.03; (R1) 111.45; More...
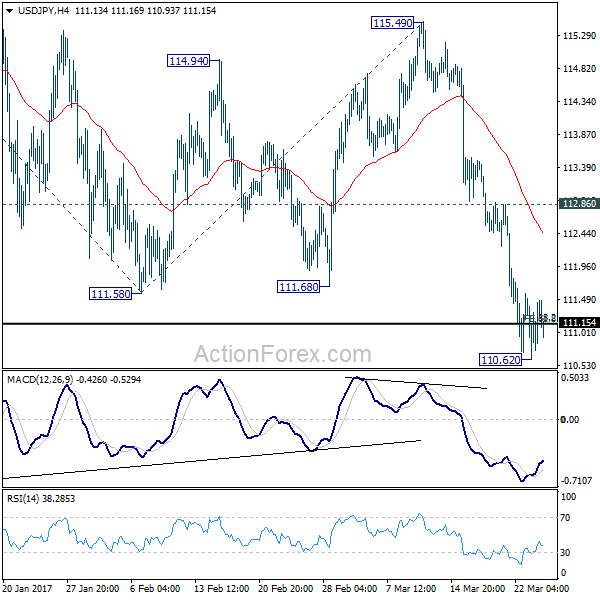
Intraday bias in USD/JPY stays neutral as it continues to struggle around 111.12/13 support. At this point, we're still favoring the case for strong support around 111.12/13 to bring rebound. This level represents 61.8% projection of 118.65 to 111.58 from 115.49 at 111.12 and 38.2% retracement of 98.97 to 118.65 at 111.13. Break of 112.86 resistance will indicates completion of the correction from 118.65. In such case, intraday bias will be turned back to the upside for 115.49 resistance and above. However, sustained trading below 111.12/13 will pave the way to 100% projection at 108.42 next.
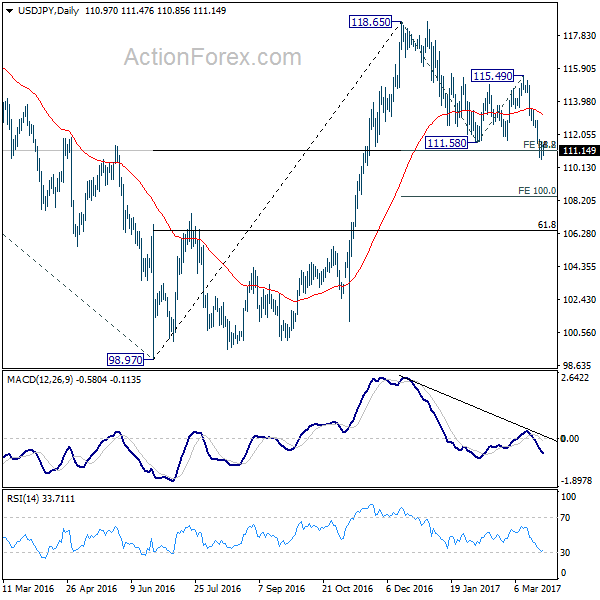
In the bigger picture, price actions from 125.85 high are seen as a corrective pattern. The impulsive structure of the rise from 98.97 suggests that the correction is completed and larger up trend is resuming. Decisive break of 125.85 will confirm and target 61.8% projection of 75.56 to 125.85 from 98.97 at 130.04 and then 135.20 long term resistance. Nonetheless, sustained trading below 55 week EMA (now at 111.12) will extend the consolidation from 125.85 with another fall through 98.97 before completion.
USD/CHF Mid-Day Outlook
Daily Pivots: (S1) 0.9915; (P) 0.9928; (R1) 0.9946; More.....
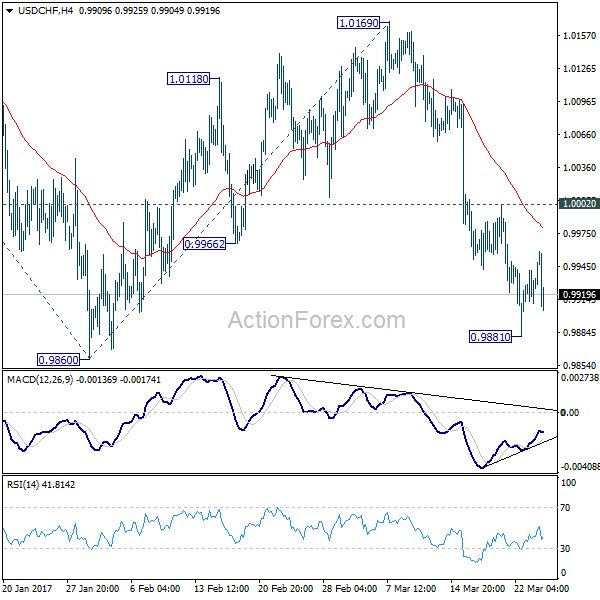
Intraday bias in USD/CHF remains neutral for consolidation above 0.9881 temporary low. Deeper decline is in favor as long as 1.0002 minor resistance holds. Break of 0.9860 near term support will extend the whole fall from 1.0342 towards 100% projection of 1.0342 to 0.9860 from 1.0169 at 0.9687. However, break of 1.0002 will argue that fall from 1.0169 is finished and will turn bias back to the upside for this resistance instead.
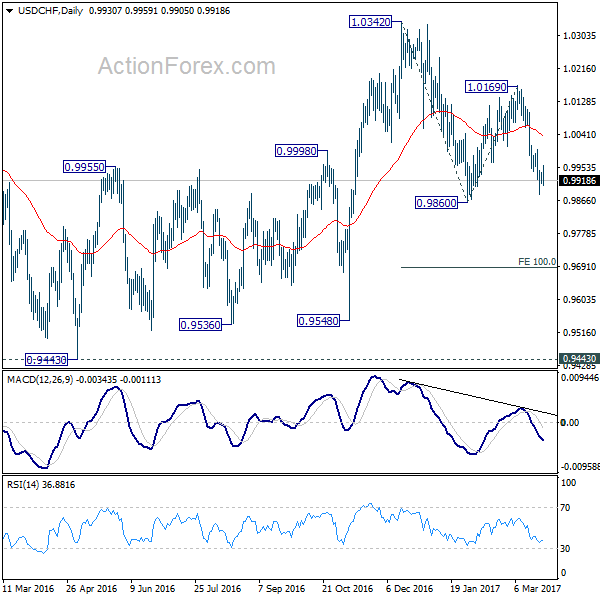
In the bigger picture, USD/CHF is staying in medium term sideway pattern between 0.9443/1.0342. In any case, decisive break of 1.0342 resistance is needed to confirm underlying strength. Otherwise, we'll stay neutral in the pair first. In case of another fall, we'd expect strong support from 0.9443/9548 support zone.
GBP/USD Mid-Day Outlook
Daily Pivots: (S1) 1.2478; (P) 1.2505; (R1) 1.2547; More...
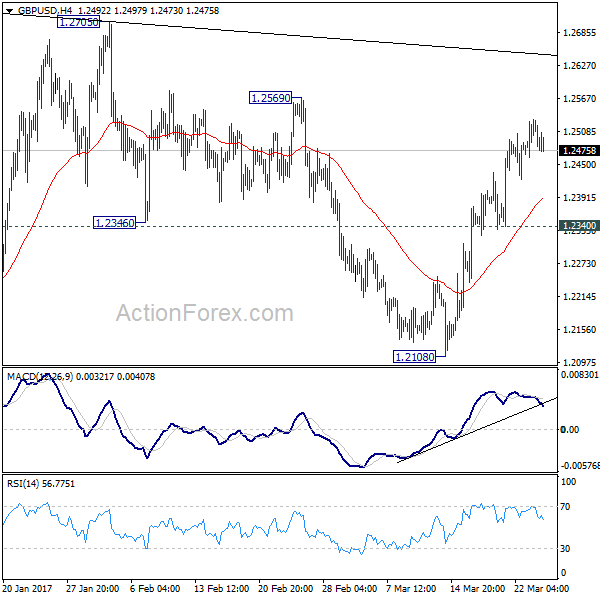
GBP/USD continues to lose upside momentum as seen in 4 hour MACD. But at this point, further rise is still expected with 1.2340 minor resistance holds. Above 1.2569 will target 1.2705/74 resistance zone. Price actions from 1.1946 are seen as a consolidation pattern. Hence, we'd expect strong resistance from 1.2705/2774 to limit upside and bring down trend resumption. On the downside, break of 1.2340 support will turn bias back to the downside for 1.2108 support. Though, sustained break of 1.2774 will extend the rise towards 1.3444 key resistance level.
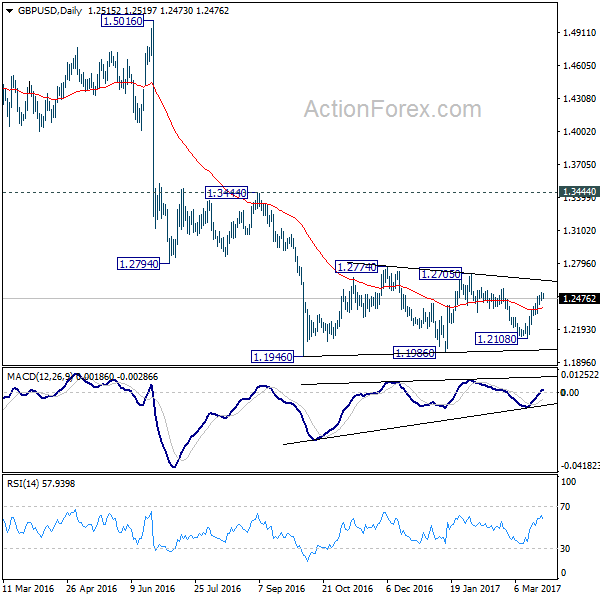
In the bigger picture, fall from 1.7190 is seen as part of the down trend from 2.1161. There is no sign of medium term bottoming yet. Sustained trading below 61.8% projection of 2.1161 to 1.3503 from 1.7190 at 1.2457 will target 100% projection at 0.9532. Overall, break of 1.3444 resistance is needed to confirm medium term bottoming. Otherwise, outlook will remain bearish.
Canada: Inflation Edges Down, Core Measures Still Soft
Canadian consumer prices rose 2.0 % (year-on-year) in February, decelerating from 2.1% in January. Prices were up 0.2% month-on-month (on par with consensus). On a seasonally adjusted basis, prices fell an estimated 0.2% month-on-month.
Once again energy was the main source of price pressures. Despite a 0.8% decline on a month-on-month basis, relative to a year ago, transportation costs were up 6.6% on the month, up from 6.3% in January.
Partially offsetting higher energy prices, food prices continue to decline. Food prices were down 2.3% year-on-year in February (from 2.1% previously), mainly due to falling prices for fresh vegetables, which were down 14%.
Core inflation measures remained benign: CPI-common and CPI-median were both unchanged at 1.3% and 1.9% respectively, while CPI-trim edged down to 1.6% (from 1.7% previously). All core measures are year-on-year.
Key Implications
Not much to report here in terms of inflation in Canada. Headline inflation looks likely to remain close to 2.0% over the next several months, and with energy prices relatively stable, is likely to decelerate modestly through the second half of this year.
Market expectations for rate hikes from the Bank of Canada have moved up in recent months, following rate hikes in the United States. However, with soft inflation and messaging from Bank of Canada officials that the Canadian economy remains in excess supply, investors may be over pricing the chance of a rate hike. Consistent with gradual absorption of economic slack, we do not expect the central bank to step off the sidelines until well into 2018.
EUR/USD Mid-Day Outlook
Daily Pivots: (S1) 1.0766; (P) 1.0785 (R1) 1.0804; More.....
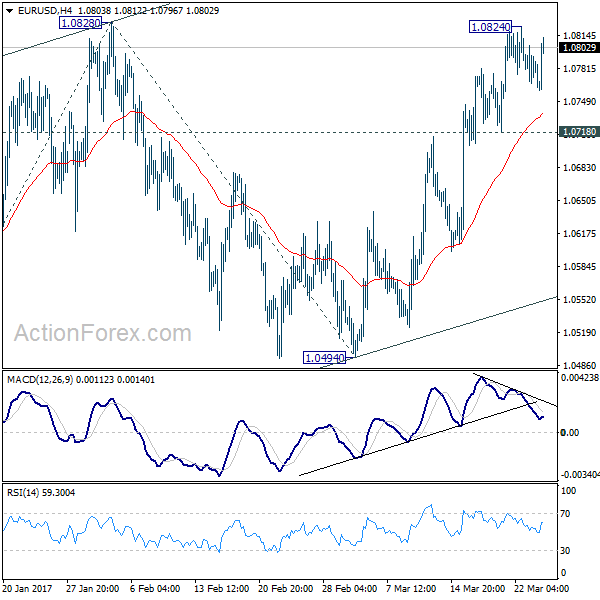
Intraday bias in EUR/USD remains neutral as consolidation from 1.0824 temporary top continues. Further rise remains in favor as long as 1.0718 minor support holds. Break of 1.0828 resistance will extend the rise from 1.0339 to 100% projection of 1.0339 to 1.0828 from 1.0494 at 1.0983. However, as rise from 1.0339 is seen as a corrective move. We'd expect upside to be limited by 1.0983 to complete the correction. On the downside, break of 1.0718 minor support will turn bias to the downside for 1.0494 support first.
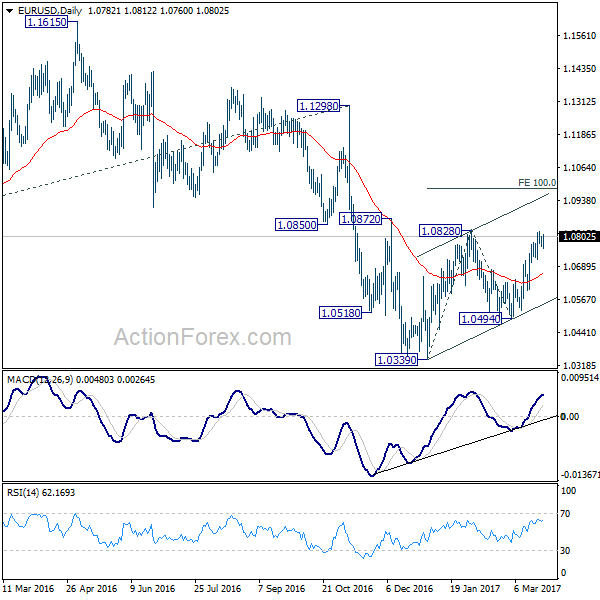
In the bigger picture, as long as 1.1298 key resistance holds, whole down trend from 1.6039 (2008 high) is still expected to resume later. Break of 1.0339 low will send EUR/USD through parity to 61.8% projection of 1.3993 to 1.0461 from 1.1298 at 0.9115.
Euro Lifted by PMIs, Dollar Recovered as Health Care Vote Awaited
Euro trades broadly higher today as lifted by solid PMI data. Meanwhile, the greenback also follows even though markets are facing uncertainty on health care vote in House. US president Donald Trump has issued his ultimatum to House Republicans that if the American Health Care Act is not passed today, he will move on to other priorities and leave Obamacare alone. The vote is seen as an important litmus test on Trump's ability to push through his initiatives. Released in US session, US durable goods orders jumped 1.7% in February versus expectation of 1.2%. But ex-transport orders rose 0.5% only. From Canada, headline CPI slowed to 2.0% yoy in February, below expectation of 2.1% yoy. CPI core common came in at 1.9% yoy, median at 1.9% yoy, trimmed at 1.6% yoy.
Eurozone PMI composite hit near six year high
Eurozone PMI manufacturing rose to 56.2 in March, up from 55.4 and beat expectation of 55.3. Eurozone PMI services rose to 56.5, up from 55.5 and beat expectation of 55.3. PMI composite rose to 56.7, hitting the highest level in six years since April 2011. Markit noted that "the acceleration in growth towards the end of the quarter, as well as improving trends in new business and an increased appetite to hire, suggest that strong growth momentum will be sustained into the second quarter."
Germany PMI manufacturing rose to 58.3, up from 56.8, beat expectation of 56.5. German PMI services rose to 55.6, up from 54.4 and beat expectation of 54.5. France PMI manufacturing rose to 53.4, up from 52.2 and beat expectation of 52.4. France PMI services rose to 58.5, up from 56.4, beat expectation of 56.1. Also from Europe, UK BBA mortgage approvals dropped to 42.6k in February.
ECB chief economist Peter Praet said that policy makers are "more confident on growth". However, "economic outlook is still conditional on maintaining a substantial degree of monetary accommodation. Talks about exit are premature." Praet also said that the forward guidance has served the central bank well. Meanwhile, he noted that "Brexit is regrettable and harmful, but it is also an opportunity for the banking union."
Japan manufacturing PMI missed expectations
Japan PMI manufacturing dropped to 52.6 in March, down from 53.3 and missed expectation of 53.5. Markit noted that "although signaling a slower rate of expansion during March, the latest PMI data again point to a Japanese manufacturing economy expanding at a decent clip." And, "new order books remain in solid growth territory, with gains seemingly supported by the weaker yen." Nonetheless, "this comes at the cost of ongoing marked rises in purchase costs: input price inflation remained close to a two-year high in March."
New Zealand trade deficit narrowed to NZD -18m in February but missed expectation of NZD 160m surplus. For the 12 months through February, trade deficit was at NZD 3.794b, the worst figure in nearly nine years.
EUR/USD Mid-Day Outlook
Daily Pivots: (S1) 1.0766; (P) 1.0785 (R1) 1.0804; More.....
Intraday bias in EUR/USD remains neutral as consolidation from 1.0824 temporary top continues. Further rise remains in favor as long as 1.0718 minor support holds. Break of 1.0828 resistance will extend the rise from 1.0339 to 100% projection of 1.0339 to 1.0828 from 1.0494 at 1.0983. However, as rise from 1.0339 is seen as a corrective move. We'd expect upside to be limited by 1.0983 to complete the correction. On the downside, break of 1.0718 minor support will turn bias to the downside for 1.0494 support first.
In the bigger picture, as long as 1.1298 key resistance holds, whole down trend from 1.6039 (2008 high) is still expected to resume later. Break of 1.0339 low will send EUR/USD through parity to 61.8% projection of 1.3993 to 1.0461 from 1.1298 at 0.9115.
Economic Indicators Update
| GMT | Ccy | Events | Actual | Forecast | Previous | Revised |
|---|---|---|---|---|---|---|
| 21:45 | NZD | Trade Balance (NZD) Feb | -18M | 160M | -285M | -257M |
| 21:45 | NZD | Exports (New Zealand dollars) Feb | 4.01b | 4.20b | 3.91b | |
| 00:30 | JPY | PMI Manufacturing Mar P | 52.6 | 53.5 | 53.3 | |
| 08:00 | EUR | France Manufacturing PMI Mar P | 53.4 | 52.4 | 52.2 | |
| 08:00 | EUR | France Services PMI Mar P | 58.5 | 56.1 | 56.4 | |
| 08:30 | EUR | Germany Manufacturing PMI Mar P | 58.3 | 56.5 | 56.8 | |
| 08:30 | EUR | Germany Services PMI Mar P | 55.6 | 54.5 | 54.4 | |
| 09:00 | EUR | Eurozone Manufacturing PMI Mar P | 56.2 | 55.3 | 55.4 | |
| 09:00 | EUR | Eurozone Services PMI Mar P | 56.5 | 55.3 | 55.5 | |
| 09:30 | GBP | BBA Mortgage Approvals Feb | 42.6K | 44.9K | 44.7K | 44.1K |
| 12:30 | CAD | CPI M/M Feb | 0.20% | 0.20% | 0.90% | |
| 12:30 | CAD | CPI Y/Y Feb | 2.00% | 2.10% | 2.10% | |
| 12:30 | CAD | CPI Core - Common Y/Y Feb | 1.90% | 1.30% | ||
| 12:30 | CAD | CPI Core - Median Y/Y Feb | 1.90% | 1.90% | ||
| 12:30 | CAD | CPI Core - Trim Y/Y Feb | 1.60% | 1.70% | ||
| 12:30 | USD | Durable Goods Orders Feb P | 1.70% | 1.20% | 2.00% | |
| 12:30 | USD | Durables Ex Transportation Feb P | 0.50% | 0.70% | 0.00% |