Sample Category Title
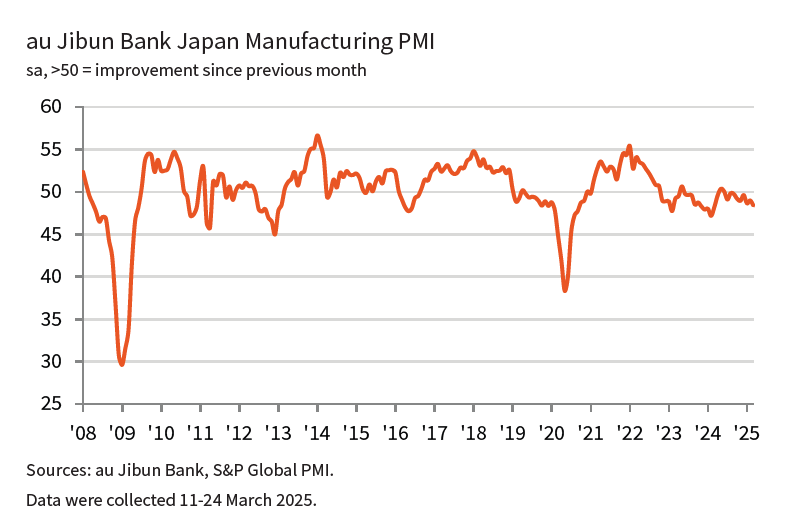
Japan PMI manufacturing finalized at 48.4, weaker domestic and international demand
Japan’s manufacturing sector contracted further in March, with final PMI reading falling to 48.4 from February’s 49.0, marking the lowest level in a year.
According to S&P Global, both output and new orders declined more sharply, reflecting "weaker demand from both domestic and international clients". Employment offered a rare bright spot, as firms increased hiring at the fastest rate in three months.
However, confidence remained muted and below the long-run average. Cost pressures also persisted, with strong increases in both input costs and selling prices, suggesting that "inflationary pressure across the sector remains acute".
Japan’s Tankan survey flags manufacturing caution, services hit 33-year high
Japan’s Q1 Tankan survey revealed a mixed outlook for the economy, with sentiment among large manufacturers slipping for the first time in a year. The index fell from 14 to 12, in line with expectations, as steel and machinery producers grew more cautious amid weak global demand, rising input costs, and uncertainty surrounding US tariff policy.
However, manufacturing outlook ticked down just slightly to 12, beating expectations of a sharper decline to 9, indicating that businesses remain cautiously optimistic.
In contrast, Japan’s services sector showed remarkable resilience. The large non-manufacturing index rose from 33 to 35—marking the highest level since 1991. Still, the outlook component was flat at 28, slightly missing forecasts of 29.
Capital expenditure plans were also encouraging, with large firms expecting a 3.1% increase for fiscal 2025, ahead of consensus of 2.9%.
Fed’s Barkin: Tariffs create dual risks for inflation and jobs
Richmond Fed President Thomas Barkin highlighted growing concerns over the economic impact of the Trump administration’s upcoming tariffs. He told CNBC that the tariffs could both stoke inflation and weigh on the labor market.
“Call me nervous on both,” Barkin said, signaling that the path forward for monetary policy remains highly data-dependent.
Barkin emphasized "there's a lot of uncertainty right now, and I think that makes the case for wait and see how this plays out."
Fed’s Williams: Tariff impacts on inflation could linger for years
New York Fed President John Williams cautioned that the inflationary effects of new US tariffs could be "more prolonged" than initially anticipated.
In an interview with Yahoo Finance, Williams emphasized that while the immediate price increases are expected, the true impact of tariffs “might not be fully felt for a couple of years."
He stressed the importance of monitoring not just the direct price changes, but also the “indirect effects” that ripple through the broader economy over time.
“It is still early days to be able to come to a concrete conclusion around this,” Williams said, noting that Fed will need to remain open-minded about "how long these last in terms of their effects on inflation and the economy.”
Gold Breaks Previous Highs—Is $3,200 The Next Target?
Key Highlights
- Gold started a fresh surge and traded to a new record high above $3,130.
- It broke a major contracting triangle with resistance at $3,025 on the 4-hour chart.
- Bitcoin is still struggling to start a fresh increase above the $85,000 resistance zone.
- EUR/USD is eyeing more gains above the 1.0850 resistance zone.
Gold Price Technical Analysis
Gold prices started a fresh rally above the $3,000 resistance. The bulls pumped the price above the $3,100 level and the price traded to a new record high.
The 4-hour chart of XAU/USD indicates that the price broke a major contracting triangle with resistance at $3,025 to restart its surge. There was a close above the $3,100 level, the 100 Simple Moving Average (red, 4 hours), and the 200 Simple Moving Average (green, 4 hours).
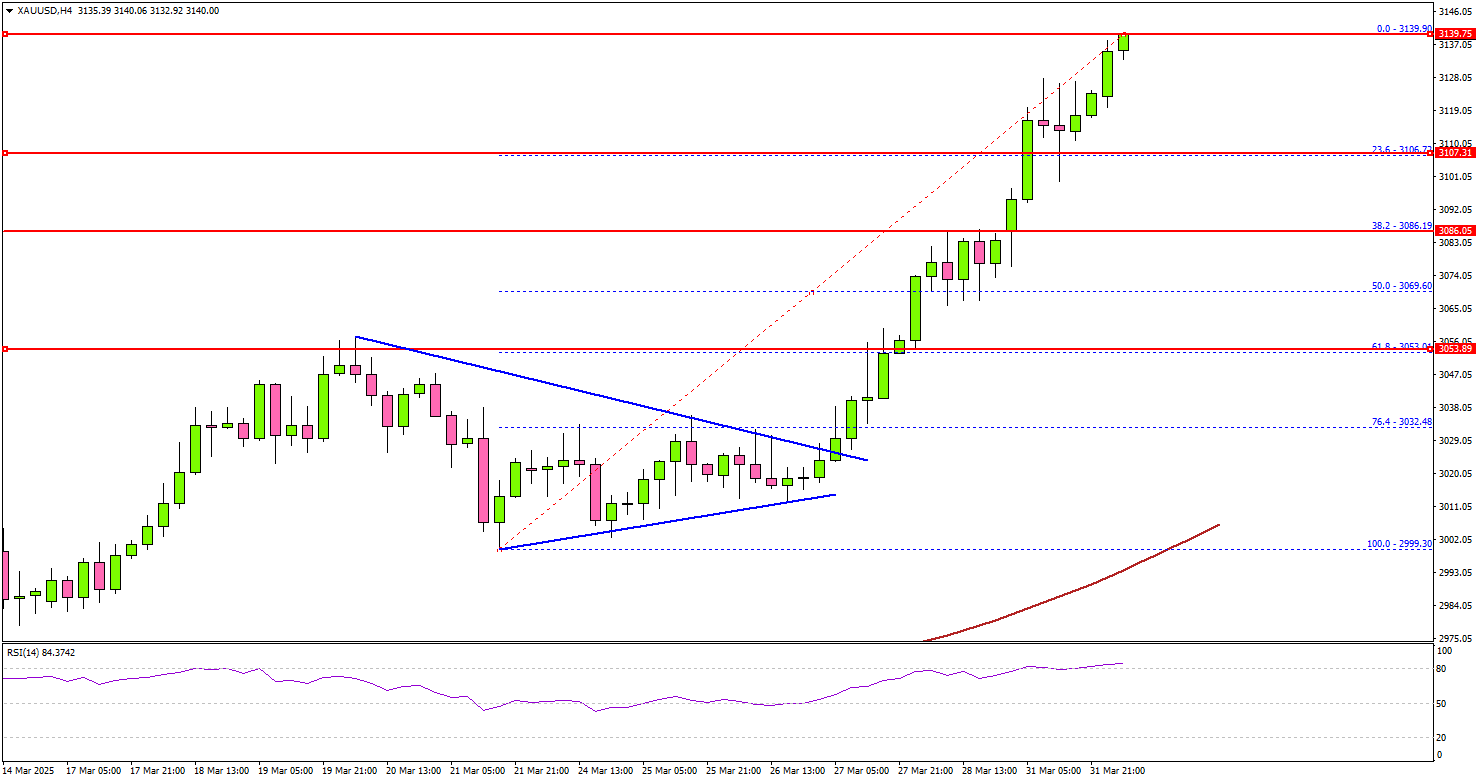
The bulls even pumped the price above the $3,135 level. The current price action suggests a high chance of more gains above the $3,125 level. On the upside, immediate resistance is near the $3,142 level. The next major resistance sits near the $3,150 level.
A clear move above the $3,150 resistance could open the doors for more upsides. The next major resistance could be $3,080, above which the price could rally toward the milestone level of $3,200.
On the downside, initial support is near the $3,100 level. The first key support is near $3,075. The next major support is near the $3,060 level.
The main support is now $3,045. A downside break below the $3,045 support might call for more downsides. The next major support is near the $3,020 level.
Looking at Bitcoin, the price failed to gain bullish momentum above $85,000 and is now at risk of more losses below $80,000.
Economic Releases to Watch Today
- Euro Zone Manufacturing PMI March 2025 – Forecast 48.7, versus 48.7 previous.
- US Manufacturing PMI for March 2025 – Forecast 49.8, versus 49.8 previous.
- US ISM Manufacturing Index for March 2025 – Forecast 49.5, versus 50.3 previous.
Gold (XAU/USD) Price Analysis: Gold Surges But Have “Liberation Day” Tariffs Been Priced in?
- XAU/USD surges as markets anticipate widespread tariffs, fueling recession fears.
- "Buy the rumor, sell the fact?" potential: Concern exists that gold's rally may see a selloff if tariff announcements differ from expectations.
- The upcoming tariff announcements and economic data suggest a week of significant price swings for gold.
Gold prices advanced to fresh highs following a gap up over the weekend. Markets are bracing for tariffs which President Trump has now said would essentially cover all countries, stoking worries a global trade war could lead to a recession.
Trump's remarks on Air Force One suggested the tariffs might not be limited to just a few countries with major trade imbalances.
He’s set to receive tariff recommendations on Tuesday, announce initial rates on Wednesday, and follow up with auto tariffs on Thursday.
Is Gold facing a case of buy the ‘rumor sell the fact’?
Golds excellent 2025 continues but the stark rise above the $3000/oz handle raises the question, how far can the rally go?
I do have a concern heading into tomorrow's “liberation day” tariffs that this could be a case of buy the rumor, sell the fact. Markets appear convinced that the tariffs to be announced over the coming days are going to be widespread and received negatively.
However if the Trump administration has proven one thing it is that consistency is not its forte. As President Trump says one thing and delivers something completely different or walks back his initial proposal, in part at least.
Any such move this time around could lead to a selloff in the precious metal. Whether this move will be sustainable though is highly doubtful.
Recessionary fears are on the rise
Many economists fear tariffs could hurt the U.S. economy while also limiting the Federal Reserve's ability to lower interest rates due to short-term inflation.
Goldman Sachs now estimates a 35% chance of a U.S. recession (up from 20%), expecting Trump to announce 15% reciprocal tariffs on all trading partners on April 2.
Friday's data highlighted the risks: core inflation rose more than expected in February, while consumer spending fell short of expectations.
These developments continue to lend a supporting hand to safe haven demand and thus gold prices.
Final thoughts
Given the scenarios presented above, the week ahead looks to be a volatile one with a lot of whipsaw price action ahead.
Overall, recent developments mean that the bulls remain in charge. What we have seen of late is that when it comes to Gold, overall market sentiment seems to be the biggest driving force.
Technical Analysis - Gold (XAU/USD)
From a technical analysis standpoint, Gold prices have created fresh highs today and found resistance around the 3125 handle.
Looking at the H2 chart below we can see immediate support may be found at 3100 before the Friday close around the 3083 handle comes into focus.
On the upside, a recovery from here needs to make it to beyond the 3125 handle if bulls are to charge once more.
Such a move has the potential to develop in the Asian session as Gold continues to be a stellar performer.
Gold (XAU/USD) Two-Hour Chart, March 31, 2025
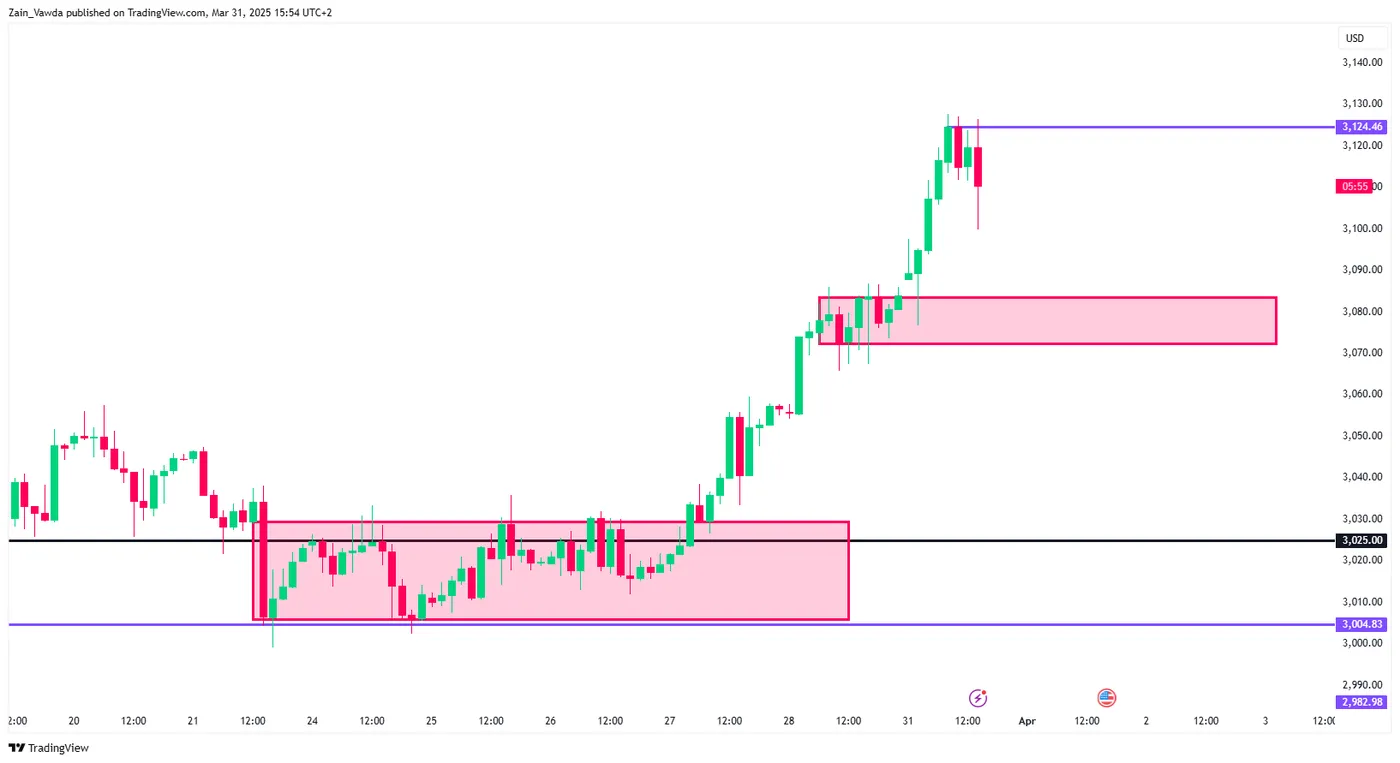
Source: TradingView
Support
- 3100
- 3083
- 3071
Resistance
- 3125
- 3150
- 3175
Riding the Trend: USDCNH Shows Dollar Strength Set to Persist
In recent years, the remembi paused its attempt to strengthen against the USD. In February 2014, the renminbi found support at 6.0153 as wave ((III)). From there, it formed a perfect zig-zag corrective structure, reaching equal legs at the 7.1964 high in September 2019. Following these three swings, USDCNH was expected to continue its downtrend. However, the pair turned upward again, breaking above the 7.1964 high, which suggested that it was developing a double correction structure. (If you want to learn more about Elliott Wave Theory, please follow these links: Elliott Wave Education and Elliott Wave Theory)
USDCNH October 2024 Weekly Chart
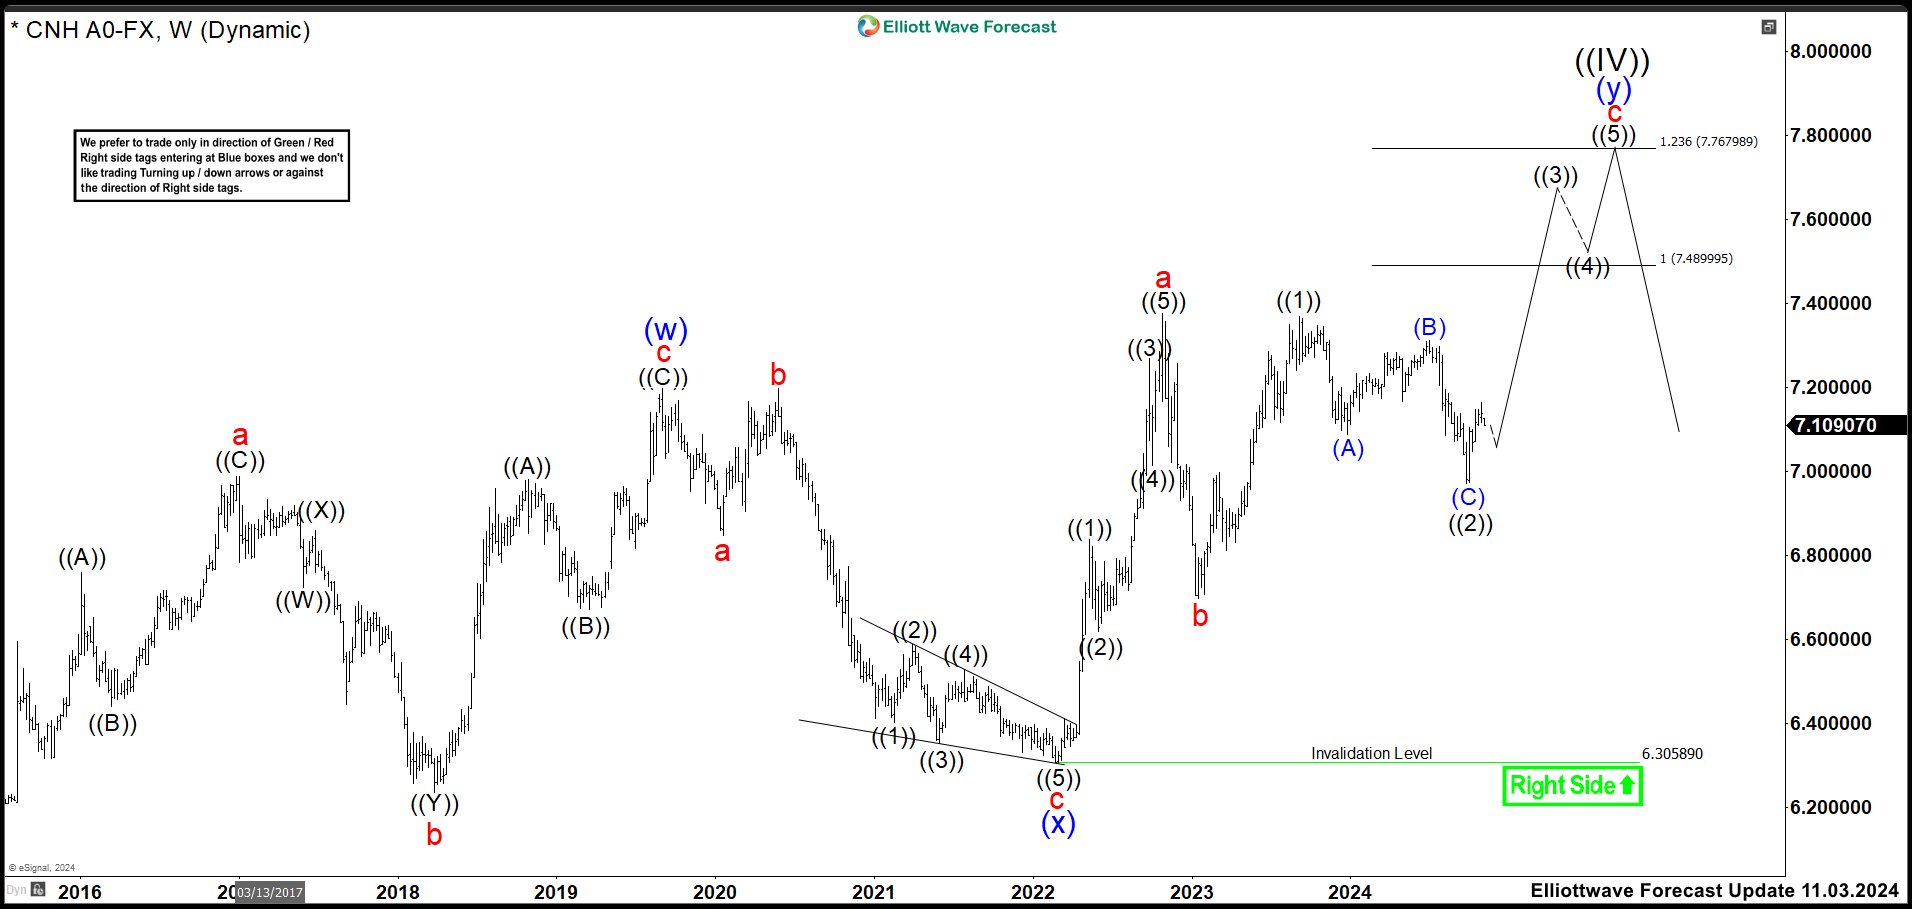
In the previous chart, the first leg of wave “c” completed successfully. Starting from the 6.6883 wave “b” low, the pair climbed higher in 5 swings, forming an impulse that peaked at the 7.3679 high, labeled as wave ((1)). The wave ((2)) pullback then unfolded, following a zig-zag structure (A), (B), and (C), and ended precisely at the 6.9705 low within the expected range of 7.12 – 6.95.
After completing wave ((2)), the pair resumed its rally, building an impulse as wave “c” toward the target area of 7.4899 – 7.7679 This move aimed to finalize wave (y) and complete the double correction as wave ((IV)), allowing the renminbi to continue its downtrend in monthly timeframe.
USDCNH March 2025 Weekly Chart
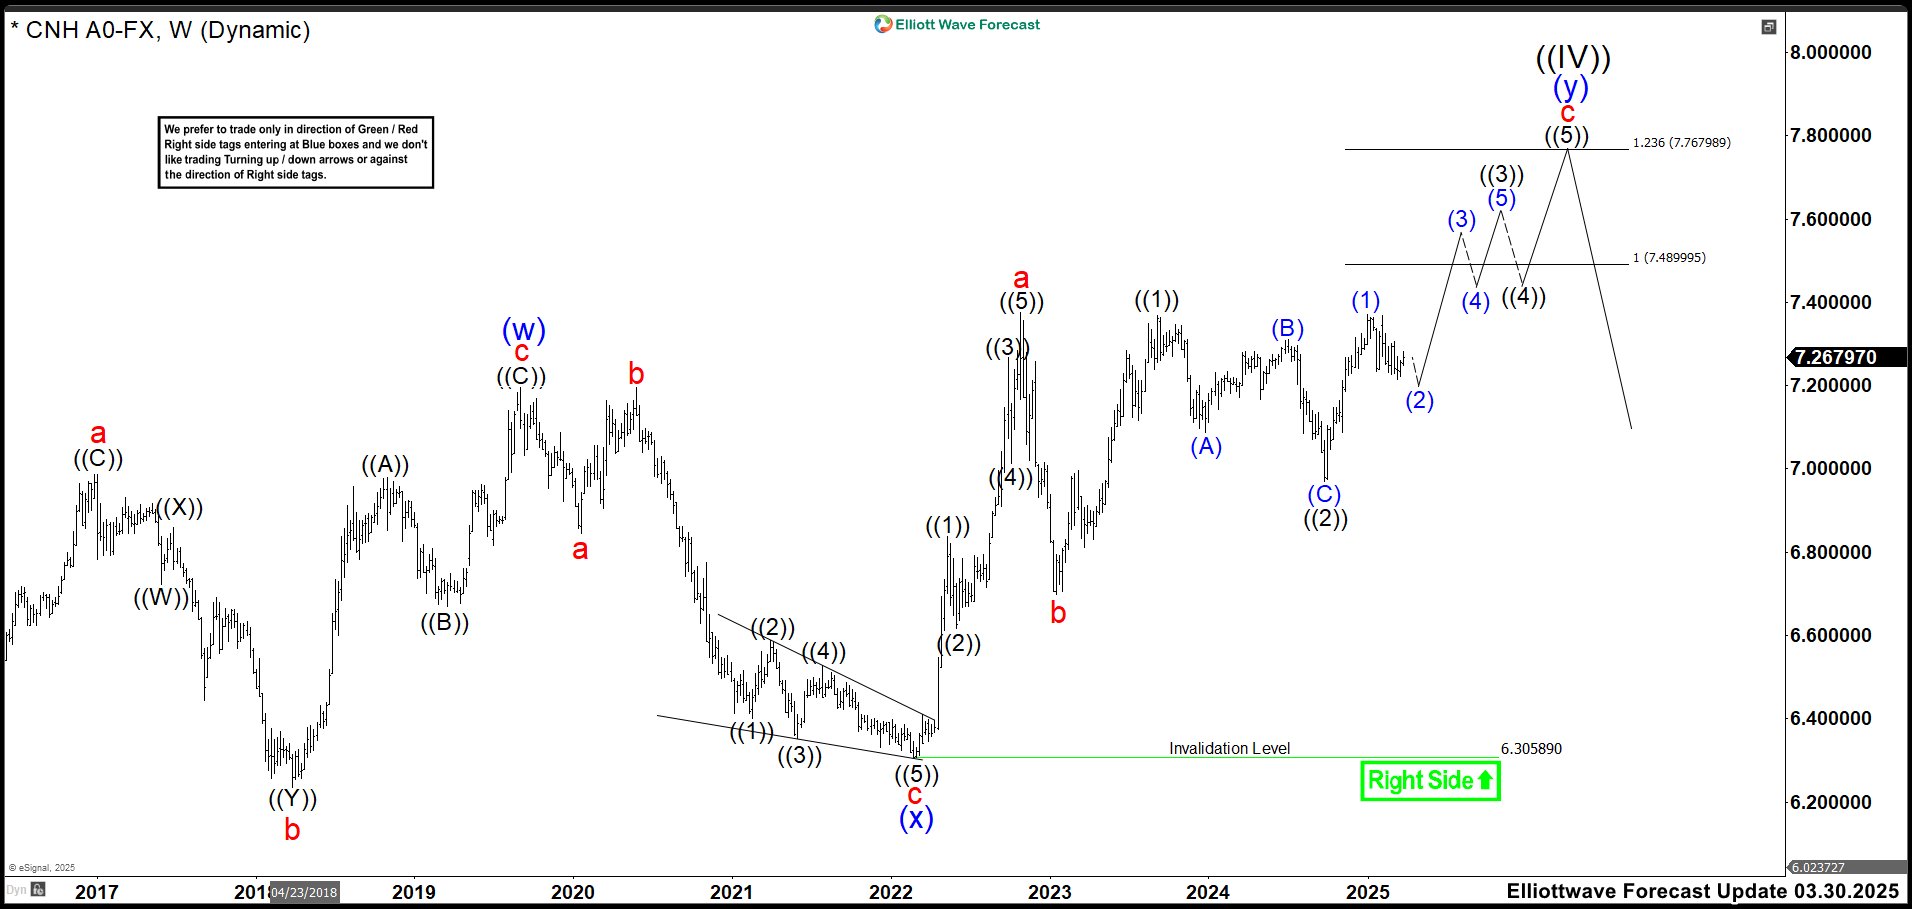
Currently, we can see the rally of wave (1) of ((3)) that concluded at the 7.3700 high. This movement has not broken into new highs which is crucial for sustaining bullish momentum. We have also witnessed a pullback that is likely wave (2) of ((3)). Despite the sharp depreciation of the dollar in recent weeks, the pair has not moved to the same magnitude as the dollar, which is a positive indicator for maintaining the bullish structure. As in previous months, we expect the upward trend to continue targeting to 7.4899 – 7.7679 area completing a double correction Elliott Wave pattern. At this level, we should see a bearish reactions in the USDCNH.
EURAUD Wave Analysis
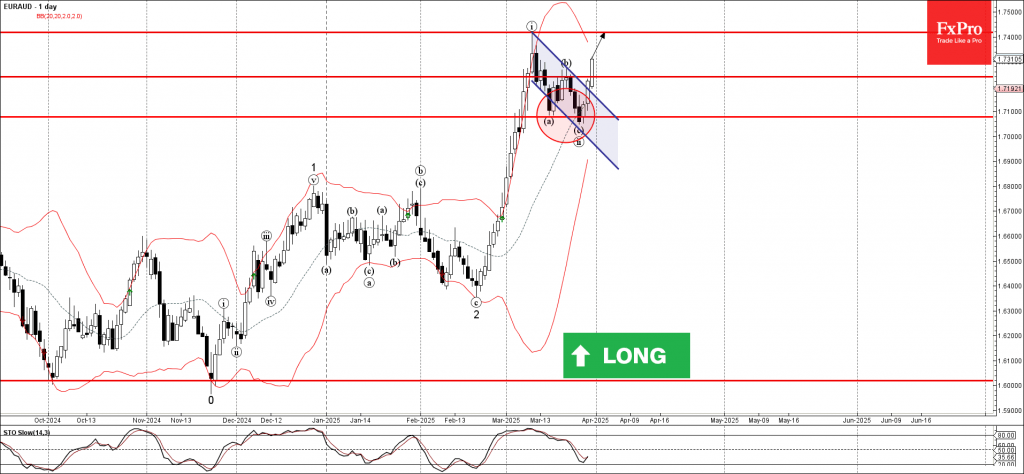
EURAUD: ⬆️ Buy
- EURAUD rising inside impulse wave iii
- Likely to reach resistance level 1.7400
EURAUD currency pair recently reversed from the support zone between the support level 1.7080 (low of the previous wave a), 20-day moving average and the support trendline of the daily down channel from the start of March.
The price earlier broke the resistance trendline of the aforementioned down channel – which accelerated the active impulse wave iii.
Given the clear daily uptrend and the bullish euro sentiment, EURAUD currency pair can be expected to rise to the next resistance level 1.7400 (which stopped the previous impulse wave i).
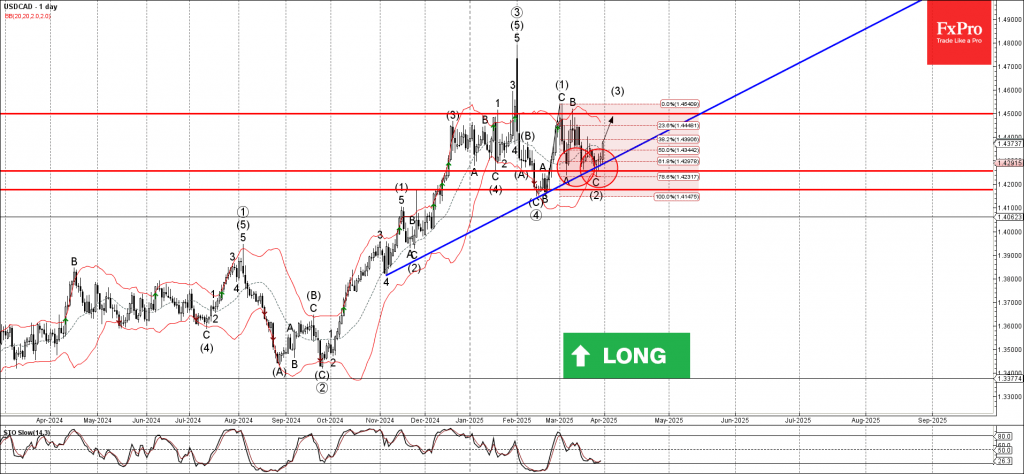
USDCAD Wave Analysis
USDCAD: ⬆️ Buy
- USDCAD reversed from the support zone
- Likely to rise to resistance level 1.4500
USDCAD currency pair recently reversed from the support zone located between the support level 1.4255 (which has been reversing the pair from the start of March), lower daily Bollinger Band and the support trendline from November.
The upward reversal from this support zone started the active intermediate impulse wave (3).
Given the strong daily uptrend and the bullish US dollar sentiment, USDCAD currency pair can be expected to rise to the next resistance level 1.4500 (which has been reversing the price from January).