
Sample Category Title
AI Exuberance Rotates Into Small Caps Amid Sticky Inflation and Looming Central Bank Tightening
Key takeaways
- Global equities pushed to fresh record highs as investor enthusiasm broadened beyond mega-cap technology stocks into small-cap industrial, energy, and infrastructure companies benefiting from the ongoing AI investment boom.
- Strong labour market data and rising inflation pressures in both the U.S. and Eurozone reinforced expectations of a more hawkish global monetary policy environment, with markets increasingly pricing additional tightening from the ECB and Federal Reserve.
- Capital intensity within the AI supercycle is becoming a key market theme, highlighted by Alphabet’s US$80 billion equity raise to finance expanding AI infrastructure spending, raising questions about long-term capital efficiency and balance-sheet sustainability.
- Chart of the day: Nasdaq 100 minor bullish trend remains intact above 30,245 key short-term support.
Top macro headlines
- World Stocks hit historic peaks amid calm geopolitics: Major global equity indexes, including the S&P 500, MSCI All Country, MSCI Emerging Markets, and MSCI Asia ex-Japan, advanced to brand-new record highs on Tuesday. The broad rally was underpinned by a general calm across fixed-income and currency desks, alongside a lack of major shifts in U.S.-Iran border tensions.
- Alphabet stuns markets with unprecedented $80 billion equity capital raise: Google’s parent entity, Alphabet, shocked Wall Street by announcing an $80 billion equity financing program to back its staggering AI capital expenditures, which are projected to reach $200 billion this year. Legendary holding firm Berkshire Hathaway has already committed a major $10 billion block to the capital raise.
- U.S. JOLTS job openings surge to two-year peak: Economic indicators released on Tuesday revealed that U.S. job openings for April jumped to their highest absolute level in two years, led by a massive concentration in professional and business services. This rapid pace represents the quickest sequential expansion in five years, signalling robust labour demand.
- Eurozone inflation scales 3% handle in May, securing ECB June hike: Driven by structural forces, Eurozone headline consumer price inflation crossed the 3% y/y barrier for the first time since September 2023. Core inflation also rose higher to 2.5% y/y from 2.2% in April. These hot prints have effectively locked in a 25-basis-point interest rate hike at next week’s ECB policy meeting, with traders pricing an additional 50 bps of tightening by year-end.
Key macro themes
- The small-cap rotational AI capital drift: While multi-trillion dollar megacap behemoths capture mainstream headlines, an underlying structural rotation is developing. Tech and energy small caps are outperforming as critical components of the physical "picks and shovels” layer of the global AI buildout, allowing them to monetise large capex budgets away from over-concentrated tech heavyweights.
- Megacap liquidity demands & balance sheet fatigue: Alphabet’s massive $80 billion capital raise highlights growing cash demands among AI players. Despite boasting $126 billion in cash at the end of Q1, Alphabet’s massive capex burn rate, paired with $85 billion in fresh debt issuance over the past year, is prompting concerns over long-term capital efficiency.
- Sovereign monetary policy conundrums: Central banks globally are entering a synchronised tightening regime to squash persistent price pressures. With Eurozone inflation hot, the ECB is set to follow the G10 rate-hiking cohorts of Australia and Norway. Markets are subsequently pricing in a faster policy-tightening timeline from the Fed under the new leadership of Kevin Warsh.
Global market impact (last 24 hours)
Equities: The S&P 500 closed higher at fresh peaks with seven out of 11 sectors advancing, led by Utilities (+1.9%), Materials (+1.2%), and Industrials (+1%). Small-caps and non-tech cyclicals dramatically outperformed, while European bourses rallied 0.8% and the UK FTSE added 0.3%.
Fixed Income: Global sovereign bonds enjoyed a rare relief bid. The long end of the U.S. Treasury curve rallied, dropping yields by 3 basis points. Japan’s 10-year JGB yield plunged a massive 11 basis points following a highly successful auction, registering its steepest single-day drop since April 2023.
FX: The U.S. Dollar Index continued to trade within a minor range between 99.50 and 98.90, while the USD/JPY inched higher towards the critical 160.00 intervention threshold, keeping Japanese authorities on high alert. Conversely, digital safe havens buckled, with Bitcoin sliding 6% to break toward $66,000, printing an intraday low of $65,370 in today’s Asia opening session.
Commodities: Energy markets firmed modestly, with crude oil contracts adding 1% amid uncertainty over an interim US-Iran peace deal. Precious metals stabilised, with spot gold holding steady near $4,484/oz as investors balanced sticky global yields with Middle East headlines, but remained capped below its 20-day moving average at $4,580.
Asia Pacific impact
- Stock indices surge to records: Mirroring global risk-on transitions, regional bourses posted strong sessions. The MSCI Asia ex-Japan index climbed to an all-time record, building on Monday’s massive 4.0% single-session explosion in South Korea. In today’s Asia opening session, rotation has been seen among Hong Kong shares and China’s “A” shares. The Hang Seng Index slid -1.7% intraday, while China A 50 and the broader CSI 300 index rose around 1.5% each. The outperformance of China “A” shares has been driven by an expansion in service activities, as the RatingDog Services PMI rose to 54.4 in May from 52.6 in the prior month.
- Japanese bond volatility: The 11 bps collapse in the 10-year JGB yield has significantly adjusted near-term domestic yields. However, markets remain tightly focused on the Bank of Japan's upcoming policy meeting next week, where the central bank is widely expected to signal a clear path for interest rate normalisation and tapering.
- Chinese energy inventories: Highlighting real-world supply shifts, data show that China is aggressively drawing down its domestic onshore crude stockpiles to replace regular oil imports, which have plunged to a 10-year absolute low due to high international costs.
Top 3 events to watch today
- BoJ Governor Ueda Speech - 4.30 pm SGT Impact: USD/JPY, JPY crosses, short-term JGBs, Nikkei 225
- US ADP Employment Change (May) - 8:15 pm SGT (consensus: +117K, Apr: +109K) Impact: USD, short-term US Treasuries, US stock indices, Gold
- US ISM Services PMI (May) - 10:00 pm SGT (consensus: 53.8, Apr: 53.6) Impact: USD, short-term US Treasuries, US stock indices, Gold
Chart of the day - Nasdaq 100 remains entrenched in an ascending channel
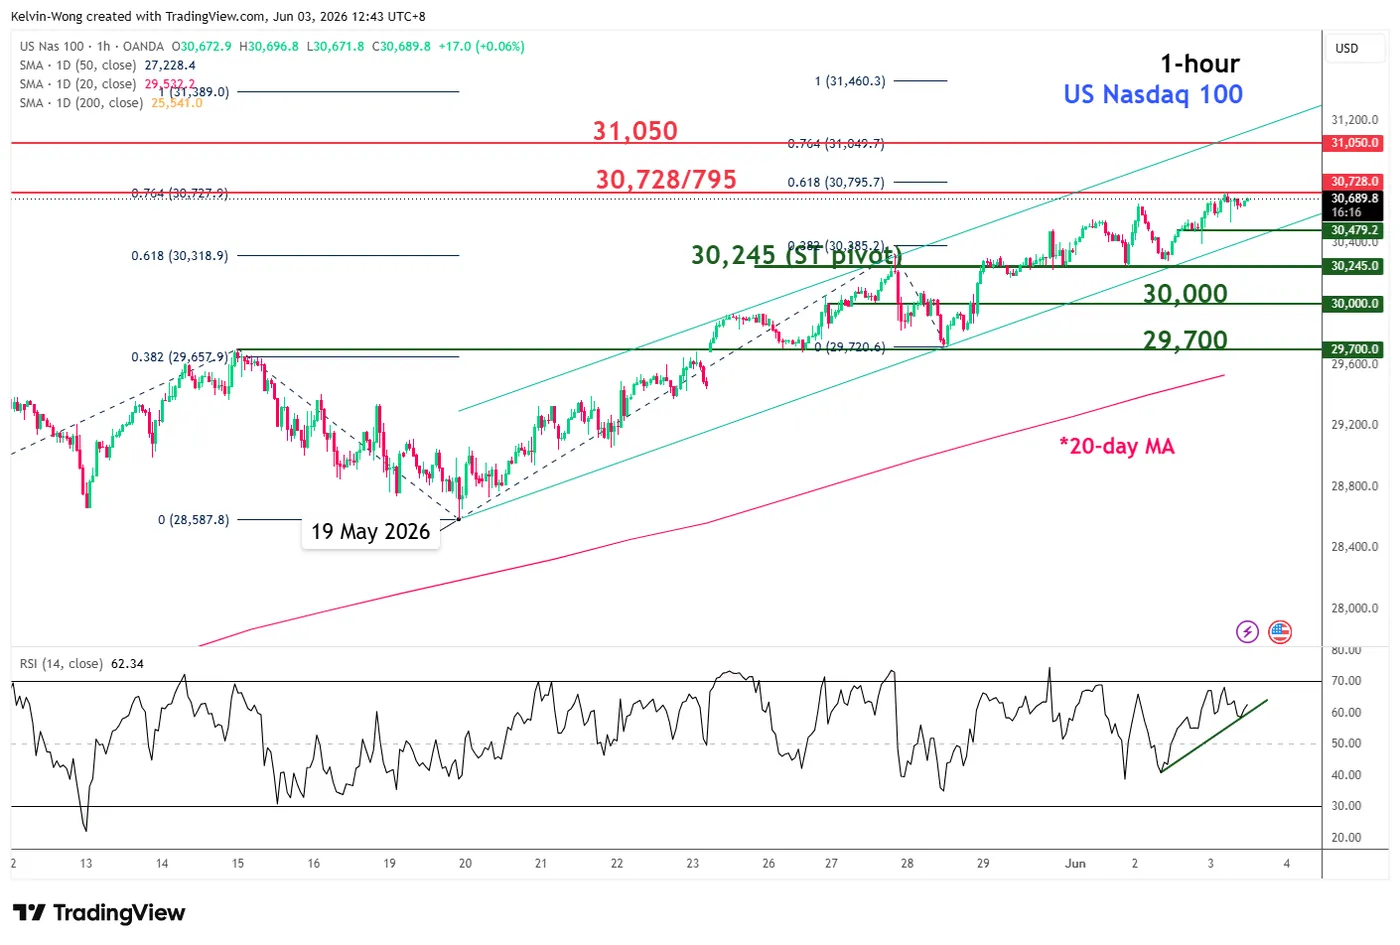
Fig. 1: US Nasdaq 100 CFD minor trend as of 3 Jun 2026 (Source: Trading View). The information presented is historical information, and past performance is not indicative of future performance.
The price action of the US Nasdaq 100 CFD (a proxy for the Nasdaq 100 E-mini futures) has continued to oscillate within a minor ascending channel in place since the 19 May 2026 low at 28,588.
In addition, the hourly RSI momentum indicator remains in a healthy bullish momentum condition (above the 60 level).
These observations suggest its minor uptrend phase remains intact. Watch the 30,245 key short-term pivotal support for a further potential push up. A clearance above 30,795 points to the next intermediate resistance at 31,050 (Fibonacci extension).
However, failure to hold and an hourly close below 30,245 would negate the bullish tone, signalling a minor corrective decline towards the next intermediate supports at 30,000 and even 29,700 (close to the 20-day moving average).
Bitcoin’s Next Stop Could Be $60k. The Bigger Risk May Be $40k.
Bitcoin is flashing increasingly bearish signals at a time when many traditional risk assets continue to look remarkably resilient. The cryptocurrency plunged below $70,000 this week, accelerating a decline that has already erased much of the recovery from February's lows. The divergence with equity markets is becoming difficult to ignore. While investors continue pushing technology shares and AI-related stocks toward record highs, Bitcoin is behaving as though the macro environment is becoming steadily more hostile.
Part of the explanation lies in energy markets. The renewed uncertainty surrounding US-Iran negotiations has kept oil prices elevated even without a full-scale escalation in hostilities. Investors are worried that prolonged disruption around the Strait of Hormuz could sustain inflation pressures through higher transportation and energy costs. That in turn raises the prospect of interest rates staying higher for longer. While stock markets remain focused on earnings and AI investment themes, Bitcoin appears to be reacting more directly to concerns about liquidity and monetary conditions.
Institutional flows have amplified the weakness. More than $4.2 billion has exited digital asset investment products over the last three weeks, reversing one of the key sources of support that fueled Bitcoin's earlier rally. Spot ETF redemptions require fund managers to sell physical Bitcoin into the market, creating a persistent stream of supply. With fewer institutional buyers stepping in, normal market volatility has become harder to absorb.
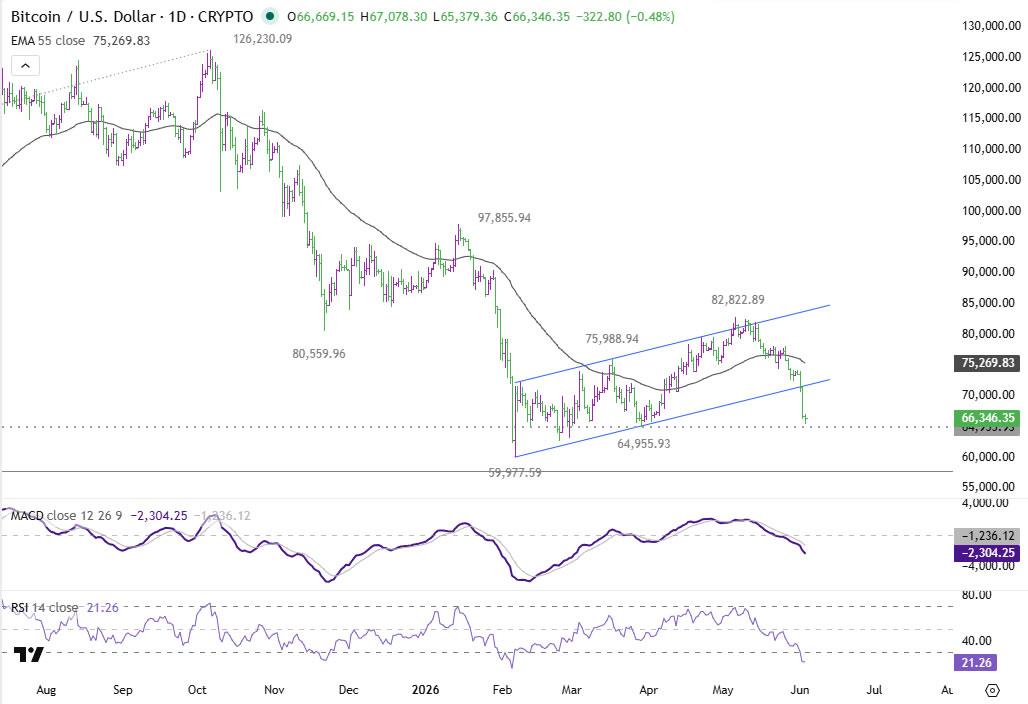
The technical damage is also becoming harder to dismiss. Bitcoin has broken decisively below a rising daily channel, indicating that the rebound from 59,977 likely ended with three waves up to 82,822. As long as prices remain below 55 D EMA (now at 75,260), the path of least resistance points lower. Support around 64,955 may slow the decline initially, but a decisive break would open the door to a retest of the 59,977 low.
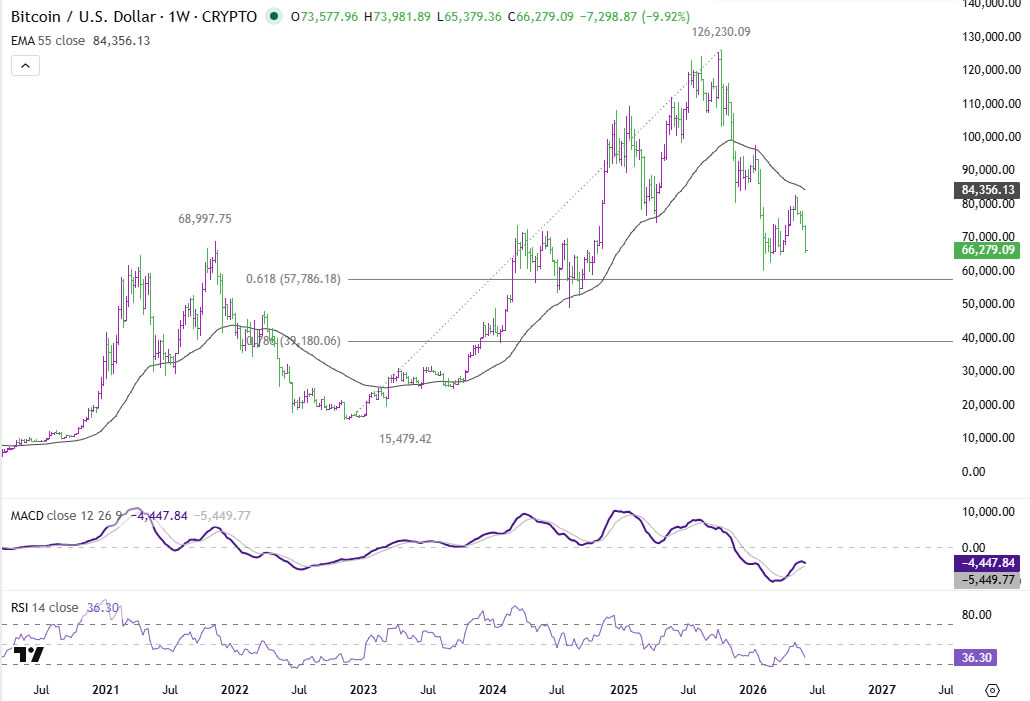
In the bigger picture, the downtrend from 126,230 is not yet complete. Rejection by 55 W EMA (now at 84,352) reinforced the bearish medium-term outlook. As the down trend extends, Bitcoin will likely dive through 61.8% retracement of 15,479 (2022 low) to 12,6230 (2025 high) at 57,786 to 78.6% retracement at 39,180.
For now, a move toward $60,000 appears to be the most immediate risk. But if macro pressures persist, ETF outflows continue, and technical support levels fail, the conversation could shift rapidly toward the possibility of a much deeper decline. In that scenario, the $40,000 area may become a far more relevant target than many investors currently expect.
Australia Q1 GDP Grows 0.3% qoq, Misses Forecasts as Exports and Mining Drag Growth
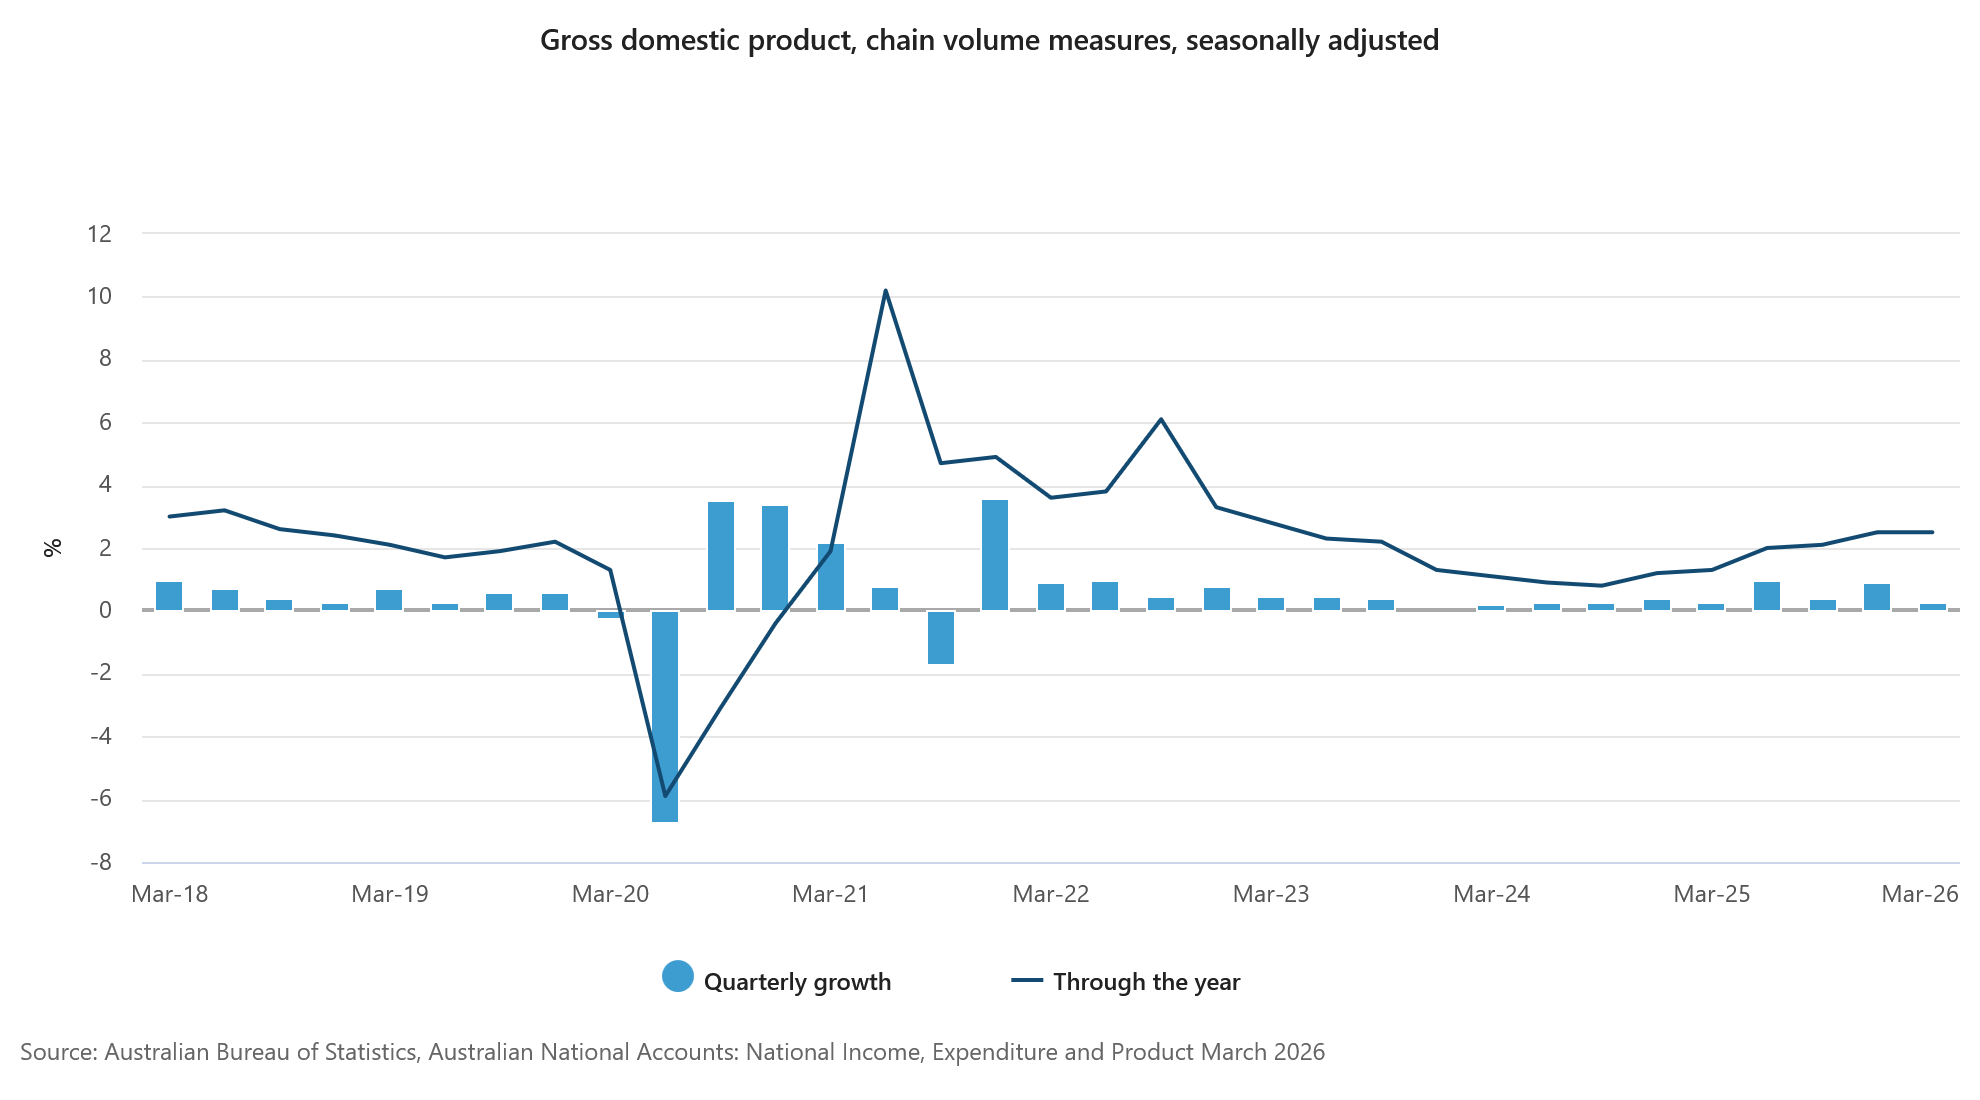
Australia's economy grew by just 0.3% qoq in the first quarter, missing expectations of 0.5% qoq and signaling a loss of momentum at the start of 2026. Annual growth held at 2.5%. According to the Australian Bureau of Statistics, weaker household spending, softer public expenditure and weather-related disruptions all contributed to the slowdown.
ABS Head of National Accounts Grace Kim said, "Economic growth slowed in the March quarter, with modest household and public sector expenditure as well as cyclone disruptions to mining and export activities."
A key drag came from the external sector. Exports fell -1.1%, the largest quarterly decline in two years, led by a -6.8% drop in coal exports and a -1.3% decline in mineral ores. Mining production fell -1.5%, while transport, postal and warehousing activity declined -1.3% as severe weather disrupted export-dependent industries. Combined with a 2.1% rise in imports, net trade subtracted a substantial -0.8 percentage points from GDP growth.
The brighter spot was business investment. Private investment rose 6.0%, driven by a remarkable 16.3% surge in machinery and equipment spending. Kim noted that investment in data centres across New South Wales and Victoria helped generate the largest increase in machinery and equipment investment in 30 years. However, much of the equipment was imported, limiting the positive impact on GDP.
| Indicator | Q4 2025 | Q1 2026 | Expectation |
|---|---|---|---|
| GDP Q/Q | 0.2% | 0.3% | 0.5% |
| GDP Y/Y | 2.6% | 2.5% | 2.7% |
| Component | Q1 2026 | Contribution / Comment |
|---|---|---|
| Household Spending | +0.5% | Supported by higher utility spending |
| Government Consumption | -0.2% | Weakest growth since Q3 2022 |
| Private Business Investment | +6.0% | Strongest area of the economy |
| Machinery & Equipment Investment | +16.3% | Largest increase in 30 years |
| Mining Production | -1.5% | Hit by cyclone disruptions |
| Transport, Postal & Warehousing | -1.3% | Impacted by weaker export activity |
Japan’s PMI Services Stagnates While Cost Pressures Surge
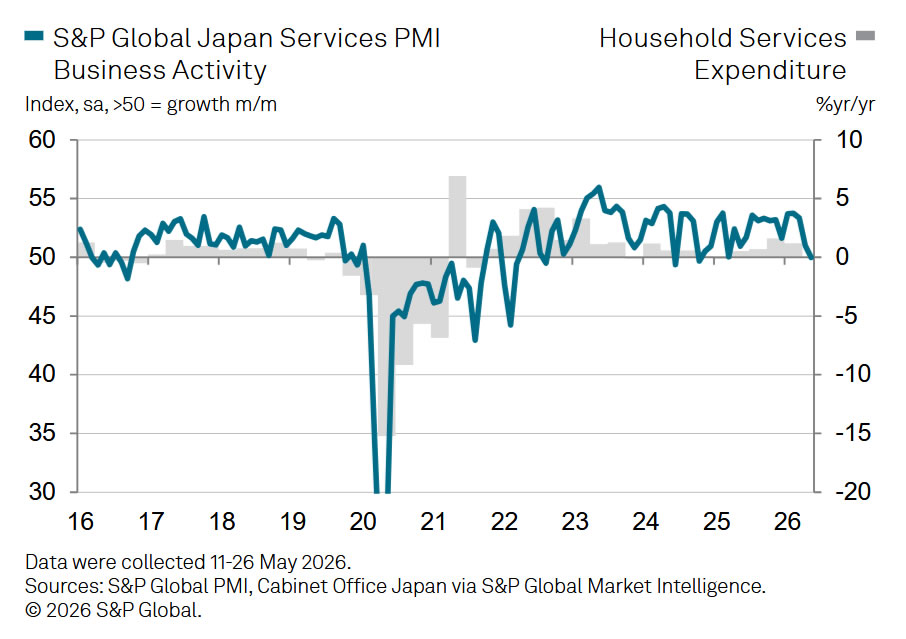
Japan's service sector lost momentum sharply in May as rising costs linked to the Middle East conflict weighed on business activity and household spending. PMI Services (final) fell from 51.0 to 50.0, indicating stagnation after more than a year of continuous expansion. PMI Composite eased from 52.2 to 51.1. The figures suggest the strong growth seen in the first quarter, which was confirmed by recent GDP data, is beginning to fade as the economy enters the second quarter.
According to S&P Global's Annabel Fiddes, the ongoing war in the Middle East is exerting increasing pressure on Japanese businesses through higher energy costs, supplier price hikes, labor expenses, and supply chain disruptions. She noted that price indicators pointed to a record increase in selling prices for goods and services alongside a near-unprecedented rise in business costs. Those higher prices are increasingly affecting demand, particularly in the services sector, as households face growing pressure on their budgets.
The survey suggests that overall private-sector growth is now being sustained primarily by manufacturing, where firms continue to build inventories as a precaution against future shortages and higher prices. However, Fiddes cautioned that this support may prove temporary once stockpiling activity fades. Looking ahead, she warned that much will depend on developments in the Middle East and their impact on global supply chains and inflation.
| Indicator | April | May |
|---|---|---|
| PMI Services Final | 51.0 | 50.0 |
| PMI Composite Final | 52.2 | 51.1 |
Bitcoin Plunges Under $70K As Bears Unleash Fresh Selling
Key Highlights
- Bitcoin declined heavily below $70,000 before the bulls emerged.
- A bearish trend line is forming with resistance at $72,500 on the 4-hour chart of BTC/USD.
- Ethereum remains in a bearish zone below $2,150.
- Gold could start another decline if it dips below $4,400.
Bitcoin Price Technical Analysis
Bitcoin price failed to stay above $75,000 against the US Dollar. BTC reacted to the downside below $72,000 and $70,000.
Looking at the 4-hour chart, the price settled below the $70,000 handle, the 100 simple moving average (red, 4-hour), and the 200 simple moving average (green, 4-hour). It even spiked below $67,500. If the bulls attempt a recovery wave, they could face resistance at $69,500 and the 23.6% Fib retracement level of the recent decline from the $77,988 swing high to the $66,925 low.
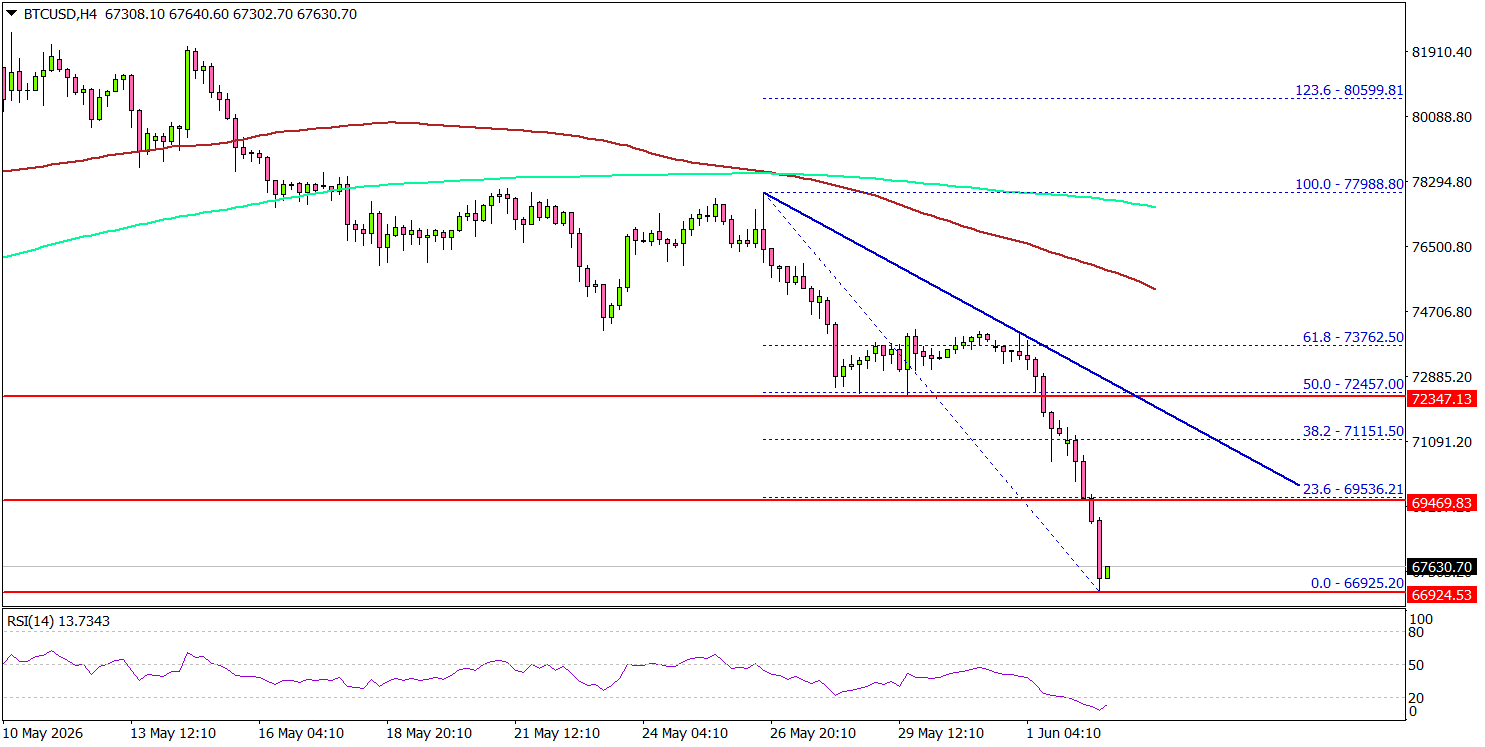
The first major resistance could be $71,200. The main resistance might be near the trend line at $72,500 and the 50% Fib retracement level of the recent decline from the $77,988 swing high to the $66,925 low.
A close above $72,500 could send the price toward $74,200. Any more gains might call for a test of $75,000. If there is a fresh decline, an immediate support might be $66,500.
The first key support could be $65,000. The main breakdown support could be $63,500. A downside break below $63,500 might start another decline. The next major support might be $60,000, below which BTC could decline toward $58,000.
Looking at Ethereum, the price also gained bearish momentum below $2,120 and remains at risk of more downside.
Today’s Key Economic Releases
- US S&P Global Services PMI for May 2026 – Forecast 50.9, versus 50.9 previous.
- US ISM Services Index for Feb 2026 – Forecast 53.8, versus 53.6 previous.
BTCUSD Extends Steep Fall Below Psychological 70K Support
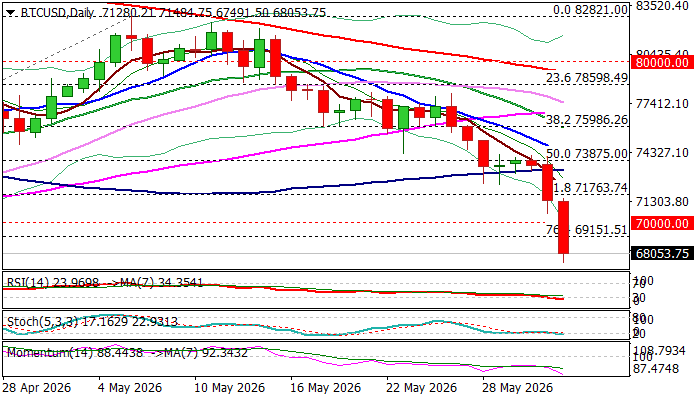
BTCUSD extends steep fall into second straight day, as bears accelerated after emerging below thick daily cloud on Monday (cloud base contained four consecutive attacks before break) to hit the lowest levels in nearly two months.
Fresh weakness broke psychological 70K support as well as Fibo level at 69151 (76.4% of 64929/82463 rally), with close below these levels to generate strong bearish signal for further drop.
Daily MAs turned into full bearish configuration (following Monday break of 100DMA) and formed several bear-crosses that contribute to weakening near-term structure, as negative momentum continues to strengthen.
Bears eye key short-term supports at 65500 and 65000 zone (lows of late March / early April), but oversold daily studies suggest that downtrend is likely to pause for consolidation before resuming.
Broken 70K level reverted to initial resistance which should ideally cap, with broken 100DMA (73252) and cloud base (73875) expected to limit extended upticks and keep larger bears in play.
Res: 69151; 70000; 73252; 73875
Sup: 67000; 66260; 65500; 65000
GBPJPY Wave Analysis
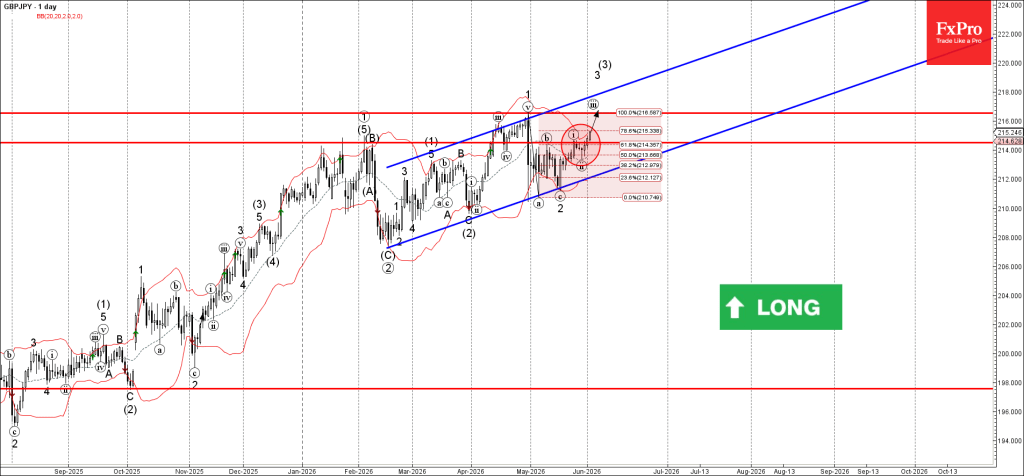
GBPJPY: ⬆️ Buy
- GBPJPY broke resistance level 215.00
- Likely to rise to resistance level 216.50
GBPJPY currency pair recently broke the resistance area between the resistance level 215.00 (which stopped the previous waves (b) and i) and the 61.8% Fibonacci correction of wave b from the start of May.
The breakout of this resistance area accelerated the active impulse waves 3 and (3).
Given the strong daily uptrend and the continuation of the bearish yen sentiment, GBPJPY currency pair can be expected to rise to the next resistance level 216.50 (top of the previous impulse wave 1).
Platinum Wave Analysis
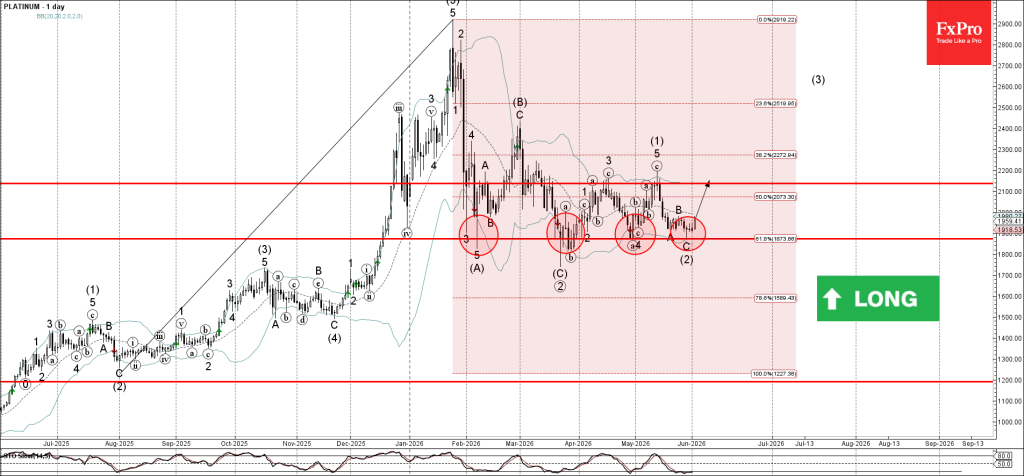
Platinum : ⬆️ Buy
- Platinum reversed from strong support level 1870.00
- Likely to rise to resistance level 2140.00
Platinum recently reversed from the support area between the strong support level 1870.00 (which has been reversing the price from February), 61.8% Fibonacci correction of the upward impulse from July and the lower daily Bollinger Band.
The upward reversal from this support area stopped the previous intermediate ABC correction (2).
Given the strength of the support level 1870.00 and the oversold daily Stochastic, Platinum can be expected to rise to the next resistance level 2140.00 (which stopped earlier waves 3 and (3)).
Eco Data 6/3/26
| GMT | Ccy | Events | Act | Cons | Prev | Rev |
|---|---|---|---|---|---|---|
| 22:45 | NZD | Building Permits Apr | 10.90% | -1.30% | -0.80% | |
| 22:45 | NZD | Terms of Trade Index Q1 | -2.00% | -2.00% | 3.70% | |
| 00:30 | JPY | Services PMI May F | 50 | 50 | 50 | |
| 01:30 | AUD | GDP Q/Q Q1 | 0.30% | 0.50% | 0.80% | 0.90% |
| 01:45 | CNY | RatingDog Services PMI May | 54.4 | 52.3 | 52.6 | |
| 07:50 | EUR | France Services PMI May F | 44.3 | 42.9 | 42.9 | |
| 07:55 | EUR | Germany Services PMI May F | 48.1 | 47.8 | 47.8 | |
| 08:00 | EUR | Eurozone Services PMI May F | 47.7 | 46.4 | 46.4 | |
| 08:30 | GBP | Services PMI May F | 49.3 | 47.9 | 47.9 | |
| 09:00 | EUR | Eurozone PPI M/M Apr | 0.60% | 0.40% | 3.40% | |
| 09:00 | EUR | Eurozone PPI Y/Y Apr | 4.90% | 4.80% | 2.10% | 2.00% |
| 12:15 | USD | ADP Employment Change May | 122K | 110K | 109K | 105K |
| 12:30 | CAD | Labor Productivity Q/Q Q1 | -0.50% | 0.70% | -0.10% | -0.30% |
| 13:45 | USD | Services PMI May F | 50.7 | 50.9 | 50.9 | |
| 14:00 | USD | ISM Services PMI May | 54.5 | 53.6 | 53.6 | |
| 14:00 | USD | Factory Orders M/M Apr | 4.80% | 4.60% | 1.50% | |
| 14:30 | USD | Crude Oil Inventories (May 29) | -8.0M | -2.9M | -3.3M | |
| 18:00 | USD | Fed's Beige Book |
| 22:45 | NZD |
| Building Permits Apr | |
| Actual | 10.90% |
| Consensus | |
| Previous | -1.30% |
| Revised | -0.80% |
| 22:45 | NZD |
| Terms of Trade Index Q1 | |
| Actual | -2.00% |
| Consensus | -2.00% |
| Previous | 3.70% |
| 00:30 | JPY |
| Services PMI May F | |
| Actual | 50 |
| Consensus | 50 |
| Previous | 50 |
| 01:30 | AUD |
| GDP Q/Q Q1 | |
| Actual | 0.30% |
| Consensus | 0.50% |
| Previous | 0.80% |
| Revised | 0.90% |
| 01:45 | CNY |
| RatingDog Services PMI May | |
| Actual | 54.4 |
| Consensus | 52.3 |
| Previous | 52.6 |
| 07:50 | EUR |
| France Services PMI May F | |
| Actual | 44.3 |
| Consensus | 42.9 |
| Previous | 42.9 |
| 07:55 | EUR |
| Germany Services PMI May F | |
| Actual | 48.1 |
| Consensus | 47.8 |
| Previous | 47.8 |
| 08:00 | EUR |
| Eurozone Services PMI May F | |
| Actual | 47.7 |
| Consensus | 46.4 |
| Previous | 46.4 |
| 08:30 | GBP |
| Services PMI May F | |
| Actual | 49.3 |
| Consensus | 47.9 |
| Previous | 47.9 |
| 09:00 | EUR |
| Eurozone PPI M/M Apr | |
| Actual | 0.60% |
| Consensus | 0.40% |
| Previous | 3.40% |
| 09:00 | EUR |
| Eurozone PPI Y/Y Apr | |
| Actual | 4.90% |
| Consensus | 4.80% |
| Previous | 2.10% |
| Revised | 2.00% |
| 12:15 | USD |
| ADP Employment Change May | |
| Actual | 122K |
| Consensus | 110K |
| Previous | 109K |
| Revised | 105K |
| 12:30 | CAD |
| Labor Productivity Q/Q Q1 | |
| Actual | -0.50% |
| Consensus | 0.70% |
| Previous | -0.10% |
| Revised | -0.30% |
| 13:45 | USD |
| Services PMI May F | |
| Actual | 50.7 |
| Consensus | 50.9 |
| Previous | 50.9 |
| 14:00 | USD |
| ISM Services PMI May | |
| Actual | 54.5 |
| Consensus | 53.6 |
| Previous | 53.6 |
| 14:00 | USD |
| Factory Orders M/M Apr | |
| Actual | 4.80% |
| Consensus | 4.60% |
| Previous | 1.50% |
| 14:30 | USD |
| Crude Oil Inventories (May 29) | |
| Actual | -8.0M |
| Consensus | -2.9M |
| Previous | -3.3M |
| 18:00 | USD |
| Fed's Beige Book | |
| Actual | |
| Consensus | |
| Previous | |
Bitcoin Losing Confidence of Major Holders
Market Overview
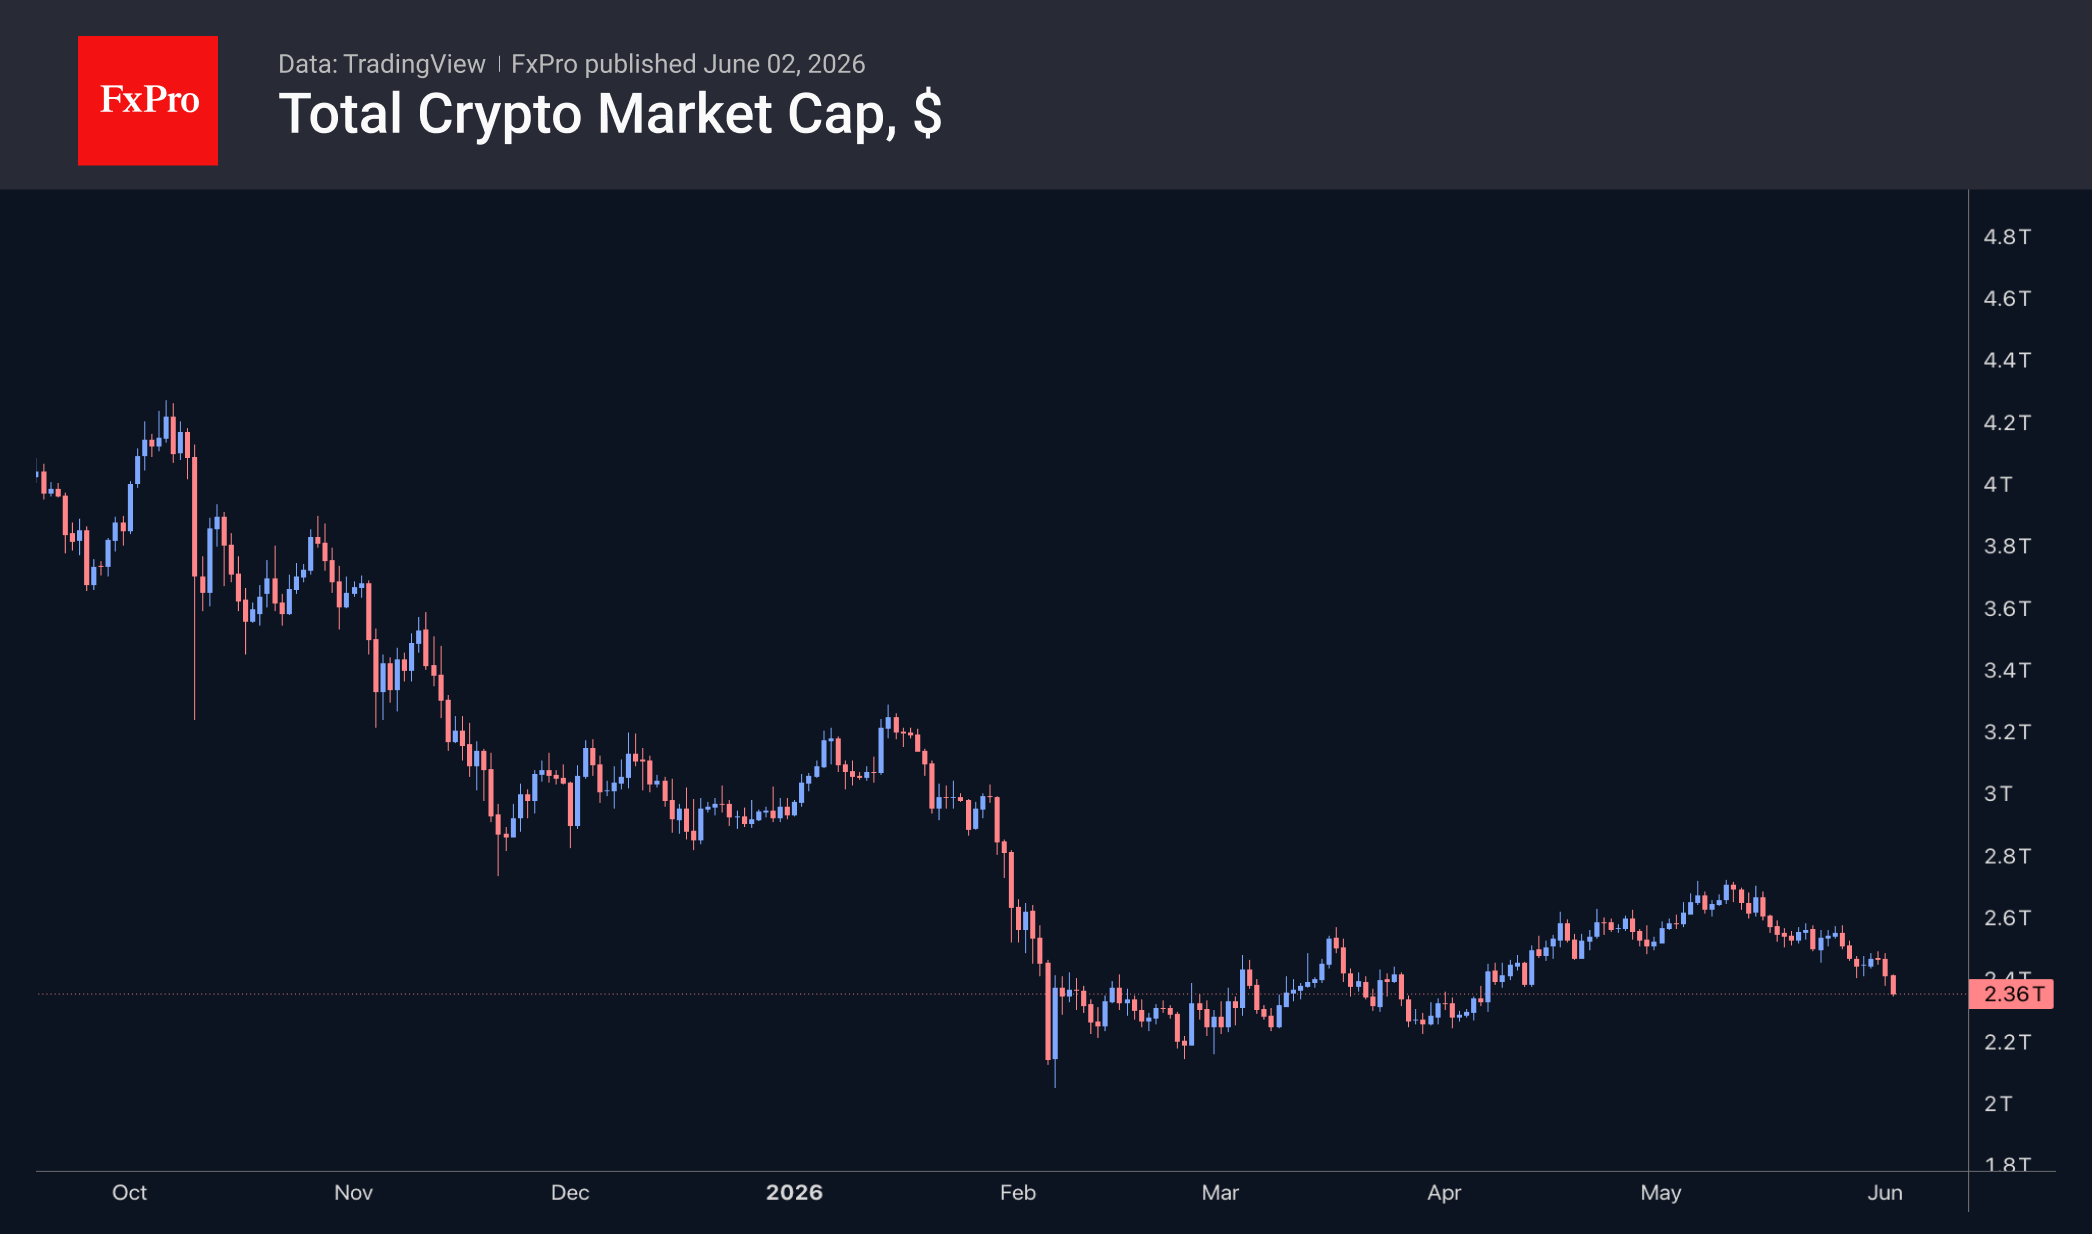
The crypto market capitalisation has been rapidly shrinking since the start of the new week, falling by 5% to $2.38 trillion, its lowest level since early April. It appears that confidence in the prospects of cryptocurrency has fallen sharply following reports of a largely symbolic BTC sale from Strategy’s balance sheet, which may be followed by more active selling from other holders.
We also cannot rule out an ‘Iranian connection’, as reports of seizures of Iranian cryptocurrency undermine the notion of anonymity and untraceability that has long underpinned the crypto market. The solid performance of supposedly anonymous coins fits neatly into this hypothesis. Thus, over the past 24 hours, the top performers have been NEAR Protocol (+14.8%), Internet Computer (+10.2%) and Zcash (+5%). The three worst performers are Stellar (-13.2%), Basic Attention Token (-10%) and Bitcoin (-4.3%).
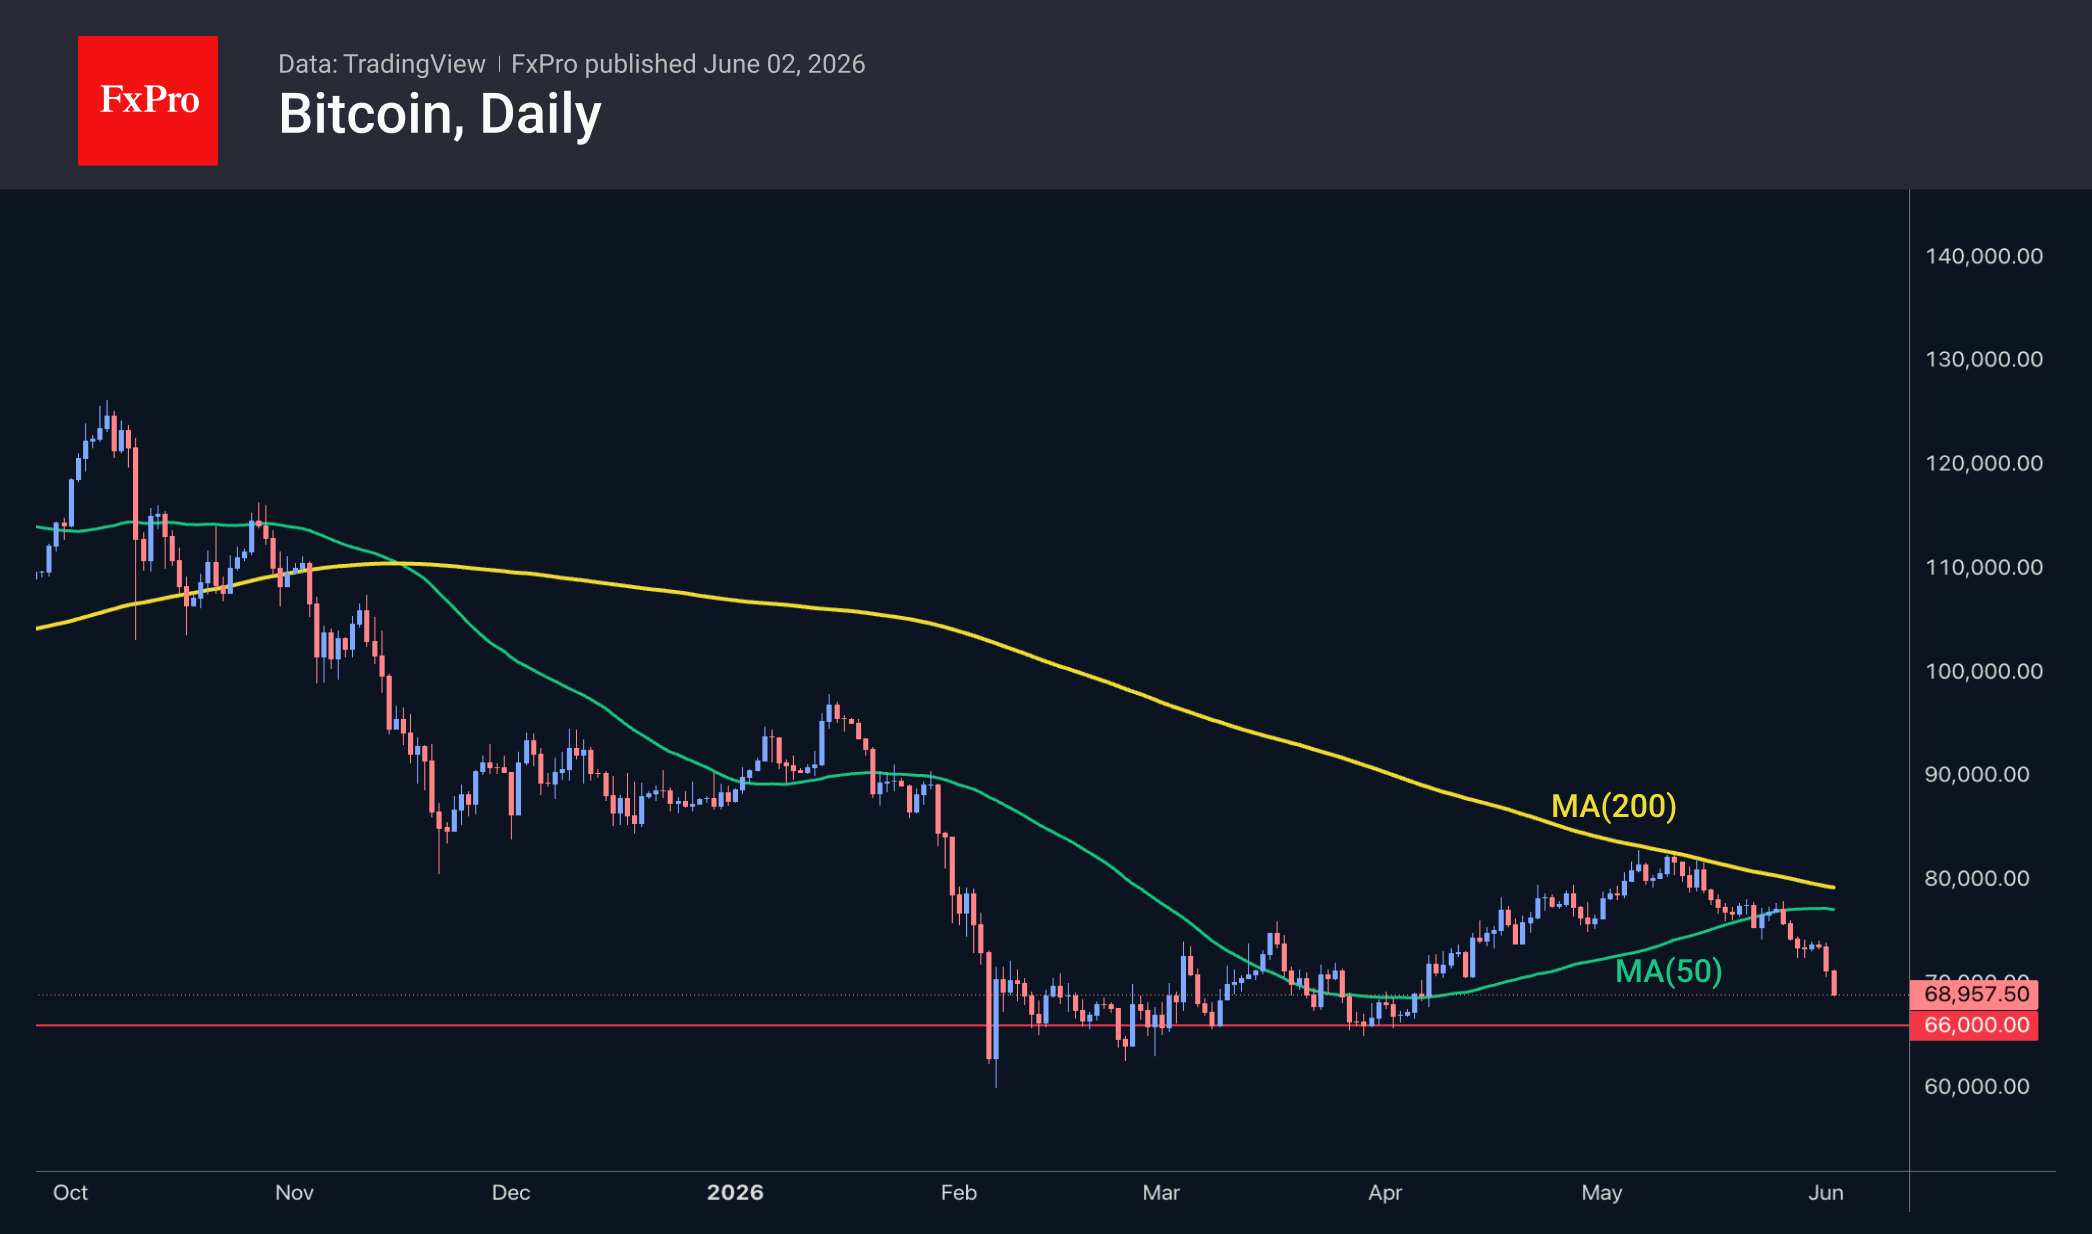
Bitcoin is accelerating its decline, having fallen to $69K, even though it started the week just above $74K. As expected, the drop below the 50-day moving average a week ago followed more than a week of selling pressure at that level. Technically, the leading cryptocurrency faces relatively few obstacles on its way down to the $65-66K range, but further down, longer-term support may come into play, having halted the decline in February and March.
News Background
According to CoinShares, global investment in crypto funds fell by $1.671 billion last week, marking the largest outflow since January. Investments in Bitcoin fell by $1.438 billion (the largest outflow from BTC this year), in Ethereum by $257 million, in Solana by $1 million, and in Sui by $1 million. Investments in altcoins rose by $20 million in XRP, $11 million in Hyperliquid, and $8 million in Near.
Sentiment towards Bitcoin on social media has reached its most positive level since the start of the year, despite the crypto market’s decline in May, Santiment notes. In the past, such surges in optimism have often coincided with local price highs for the asset.
Strategy has sold Bitcoin for the first time since 2022. Last week, 32 BTC were sold for approximately $2.5 million at an average price of $77,135 per coin. The largest corporate holder of Bitcoin, which had previously promised never to sell the asset, will use the proceeds to pay dividends on preference shares.
As a result of the latest adjustment, Bitcoin’s mining difficulty rose by 1.72% to 138.96 T. The figure has returned to its April highs.
Telegram founder Pavel Durov has renamed the cryptocurrency Toncoin (TON) to Gram (GRAM), describing the rebranding as a return to its roots. The blockchain will retain the name TON (The Open Network). No action is required from token holders.