Sample Category Title
Euro Area Inflation to Affirm June ECB Hike
In focus today
In the US, the April JOLTS report is due for release in the afternoon. The Fed follows the number of job openings as a key measure of labour demand. Back in March, the number of hires also showed tentative signs of a recovery. Moreover, the Fed's Beth Hammack (voter, hawk) will be on the wires.
In the euro area, today brings the aggregate HICP inflation for May. We have already received 75% of the index from individual country releases, which came in slightly lower than expected. Importantly, the country releases did not indicate that rising prices from the energy shock was broadening beyond energy components. We expect headline inflation at 3.1% y/y and core at 2.4% y/y.
In Denmark, Danmarks Nationalbank's press release on the May FX reserve will be published, providing insight into whether the central bank intervened in the FX market during May, where EUR/DKK hit a historic high level of 7.4741.
In Poland, the National Bank of Poland will announce its rate decision. We expect the policy rate to be kept unchanged at 3.75%, in line with consensus.
Economic and market news
What happened since yesterday
In the Oil market, Brent crude reversed much of last week's ceasefire-driven decline, briefly trading above USD 97/bbl, after Iran reportedly halted negotiations with the US over continued fighting in Lebanon. Prices later eased after President Trump said negotiations with Tehran were continuing and signalled expectations of a deal to extend the ceasefire and reopen Hormuz "over the next week". Trump also claimed Israel and Hezbollah had agreed to stop shooting, helping Brent slip back below USD 95/bbl.
In the US, ISM Manufacturing surprised on the upside in May and signals a more positive outlook for the economy than the PMI. The headline index rose to 54.0 (cons: 53.0, prior: 52.7), driven by strong new orders at 56.8 (prior: 54.1) and higher employment. The prices index edged marginally lower but remains historically elevated. The details suggest solid demand across both domestic and export orders, while an improved order‑inventory balance often points to further gains in production.
In the euro area, inflation expectations in the ECB's consumer survey stabilised in April following the large uptick in March. The 3Y median expectation ticked down to 2.9% from 3.0%, while the 1Y median remained unchanged at 4.0%. Although the still elevated expectations support the ECB's hike in June, the stabilisation buys the ECB more time to assess the impact of the shock before embarking on a second hike.
Also in the euro area, the unemployment rate remained at 6.3% in April similar to March. It was above the expected 6.2%, but the historical data was revised up while the actual number of unemployed persons fell from March to April. Hence, the rise in the unemployment rate should not be seen as a sign of new weakening in the labour market from the war in Iran.
In OPEC+, several member countries are reportedly leaning towards a modest 188,000 bpd increase in their July oil output target at Sunday's meeting, mirroring the June hike excluding the UAE. However, with production still well below target due to export cuts and the SOH closure, the move is unlikely to affect oil prices unless it results in higher realised exports.
In Denmark, Social Democrat leader Mette Frederiksen has agreed to form a new centre-left minority coalition government, securing a third consecutive term as prime minister after the March election. The government will be presented this week and will include the Social Democrats, Social Liberals, Left Greens and Moderates.
Equities: Global equities rose yesterday and several indices set new all-time highs, but the move was extremely narrow. Leadership came almost entirely from energy and, needless to say, tech. The narrow leadership was certainly not something one could blame on the macro data. Rather, renewed tensions around Iran and a 5 percent jump in oil prices was the reason that 9 out of 11 sectors were lower yesterday. However, given the strong performance in tech, large cap cyclicals outperformed while minimum volatility and defensives underperformed.
It has become even more evident recently just how narrow equity market leadership has become. Since the end of March, global equities are up around 17 percent, but this has been driven especially by the tech sector, which globally is up close to 45 percent since the bottom. This reinforces what we have stressed many times this year, and what is becoming increasingly clear for investors across financial markets: 2026 will be a year dominated by AI and the AI buildout. We are seeing earnings growth that is four times what GDP growth would normally imply! From an equity and risk perspective, that means the 2026 story is AI to a much greater extent than oil, Iran, geopolitics and so on. It is more or less all about AI.
This morning, Asian markets are somewhat in the red, led by South Korea, which is down a couple of percent. But note that South Korea's leading equity index is still up around 130 percent year to date. If there was any doubt about what that rhymes with, the answer is of course AI. European futures are marginally higher, while US futures are in the red this morning.
FI and FX: A rebound in the oil price set the tone in FX and fixed income markets yesterday. The rise in the oil price pushed up yields in US and Europe in parallel with 2Y EUR and USD swap rates rising as much as 6bp. EUR/USD fell and USD/JPY rose owing mainly to the rise in oil prices. EUR/SEK also rose and EUR/NOK initially traded back and forth on the news but is also trading at a higher level now.
RBA’s Harper Warns Rising Inflation Expectations Could Require “Strong Action”
RBA board member Ian Harper struck a hawkish tone in his speech today, warning that rising long-term inflation expectations could become a significant concern for policymakers. Harper emphasized that "inflation expectations are important" and noted there is "a concern about what's happening at the long-end," referring to signs that markets increasingly expect inflation to remain above target for an extended period.
While acknowledging that higher interest rates are expected to slow the economy, Harper stressed that the central bank's priority remains preventing inflation from becoming entrenched. His strongest message came when discussing inflation expectations directly, warning that "if there is a risk that long-term inflation expectations are becoming unanchored, as we say, then that requires strong action."
Harper also highlighted the inflationary impact of the Middle East energy shock, noting that price pressures were already re-emerging before fuel costs surged. While the RBA cannot prevent the initial increase in energy prices, he said policymakers are responsible for "ensuring that those effects do not become embedded in the Australian economy."
Elliott Wave Analysis: GBPUSD Five Swing Advance from May 18 Signals Upside
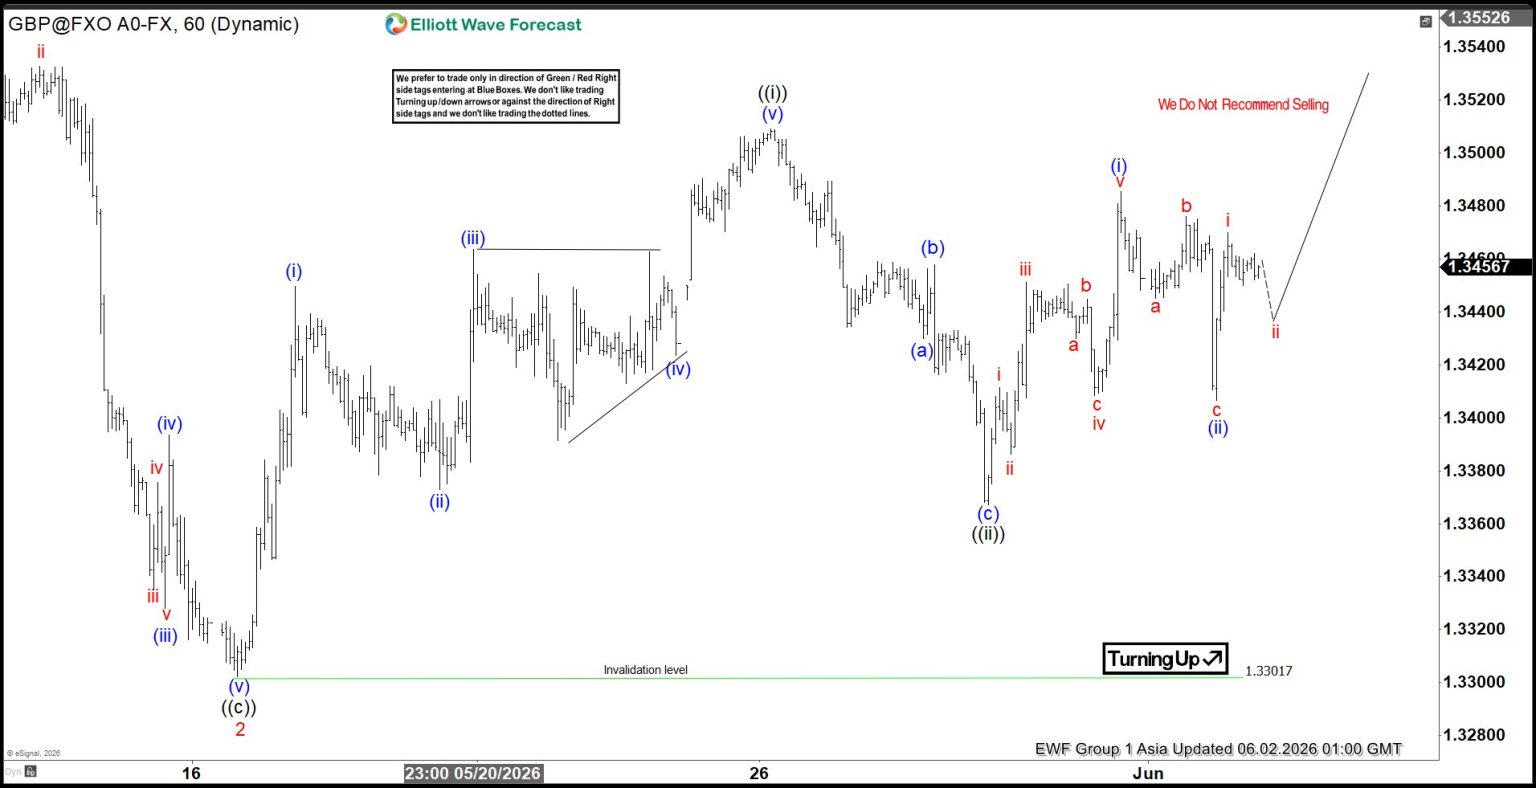
The short‑term Elliott Wave outlook for GBPUSD indicates that the rally from the March 31, 2026 low is progressing as a five‑wave impulse. From that date, wave 1 concluded at 1.3658, followed by a corrective pullback in wave 2 that ended at 1.33. The pair then advanced in wave 3, establishing a clear impulsive structure. Within wave 1, wave (i) terminated at 1.345, while the subsequent pullback in wave (ii) ended at 1.337. The advance continued with wave (iii) reaching 1.346, before wave (iv) corrected to 1.342. The final leg, wave (v), pushed higher to 1.35, completing wave ((i)).
The correction in wave ((ii)) found support at 1.3367, and the pair has since resumed its upward trajectory in wave ((iii)). This development reinforces the bullish interpretation, as the five‑swing rally from the wave 2 low provides structural confirmation of the trend. From wave ((ii)), wave (i) advanced to 1.348 in a five‑swing sequence, while the corrective wave (ii) ended at 1.34 in a three‑wave pattern.
Near term, as long as GBPUSD remains above 1.33, dips are anticipated to attract buyers. Such retracements are likely to unfold in either three or seven swings, offering opportunities for renewed strength. The overall structure suggests that the pair retains a constructive bias, with higher levels favored as long as the key support at 1.33 holds.
GBPUSD 60-Minute Elliott Wave Chart
GBPUSD Elliott Wave Video:
https://www.youtube.com/watch?v=IaPa6lyBV4E
Gold’s 4,400-4,600 Standoff To Be Decided by the Next Iran Headline
Gold is trapped between two competing narratives, and neither side is winning decisively. Last week, the precious metal rebounded after successfully defending a major support cluster around 4,400, only to see the recovery stall below 4,600 resistance. This week, Gold has weakened again as Dollar and oil prices recovered and investors partially unwound the peace trade that had dominated markets. The result is a market stuck between hopes for a diplomatic breakthrough and fears of a renewed escalation in the Middle East.
The confusion stems from contradictory headlines surrounding US-Iran negotiations. Earlier this week, reports suggested Iran would halt talks with Washington and consider blocking the Strait of Hormuz in response to Israeli military operations in Lebanon. Oil prices immediately surged on the news.
Yet later in the day, US President Donald Trump struck a far more optimistic tone, saying he had a "very productive call" with Israeli Prime Minister Benjamin Netanyahu and that "talks are continuing, at a rapid pace, with the Islamic Republic of Iran." Trump also claimed that Israel would not send troops into Beirut and that Hezbollah had agreed to halt attacks on Israel through indirect communications.
However, Netanyahu later qualified those remarks, warning that Israel would continue striking targets in Beirut if Hezbollah attacks persisted. The conflicting messages left investors with no clear answer on whether diplomacy is advancing or deteriorating.
For now, broader market pricing still points to caution rather than panic. Brent crude remains elevated around $94 a barrel, well above last week's low at $89.93, but comfortably below the key resistance area around $97.81. Treasury yields have not surged, and investors have not rushed aggressively into safe-haven assets. That suggests markets are still assigning a reasonable probability to an eventual diplomatic outcome, even if confidence has weakened.
Technically, Gold remains vulnerable for now. The rejection from 4,580.33 resistance suggests the decline from at 4,889.24 may still be unfolding. A firm break below support at 4,366.22, followed by sustained trading beneath 61.8% retracement of 4,098.45 to 4,889.24 at 4,400.53 , would strengthen the bearish case and open the door for a steeper decline toward 4,098.45 low.
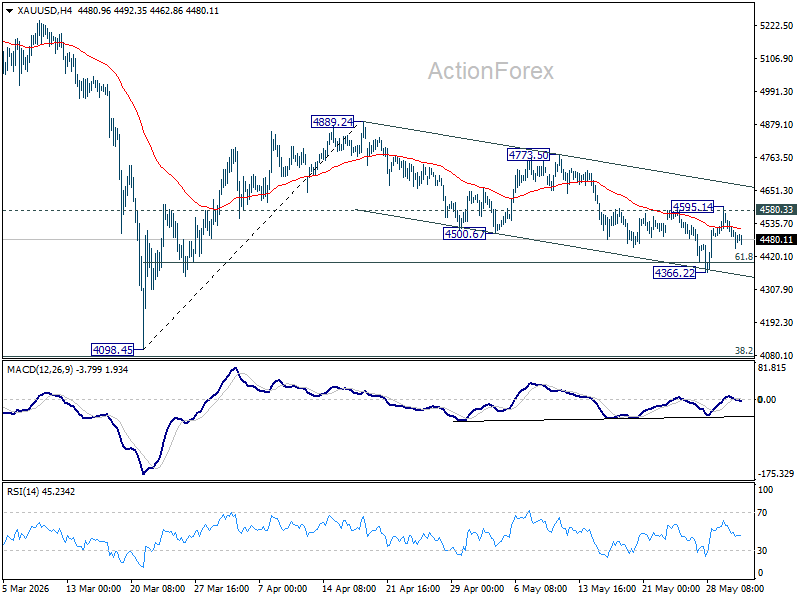
The bullish case depends largely on geopolitics. For now, the market is caught in a standoff. Support near 4,400 is holding. Resistance near 4,600 is holding. Until the geopolitical picture becomes clearer, Gold traders may find themselves waiting for the next Iran headline to decide which side finally gives way.
US Stock Futures Dipped on Conflicting US-Iran News After S&P 500 Scaled a Historic High
Key takeaways
- Global equities climbed to fresh record highs as optimism surrounding ongoing U.S.-Iran diplomatic negotiations combined with relentless AI-driven capital expenditure, boosting major indices including the S&P 500, Nasdaq, MSCI World, and Nikkei 225.
- The U.S. economy is displaying an increasingly pronounced “K-shaped” divergence, where AI-fuelled corporate investment and profits continue to surge. At the same time, consumer savings have fallen to near their lowest levels since the Global Financial Crisis, raising concerns about the sustainability of consumer spending.
- Market leadership has become highly concentrated in technology and AI-related sectors, with Nvidia, Dell, Oracle, and other AI beneficiaries driving index gains. In contrast, most other sectors lag, highlighting growing concentration risk beneath record-high equity indices.
- Chart of the day: USD/JPY’s 4-week is losing upside momentum with risk of a minor corrective setback below 159.85 key short-term resistance.
Top macro headlines
- World benchmarks stock indices scale all-time highs on Trump assurances: Global risk sentiment exploded on Monday as the big three U.S. stock indices joined the MSCI World, MSCI EM, and Japan’s Nikkei in hitting new historic records. The broad advance followed statements from U.S. President Donald Trump indicating that, despite fresh weekend military exchanges, Washington and Tehran remain engaged in active diplomatic discussions.
- U.S. manufacturing activity expands at 4-Year High: Defying structural headwinds from the regional oil shock and record-low consumer confidence, figures released on Monday showed that U.S. manufacturing activity is growing at its fastest pace in four years. ISM Manufacturing PMI for May rose to 54.0 versus 52.7 in April, and came in above expectations of 53. The brisk expansion is being driven primarily by immense, front-loaded corporate capital expenditures in artificial intelligence.
- Anthropic leads flurry of multi-trillion dollar IPO filings: Wall Street’s AI frenzy reached a new milestone as generative AI champion Anthropic confidentially filed for a U.S. initial public offering. With OpenAI preparing a parallel filing and SpaceX set to price its record-breaking listing later this month, institutional desks calculate that up to $4 trillion of new market capitalisation could debut in the coming weeks.
- NVIDIA moves AI edge computing directly to the PC Market: Shifting the competitive landscape for hardware developers, NVIDIA unveiled a new specialised architecture chip engineered to embed generative AI capabilities directly into standard laptops and desktop personal computers.
- U.S. consumer savings pool erased to pre-crisis low: Highlighting a severe “K-shaped” economic divergence, real economic metrics show the U.S. personal savings rate has plummeted to a four-year low of 2.6%. Excluding a brief anomaly in June 2022, the buffer is now tracking at its lowest overall absolute level since the 2008 global financial crisis.
Key macro themes
- The multi-speed K-shaped consumer chasm: While corporate America, riding the AI infrastructure boom, enjoys near-historic profit expansions, everyday consumers are facing severe cost-of-living constraints. The rapid rate at which the population is depleting its savings buffers to sustain retail spending is a flashing warning to macroeconomists that current domestic consumption models are structurally unsustainable.
- The imbalance in extreme sector equity concentration: Although broad market averages notched pristine records, the underbelly of Monday’s Wall Street session exposed highly fragile technical leadership. Only two out of the S&P 500’s 11 major sectors finished in positive territory: technology (+2.5%) and energy (+1.9%). The remaining nine sectors fell broadly on Monday, 1 June, led by a 3% plunge in defensive utilities and a 2.6% drop in consumer discretionaries.
- Geopolitical supply volatility and the energy buffer draw: Renewed weekend military strikes between the U.S. and Iran in Kuwait and Lebanon instantly revived global supply anxieties. It comes at a highly critical juncture for physical fuel markets, where a historic 15-week streak of national gasoline stockpile drawdowns has left the system without an operational buffer heading into peak summer driving season.
Global market impact (last 24 hours)
Equities: Wall Street’s indices pushed to record closings, spearheaded by specialised tech clusters. Major individual corporate gainers included Dell (+10%), Oracle (+10%), and Nvidia (+6%), while Micron topped the historic $1,000 threshold. Hewlett-Packard exploded by 28% in after-hours trade following earnings. Conversely, hardware laggards included Qualcomm (-9%), Meta (-5%), and Intel (-5%). Europe and the UK finished lower on Monday, 1 June; DAX (-0.4%), FTSE 100 (-0.7%).
Fixed Income: Sovereign bond markets faced steady selling pressure. Strong local manufacturing activity and structural stagflationary elements pushed U.S. Treasury yields up across the curve by as much as 3 basis points.
FX: The U.S. Dollar Index displayed broad upward dominance. The USD/JPY pair advanced aggressively toward the critical 160.00 intervention threshold. The New Zealand Dollar (Kiwi) and Swedish Krona dropped close to 1.0% to pace G10 losses, while the Argentine Peso (-1.5%) led emerging market declines.
Commodities: Crude oil prices spiked violently on geopolitical backsliding. Global benchmark Brent and WTI crude surged by 4%-5%. Non-yielding spot gold retreated by 1,2% after the rejection of its 20-day moving average to close at $4,485/oz on Monday, 1 June, on the backdrop of firmer US Treasury yields.
Asia Pacific impact
- Stock markets break higher: Regional indices captured strong positive spillover from global tech allocations. The MSCI Asia ex-Japan index climbed to a historic high, with Japan’s Nikkei 225 establishing fresh record peaks and South Korea’s benchmark KOSPI index exploding by 4.0% in a massive single-session breakout. In today’s Asia opening session, profit-taking has emerged amid conflicting narratives on the progress of US-Iran peace talks; Nikkei 225 (-1.1%), KOSPI (-1.1%), China A50 (-1%), ASX 200 (-1%). In comparison, STI bucked the trend with an intraday gain of 0.3%.
- Macro energy strains and imports: The severe commodity spike imposes immediate burdens on regional trading balances. Data show that China’s crude oil imports plummeted to a 10-year low in May, driven by worsening domestic economic conditions and high international invoice costs.
Top 3 events to watch today
- Eurozone Core Inflation Rate Prelim (May) - 5:00 pm SGT (consensus: 2.4% y/y, Apr: 2.2%) Impact: EUR/USD, EUR crosses, DAX
- Fed Speak (Hammack) - 8:30 pm SGT Impact: USD, Short-term US Treasuries, US stock indices
- US-Iran peace deal progress news flows Impact: All asset classes.
Chart of the day - USD/JPY is losing upside momentum
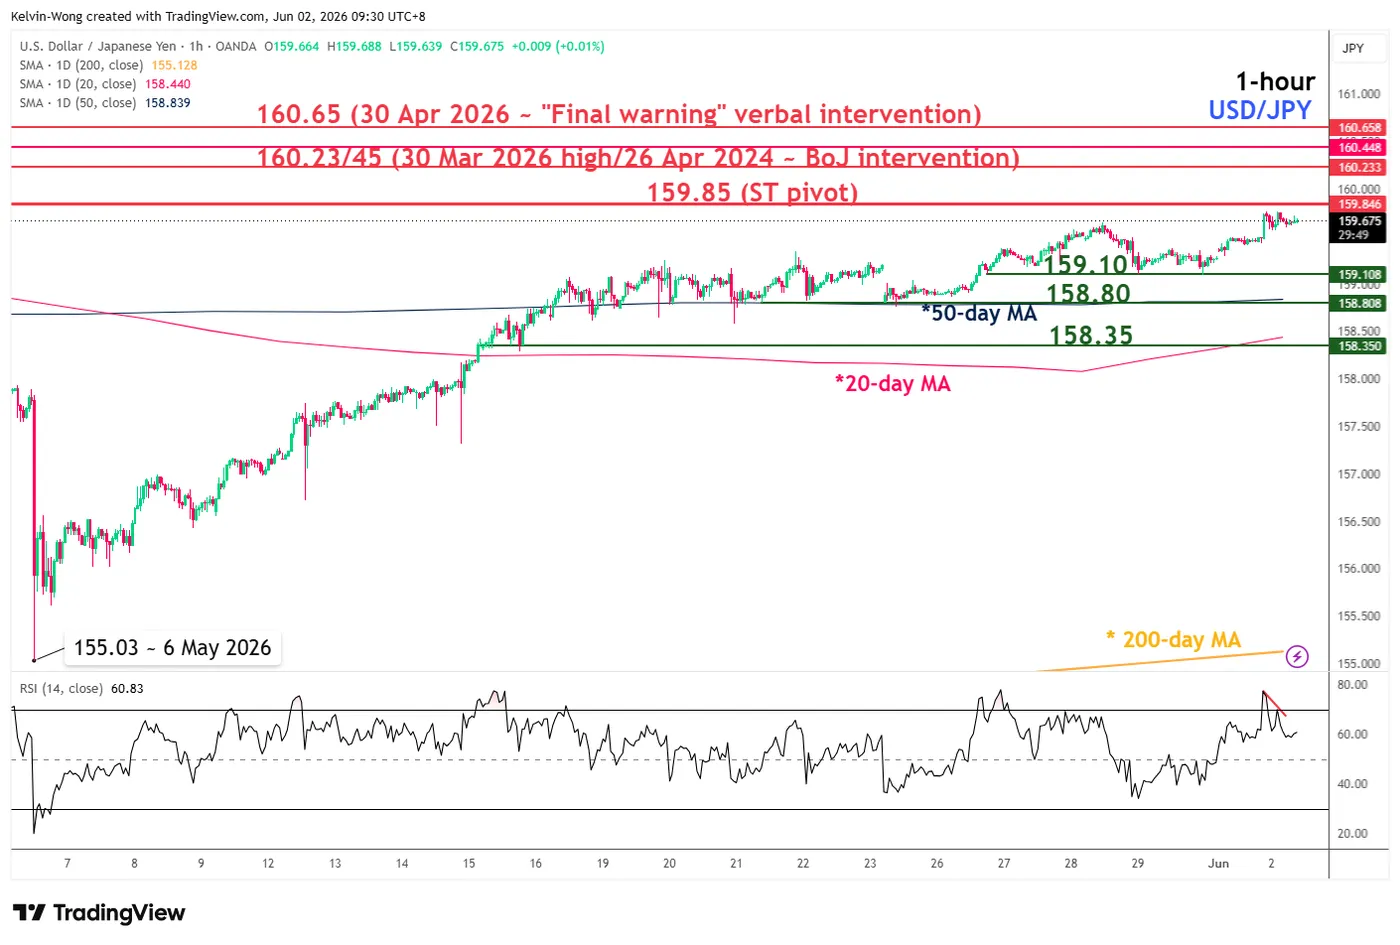
Fig. 1: USD/JPY minor trend as of 2 Jun 2026 (Source: TradingView).
The 3% rally in USD/JPY from its intraday low of 155.03 on 6 May 2026 is now showing signs of minor exhaustion.
The hourly RSI momentum indicator flashed out a prior bearish divergence condition and exited its overbought level on Monday, 1 June 2026.
Watch the 159.85 key short-term pivotal resistance with risk of a corrective setback towards the intermediate supports of 159.10 and 158.80 (also the 50-day moving average) (see Fig. 1).
However, a break and an hourly close above 159.85 invalidates the setback scenario and opens the door for a squeeze up towards the next intermediate resistances/prior intervention zones at 160.23/45 and 160.65.
Australia Approves Stronger Wage Rise as RBA Monitors Second-Round Effects
Australia's Fair Work Commission delivered a larger-than-last-year increase in minimum and award wages, lifting pay rates by 4.75% from July 1. The ruling directly affects around one-fifth of the workforce and will have the greatest impact on award-reliant industries including healthcare, retail, accommodation and food services, and labor hire. The increase marks an acceleration from the 3.50% rise awarded in 2025, although it remains below the 5.75% adjustment implemented in 2023.
For the RBA, the decision is unlikely to materially alter the near-term inflation outlook. Economists estimate the direct impact on wage growth will be modest, adding only around 0.1 percentage point to third-quarter Wage Price Index forecasts. At a time when economic growth is slowing and labor market conditions are gradually softening, the wage increase alone is unlikely to generate a meaningful new inflation impulse.
Nevertheless, policymakers will pay close attention to how businesses and employees respond. The risk is not the direct wage increase itself, but whether it influences broader wage-setting behavior across the economy. If the 4.75% rise becomes an informal benchmark for future pay negotiations, inflation expectations could prove more persistent than anticipated. While current economic conditions reduce the likelihood of a widespread wage-price spiral, the decision serves as a reminder that wage dynamics remain an important part of the RBA's inflation assessment.
GBP/USD Approaches A Make-Or-Break Technical Moment
Key Highlights
- GBP/USD started a recovery wave and tested the 1.3520 resistance.
- A contracting triangle is forming with resistance at 1.3480 on the 4-hour chart.
- EUR/USD is again moving lower and might decline below 1.1575.
- Bitcoin seems to be facing an increase in selling pressure and might dive below $70,000.
GBP/USD Technical Analysis
The British Pound found support at 1.3300 against the US Dollar. GBP/USD started a recovery wave above 1.3380 and 1.3420 before the bears appeared.
Looking at the 4-hour chart, the pair climbed above the 50% Fib retracement level of the downward move from the 1.3653 swing high to the 1.3302 low. However, the bears seem to be active near the key hurdle at 1.3520.
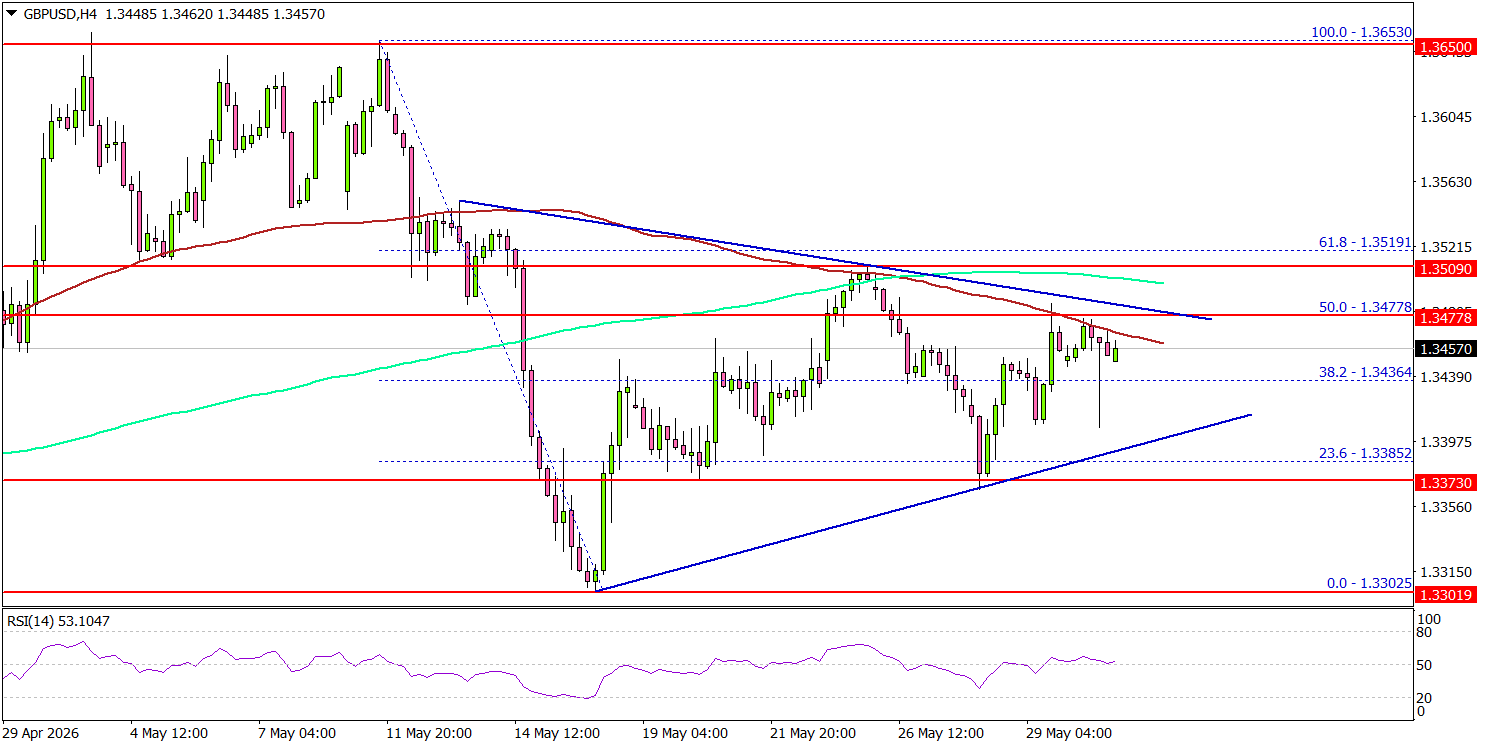
There is also a contracting triangle forming with resistance at 1.3480. The pair is now trading below the 100 simple moving average (red, 4-hour) and the 200 simple moving average (green, 4-hour).
On the upside, an immediate resistance could be 1.3480. The next major resistance might be 1.3520 and the 61.8% Fib retracement level of the downward move from the 1.3653 swing high to the 1.3302 low. A close above 1.3520 could open doors for gains above 1.3550. In the stated case, the bulls could aim for a move to 1.3650.
On the downside, the pair could find bids near 1.3420. The first major support might be 1.3400. A close below 1.3400 might initiate a drop to 1.3300. Any more losses might open the doors for a drop toward the 1.3220 zone.
Looking at EUR/USD, the pair failed to continue higher, started a fresh decline, and might move below the 1.1600 support.
Upcoming Key Economic Events:
- BoE's Governor Bailey speech.
- BoE's Greene speech.
CHFJPY Wave Analysis
CHFJPY: ⬇️ Sell
- CHFJPY reversed from resistance area
- Likely to fall to support level 202.00
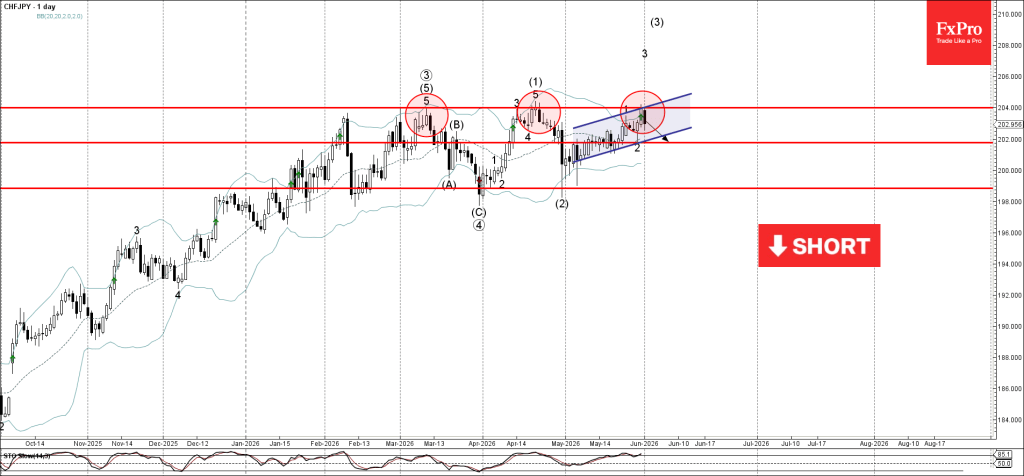
CHFJPY currency pair recently reversed down from the resistance area between the strong resistance level 204.00 (which has been reversing the price from March) and the upper daily Bollinger Band.
This resistance area was further strengthened by the resistance trendline of the daily up channel from the start of May.
Given the strength of the strong resistance level 204.00 and the overbought daily Stochastic, CHFJPY can be expected to fall to the next support level 202.00 (low of wave 2).
Eco Data 6/2/26
| GMT | Ccy | Events | Act | Cons | Prev | Rev |
|---|---|---|---|---|---|---|
| 23:50 | JPY | Monetary Base Y/Y May | -12.20% | -9.50% | -11.30% | |
| 01:30 | AUD | Current Account (AUD) Q1 | -27.1B | -22.8B | -21.1B | |
| 01:30 | AUD | Building Permits M/M Apr | -3.40% | -1.50% | -10.50% | |
| 08:30 | GBP | Mortgage Approvals Apr | 65.9K | 62K | 64K | |
| 08:30 | GBP | M4 Money Supply M/M Apr | 0.20% | 0.60% | 0.80% | |
| 09:00 | EUR | Eurozone CPI Y/Y May P | 3.20% | 3.20% | 3.00% | |
| 09:00 | EUR | Eurozone Core CPI Y/Y May P | 2.50% | 2.40% | 2.20% |
| 23:50 | JPY |
| Monetary Base Y/Y May | |
| Actual | -12.20% |
| Consensus | -9.50% |
| Previous | -11.30% |
| 01:30 | AUD |
| Current Account (AUD) Q1 | |
| Actual | -27.1B |
| Consensus | -22.8B |
| Previous | -21.1B |
| 01:30 | AUD |
| Building Permits M/M Apr | |
| Actual | -3.40% |
| Consensus | -1.50% |
| Previous | -10.50% |
| 08:30 | GBP |
| Mortgage Approvals Apr | |
| Actual | 65.9K |
| Consensus | 62K |
| Previous | 64K |
| 08:30 | GBP |
| M4 Money Supply M/M Apr | |
| Actual | 0.20% |
| Consensus | 0.60% |
| Previous | 0.80% |
| 09:00 | EUR |
| Eurozone CPI Y/Y May P | |
| Actual | 3.20% |
| Consensus | 3.20% |
| Previous | 3.00% |
| 09:00 | EUR |
| Eurozone Core CPI Y/Y May P | |
| Actual | 2.50% |
| Consensus | 2.40% |
| Previous | 2.20% |
Brent Oil Challenges 97.81 as Iran Halts Talks. Peace Trade Faces First Real Test
Just as investors were becoming comfortable with the idea of a US-Iran agreement, oil markets received a sharp reminder of how fragile that assumption remains. Reports from Iran's state-affiliated Tasnim news agency indicated that Tehran will suspend negotiations with Washington until Israeli operations in Gaza and Lebanon cease. The report also warned that Iran could move to fully block the Strait of Hormuz while opening additional pressure points through the Bab el-Mandeb Strait, one of the world's most important shipping routes.
The reaction in crude markets was immediate. Brent rallied sharply above $97 a barrel as traders rushed to reprice geopolitical risk. For the most of last week, markets had unwound the Middle East risk premium on expectations that a ceasefire extension and eventual diplomatic framework would restore stability to regional energy flows. The latest headlines suddenly force investors to reconsider whether that optimism moved too far, too fast.
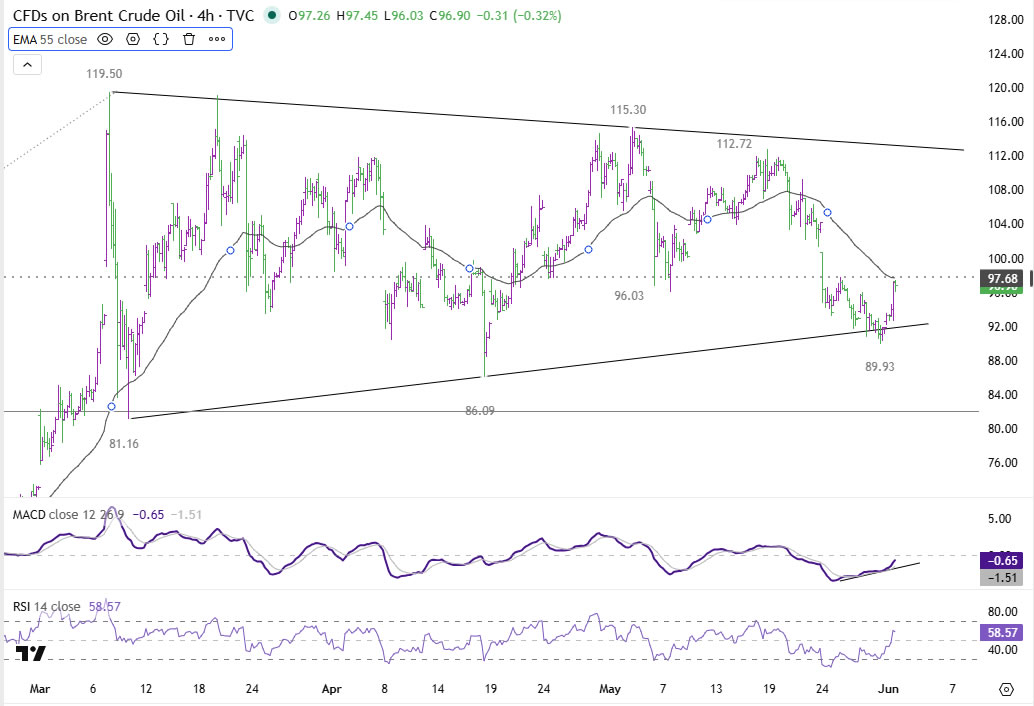
Technically, Brent is now approaching a decisive test. Resistance at 97.81 sits near 55 4H EMA (now at 97.66) and represents the key barrier separating a temporary rebound from a broader bullish reversal. Supporting the recovery case is the bullish convergence pattern on 4H MACD, suggesting bearish momentum has been weakening despite recent price declines.
Sustained break above 97.81 would likely confirm that Brent established a short-term bottom at 89.93 after successfully defending the lower boundary of the large converging triangle pattern that has dominated price action since March. In that scenario further rally would be seen toward the upper trendline near 113.00 as markets begin rebuilding the geopolitical premium that had largely disappeared.
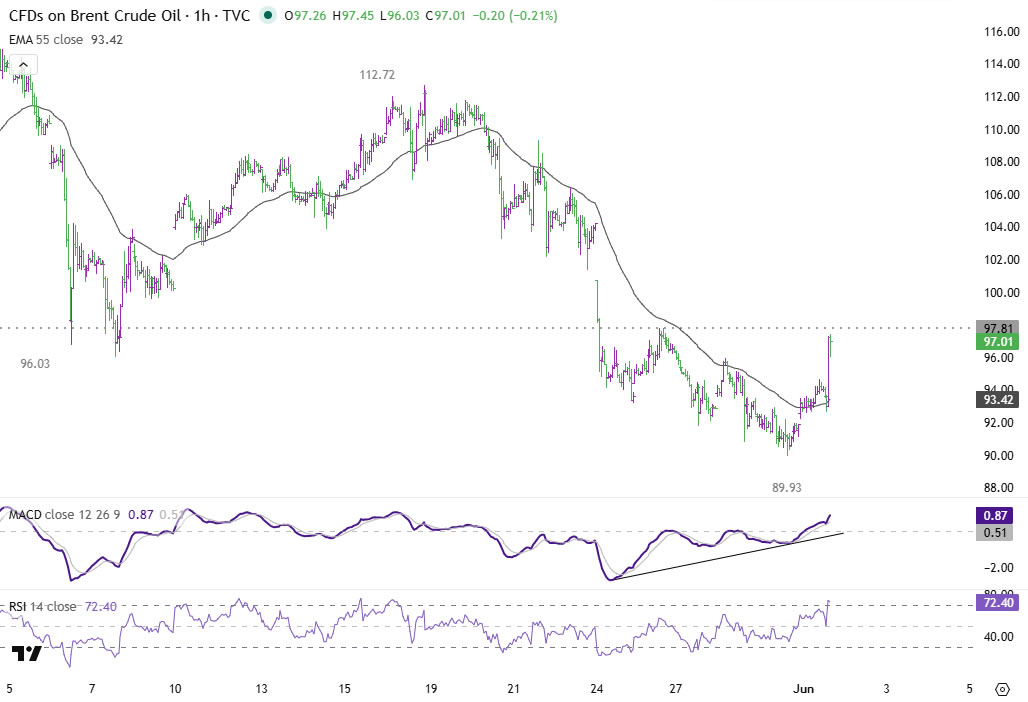
Failure at 97.81 would tell a very different story. It would suggest traders still view the latest escalation as part of a negotiating process rather than the start of a more dangerous breakdown. In that case, the broader bearish structure would remain intact and another move below 89.93 could eventually follow.
The peace trade has not collapsed yet. But Brent's test of 97.81 may determine whether it survives.