Sample Category Title
Sunset Market Commentary
Markets
Weekend comments by ECB members added to the June rate hike case which is now almost fully discounted (95% probability) as negotiations on an interim deal between Iran and the US drag on. Bulgarian ECB Radev warned that the cost of acting too late can exceed the cost of acting somewhat earlier if there’s a risk that inflation expectations could become less anchored. German Board member Schnabel also elaborated on the risk of deanchoring inflation expectations which imply that the ECB can no longer look through the energy shock. Portuguese ECB Perreira is also in favour of acting sooner rather than later to avoid second-order effects later on. He wants to act quickly and decisively. The latter suggest that EMU money markets might currently be underestimating the possibility of back-to-back action by the ECB. The only attach a 25% change to two consecutive moves, with a second 25 bps rate hike only fully discounted by the October policy meeting. From a data point of view, the European central bank released its April Consumer Expectations Survey. The median rate of perceived inflation over the previous 12 months increased to 4% from 3.5%. Looking forward, median expectations for 1-yr, 3-yr and 5-yr ahead remain at elevated levels though close to/at March levels: 4% for 1-yr, 2.9% (from 3%) for 3-yr and 2.4% for 5-yr. The combination of these factors (add higher oil prices; see below) caused an underperformance of German Bunds today. The yield curve bear flattens with yields rising by 9.9 bps (2-yr) to 3.8 bps (30-yr). US and UK yield curves move in similar fashion but with gains of up to 6 bps at the front end of the curve.
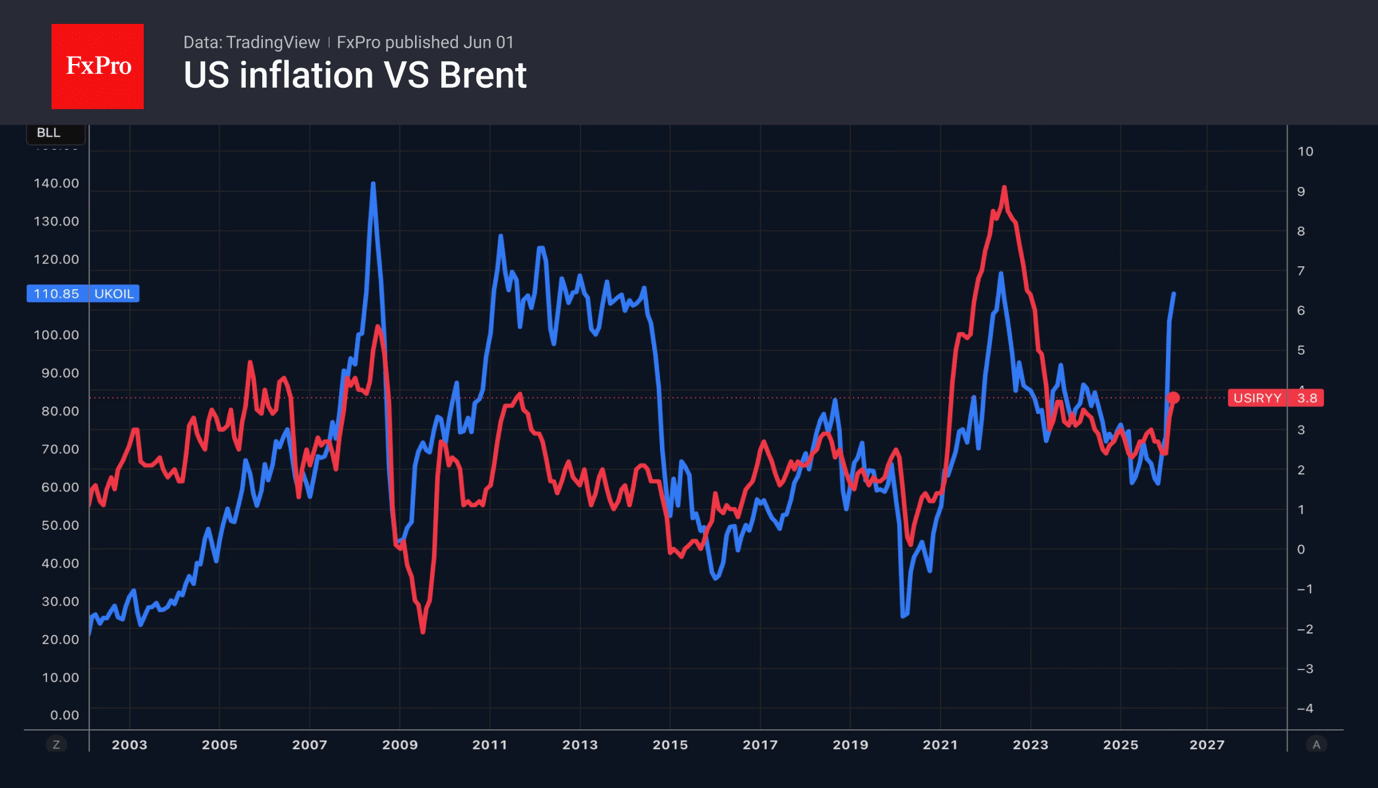
Oil prices were already rising today over lack of weekend progress between the US and Iran. The move accelerated on reports that Iran will halt exchanges with the US in protest over Israel. Tasnim news agency referred to Israel expanding its ground assault in Lebanon. Apart from suspending talks and the exchange of documents through mediators, Iran and its “Axis of Resistance” are said to activate all fronts. This could imply trying to close down the Bab al Mandab Strait as well. That’s the chokepoint between Yemen and the Arabian Peninsula which connects the Red Sea to the Gulf of Aden (Indian Ocean). Since late 2023, Iranian-backed Houthi rebels have been causing havoc in the area with missile and drone attacks on commercial vessels. Brent crude jumped to $96/b compared with last week’s closing level around $91. Apart from adding selling pressure on core bonds, the move supports the dollar (EUR/USD 1.1625) while weighing on general risk sentiment. Key European benchmarks currently lose 0.5% to 1% with US indices erasing gains in futures trading to open 0.25% weaker.
News & Views
Swiss GDP adjusted for sporting events grew by 0.4% q/q following growth of 0.2% in the previous quarter, marking a downward revision from the preliminary 0.5% reading. Details now included revealed the industrial sector – manufacturing in particular - being the powerhouse, with value added growing strongly by 1.3% after several quarters of subdued performance. Services sector (0.2%) momentum remained subdued. Transport and financial services drove positive contributions but were offset by the decline in the retail sector, accommodation and food services. In the expenditure-based approach, domestic final demand developed weakly overall (0.1%). Government consumption grew at an above-average rate (0.9%) but equipment investment fell (-0.2%). Imports fell by 2.4%, reflecting the weak performance of domestic demand, the State Secretariat for Economic Affairs said. The Swiss franc loses some ground today but in trading unrelated to the GDP numbers. EUR/CHF tested the 0.91 support at the open in a guarded environment before bouncing off to trade around 0.914 currently.
The Czech manufacturing PMI eased slightly from April’s 52.9 to 52.2 in May, indicating growth at an above-series average. The headline number was supported by lengthening supplier delays to the joint-longest in four years, which would ordinarily be a sign of greater customer demand but in this case represent the Middle East driven disruption. That said, the upturn also stemmed from greater new (export) orders supporting output levels. Input buying rose with companies building safety stocks and trying to get ahead of future price hikes. Indeed, material shortages and higher energy & transportation costs were key drivers of cost inflation, making operating expenses rise at the second fastest pace since June 2022. With demand reported as being resilient, this translated into output inflation at its sharpest rate since October 2022. Even though Czech companies were more confident on output in the coming 12 months (above the series’ long-term trend), cost-cutting initiatives still led to a further decline in employment levels. The job shedding pace was the quickest since November 2025. EUR/CZK trades unfazed around 24.28.
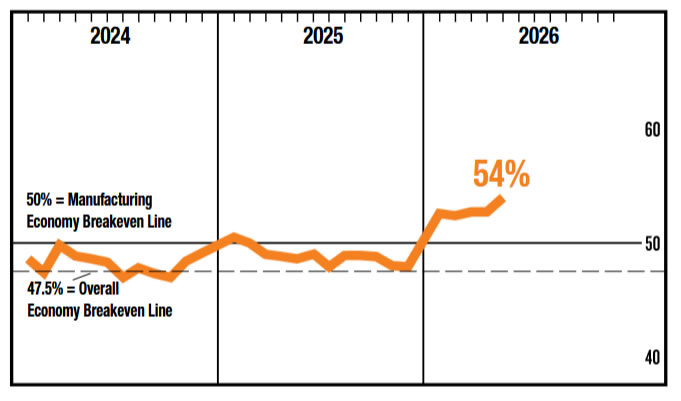
US ISM Manufacturing Hits Three-Year High as New Orders Surge
US manufacturing activity accelerated in May, with ISM Manufacturing PMI rising from 52.7 to 54.0, well above expectations of 52.6 and marking its highest level since May 2022. The report points to a broadening recovery across the sector, with only 2% of manufacturing GDP now in contraction, down dramatically from 19% in April. Historically, a PMI reading of 54.0 is consistent with annualized real GDP growth of roughly 2.2%, suggesting the broader economy continues to expand at a healthy pace.
The details of the report were equally encouraging. New orders jumped from 54.1 to 56.8, signaling stronger demand and indicating production pipelines should remain well supported in the months ahead. Production itself rose from 53.4 to 54.3, while the employment index improved from 46.4 to 48.6. Although hiring remains slightly below the expansion threshold, the improvement suggests manufacturers are becoming more confident about future activity.
Perhaps most importantly for markets, the prices paid index eased from 84.6 to 82.1. While still elevated, the decline offers some reassurance that cost pressures are not accelerating further despite ongoing concerns about energy prices and Middle East supply disruptions.
| Indicator | Previous | Latest |
|---|---|---|
| ISM Manufacturing PMI | 52.7 | 54.0 |
| New Orders | 54.1 | 56.8 |
| Production | 53.4 | 54.3 |
| Employment | 46.4 | 48.6 |
| Prices Paid | 84.6 | 82.1 |
| Manufacturing GDP in Contraction | 19% | 2% |
| Manufacturing GDP in Strong Contraction (PMI ≤45) | 2% | 2% |
| GDP Equivalent Signal | 2.2% annualized |
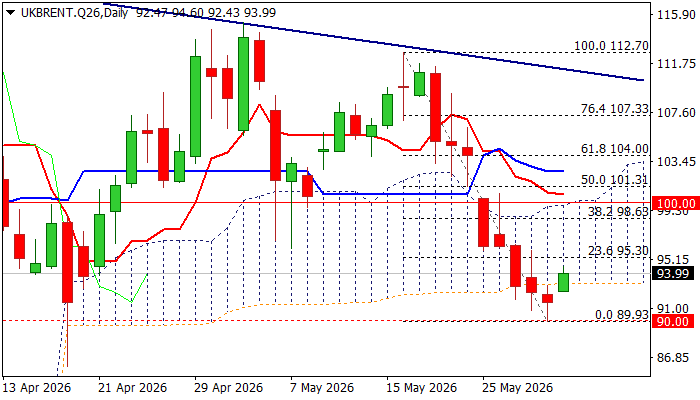
Brent Price Rises on Fresh Escalation in the Middle East
Brent oil price rose around 2% in early Monday trading (on track for the first daily gain after being eight days in red), following fresh escalation in the Middle East (escalation in Lebanon and fresh US attack on Iran and their subsequent response) that soured the sentiment.
Strongly oversold daily studies, following heavy losses in past two weeks (the contract price was down over 16% during this period) also contributed to fresh recovery attempt by prompting traders to collect profits.
Recent strong fall was contained by psychological $90 support, with return into daily Ichimoku cloud (spanned between $93.14 and $99.70) to possibly mark a false break below the cloud that would open space for further recovery.
Although the price action will be highly depending on developments on the ground, another fundamental factor that shows reducing demand for energy, due to weaker economic conditions (China and EU as the most significant), may counter recovery attempts.
Daily studies remain predominantly bearish, with initial resistance at $95.30 (Fibo 23.6% of $112.70/$89.93 bear-leg, reinforced by lower 20-d Bolinger band) being still intact and guarding more significant $98.63 (Fibo 38.2%, reinforced by falling 10DMA) and $99.70/$100 (cloud top / psychological).
These levels should cap extended upticks to keep larger bears in play and mark a healthy correction before bears regain control.
Sustained break through $99.70/$100 would weaken near-term structure and open way for stronger correction.
Res: 95.30; 96.09; 98.63; 99.70
Sup: 92.43; 90.00; 88.73; 86.08
Yen Braces for a New Storm
- USDJPY has returned to the area of previous interventions.
- The ECB is moving towards a rate hike in June.
The US dollar retreated on Friday amid new record highs for stock indices and rumours of amendments to the US-Iran agreement. However, tit-for-tat exchanges between the adversaries pushed the dollar index back into the support zone of the past two weeks, near 99. Investors welcomed the de-escalation in the Middle East, although they cannot fully count on peace, which kept the dollar steady but did not prevent shares from creeping higher.
Michelle Bowman of the Fed believes that resolving the conflict will eliminate supply disruptions. As a result, the oil crisis will have only a temporary impact on inflation and a minimal effect on economic activity. The futures market puts the odds of a Fed rate hike in 2026 at 50-50. The rhetoric outlined above suggests that the FOMC has not ruled out a return to rate cuts, which would weaken the dollar.
Isabel Schnabel of the ECB, on the other hand, argues that the bank cannot stand idly by in the face of an oil shock. The European Central Bank will have to respond, even if the conflict in the Middle East were to end right now. Markets have priced in an ECB rate hike in June, followed by one or two further moves by the end of the year. This divergence, coupled with falling demand for the US dollar as a safe-haven asset, is paving the way for EURUSD to head north, provided, of course, that the conflict in the Middle East comes to an end.
The dollar’s mixed performance is not deterring USDJPY bulls from testing the Japanese authorities’ resolve. The pair is approaching the psychologically important 160 mark, as asset managers and hedge funds have increased their net short positions in the yen to their highest levels since July 2024.
Japan has spent ¥11.7 trillion on currency interventions, equivalent to $74 billion. The figure exceeded the ¥10 trillion that the market expected. Meanwhile, Finance Minister Satsuki Katayama said the authorities are prepared to intervene again in pricing if volatility rises or speculation is detected. Investors are bracing for a new showdown with the Tokyo authorities.
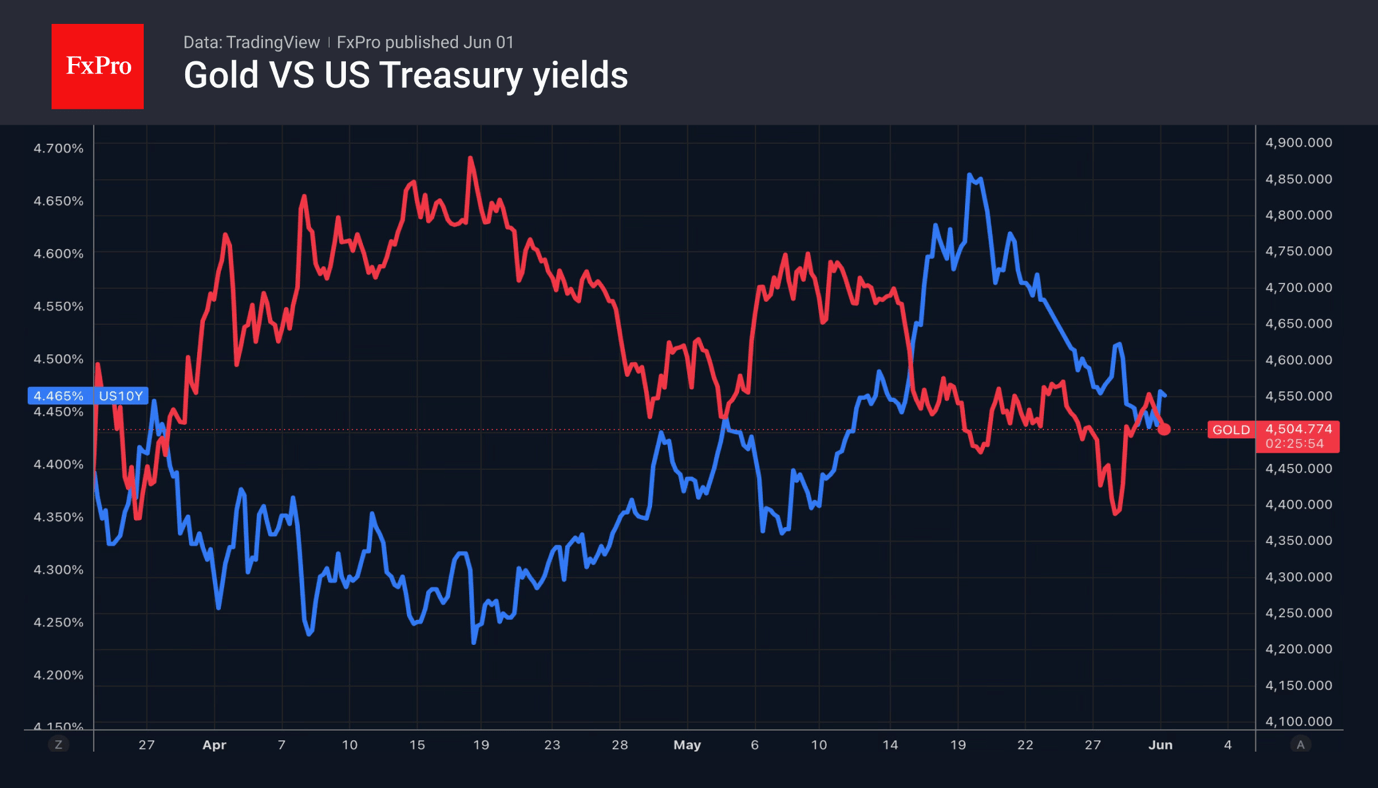
Gold retreated after a two-day rally. Deutsche Bank forecasts that the yield on 10-year Treasury bonds will rise to 4.7% by the end of the year, as the Fed keeps rates unchanged. This environment of a stable dollar and rising Treasury yields is unfavourable for the precious metal.
Trump Says “Relax”, Markets Appear To Be Listening Despite Ongoing Iran Tensions
For a market supposedly obsessed with geopolitics, investors appear remarkably calm. The proposed US-Iran agreement remains unsigned, key details are still unresolved, and military exchanges between the two sides continue. Yet financial markets are behaving as though a lasting settlement is only a matter of time. Oil remains well below recent highs, Treasury yields are contained, equity markets are stable, and there is little sign of the panic normally associated with renewed Middle East tensions.
The latest developments offer plenty of reasons for caution. U.S. Central Command said Iran fired two ballistic missiles overnight at American forces stationed in Kuwait, though both were intercepted without casualties. The attacks followed US "self-defense strikes" against Iranian radar and drone command facilities over the weekend.
Meanwhile, Iran has insisted that any agreement must include guarantees covering all fronts, including Lebanon. Foreign Minister Abbas Araghchi warned that any ceasefire violation by the US or Israel would be treated as a violation of the entire agreement. Despite these tensions, there is still no signed framework, and reports suggest negotiators have yet to finalize key aspects of the proposed deal.
Yet investors seem more focused on where negotiations are heading than on the latest military headlines. US President Donald Trump reiterated today that Iran "really wants to make a deal" and insisted that the eventual agreement would be beneficial for both the US and its allies. He also urged critics to stop second-guessing the process, concluding with the message: "Just sit back and relax, it will all work out well in the end." Markets appear willing to take him at his word for now.
That confidence is visible across asset classes. Brent crude has recovered briefly above USD 94 a barrel but continues to trace a lower-high, lower-low pattern that suggests traders are still unwinding the geopolitical premium built earlier this year. US 10-year Treasury yields have edged higher but remain below 4.5%, indicating that investors are not yet pricing a renewed inflation shock. European equities are mixed with modest gains in Germany and France, while US futures point to a firmer open.
Currency markets are equally restrained. Dollar is recovering some of last week's losses but lacks the momentum associated with a broader safe-haven rally. Sterling leads major currencies on the day, followed by Dollar and Euro. At the other end of the table, Kiwi is the weakest performer, followed by Swiss Franc and Canadian Dollar, while Aussie and Yen sit in the middle of the pack. The lack of aggressive defensive positioning suggests investors continue to view recent military incidents as negotiating noise rather than signs of a broader escalation.
The bigger challenge for markets may ultimately come from economics rather than geopolitics. This week brings a packed calendar featuring US ISM surveys, ADP employment, Eurozone inflation, Australian GDP, and Friday's highly anticipated payroll reports from both the US and Canada. Markets may be betting on peace, but the next major move in currencies, yields, and equities could still be determined by the data.
Japan Spent ¥11.7 Trillion Defending USD/JPY 160. Traders May Test It Again This Week
Japan spent ¥11.7 trillion defending the Yen when USD/JPY broke above 160 during Golden Week. A month later, the pair is already back near the same level. With the Nikkei above 67,000, AI-fueled risk appetite sweeping across Asia, and Friday's US payrolls report looming, traders may soon discover whether 160 is still Japan's red line—or merely a temporary speed bump. Read More.
Markets Face Twin Tests: US Jobs Data and an Unsigned Iran Deal
Markets begin the week facing two major uncertainties: whether the proposed US-Iran framework evolves into a formal agreement, and whether Friday's Non-Farm Payrolls report pushes the Fed closer to another rate hike. Investors have already priced a sharp decline in geopolitical risks, driving oil lower and equities higher, but the deal remains unsigned and key disputes are unresolved. With US jobs data, Eurozone inflation, Australian GDP, and Canadian employment all due this week, volatility across currencies, bonds, and commodities could quickly return. Read More.
ECB Survey Shows Inflation Expectations Stable but Growth Concerns Deepen
Eurozone consumers are becoming more pessimistic about growth, but they are not yet convinced inflation will fade quickly. The ECB's latest survey showed one-year inflation expectations holding at 4.0% while economic growth expectations weakened further. With uncertainty about future prices still elevated, the results reinforce the difficult balancing act facing ECB policymakers ahead of their next rate decision. Read More.
ECB's Schnabel Strengthens Case for June Hike as Inflation Expectations Risk Becoming Unanchored
The ECB's inflation fight may be entering a new phase. Schnabel warned that higher energy costs are now spreading through global supply chains and lifting producer prices worldwide, creating inflation risks that can no longer be ignored. Her comments reinforce expectations for a June hike while keeping markets alert to the possibility of further tightening. Read More.
Eurozone PMI Manufacturing at 51.6, Growth Slows as Middle East Inflation Pressures Build
The latest Eurozone PMI report suggests inflation is returning as a bigger concern just as growth begins to lose momentum. Manufacturers are raising prices to offset surging costs, but customers are becoming more cautious, causing order growth to stall after several months of improvement. Read More.
UK PMI Manufacturing at 53.9, Expansion Extends to Seven Months, but Sustainability Questioned
Britain's manufacturing sector is expanding, but not necessarily for the reasons policymakers would like. Businesses are bringing forward orders to protect themselves against rising costs and potential supply shortages, creating a temporary boost that may fade once inventories are fully stocked. Read More.
Swiss Q1 GDP Beats Expectations as Manufacturing Drives Growth
Switzerland's economy delivered a stronger-than-expected start to 2026, with GDP growth accelerating sharply thanks to a rebound in manufacturing and industrial activity. But beneath the headline strength, domestic demand remained weak, consumer spending stagnated, and investment declined. The result is an economy growing faster than expected, yet still lacking broad-based momentum. Read More.
Japan Manufacturing PMI Finalized at 54.1, Strong Growth Despite Rising Cost Pressures
Japan's PMI data painted a tale of two trends in May. Manufacturing growth remained robust thanks to strong demand from AI and electronics sectors, yet businesses also rushed to stockpile goods amid geopolitical uncertainty. Combined with surging input costs and cautious business sentiment, the report suggests today's strength may be masking challenges further down the road. Read More.
China PMIs Signal Slower Growth as Export Demand Weakens
China's latest PMI reports revealed a widening gap between domestic and external demand. Manufacturing activity slowed as export orders fell back into contraction, while services benefited from stronger holiday spending. With both official and private surveys pointing to softer foreign demand, the data suggest China's growth outlook is becoming increasingly dependent on domestic consumption rather than exports. Read More.
USD/CAD Daily Outlook
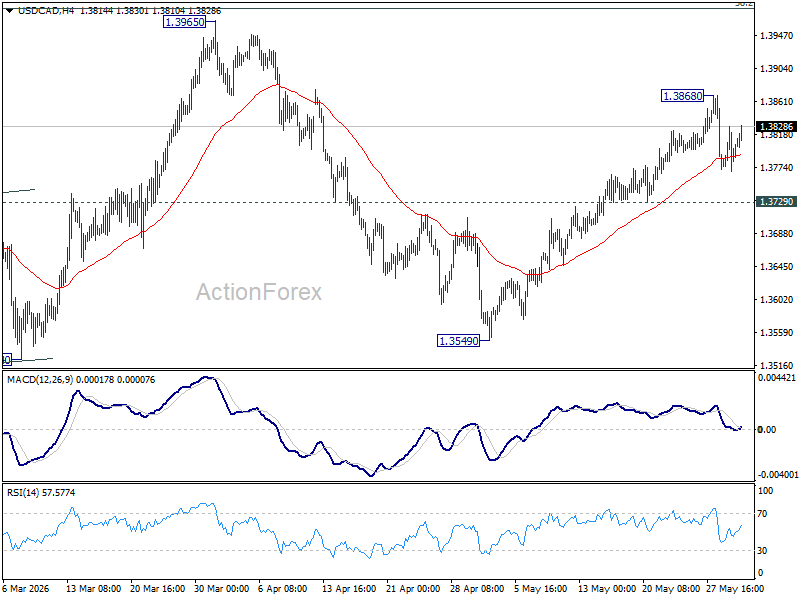
USD/CAD recovered after hitting 55 4H EMA but stays below 1.3868 resistance. Intraday bias remains neutral first. Rise from 1.3549 is seen as the third leg of the pattern from 1.3480. Above 1.3868 will target 1.3965 resistance next. Break of 1.3729 will suggest that the rebound has completed, and turn bias back to the downside.
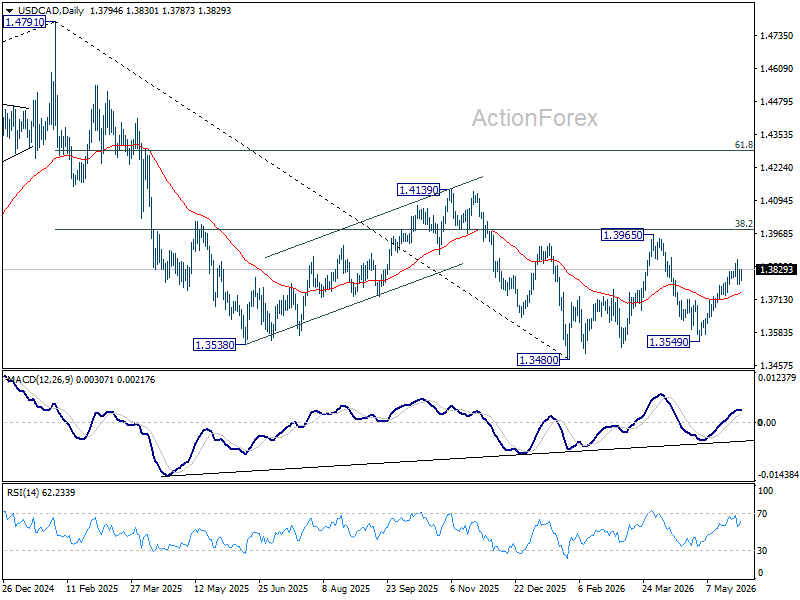
In the bigger picture, price actions from 1.4791 are seen as a corrective pattern to the whole up trend from 1.2005 (2021 low). Deeper fall could be seen, as the pattern extends, to 61.8% retracement of 1.2005 to 1.4791 at 1.3069. However, decisive break of 38.2% retracement of 1.4791 to 1.3480 at 1.3981 will argue that the correction has completed with three waves down to 1.3480 already.
EUR/USD Daily Outlook
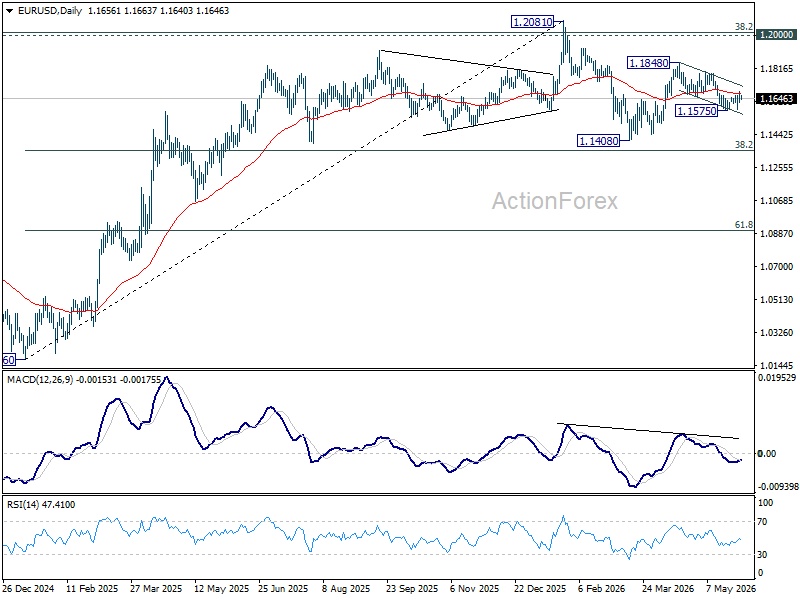
Intraday bias in EUR/USD stays mildly on the upside at this point. Fall from 1.1848 could have completed as a three wave-correction at 1.1575/ Further rise would be seen to 1.1795 resistance. However, firm break of 1.1575 will extend the decline to retest 1.1408 low instead.
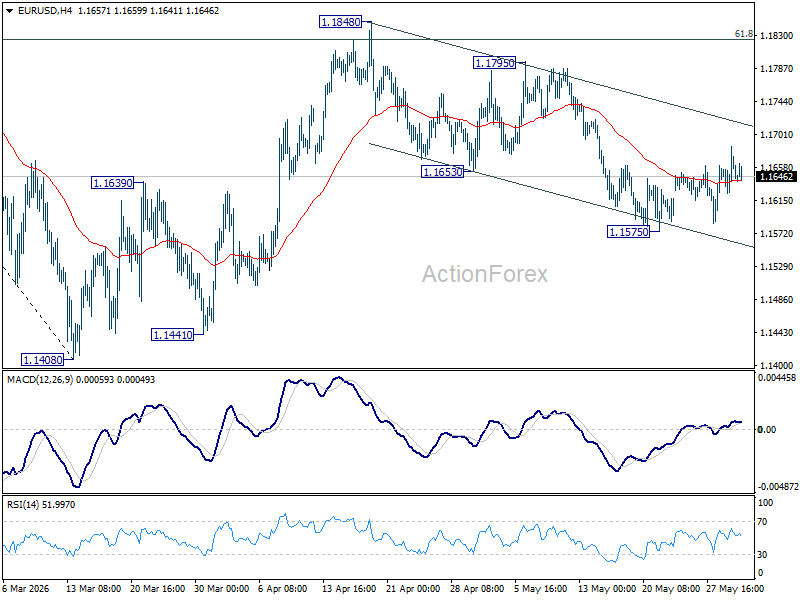
In the bigger picture, the strong support from 38.2% retracement of 1.0176 to 1.2081 at 1.1353 suggests that the pullback from 1.2081 is more likely a corrective move. Strong support was also found in 55 W EMA (now at 1.1542). Focus is back on 1.2 key cluster resistance level. Decisive break there will carry long term bullish implications. Nevertheless, break of 1.1408 support will revive the case of medium term bearish trend reversal.
USD/JPY Daily Outlook
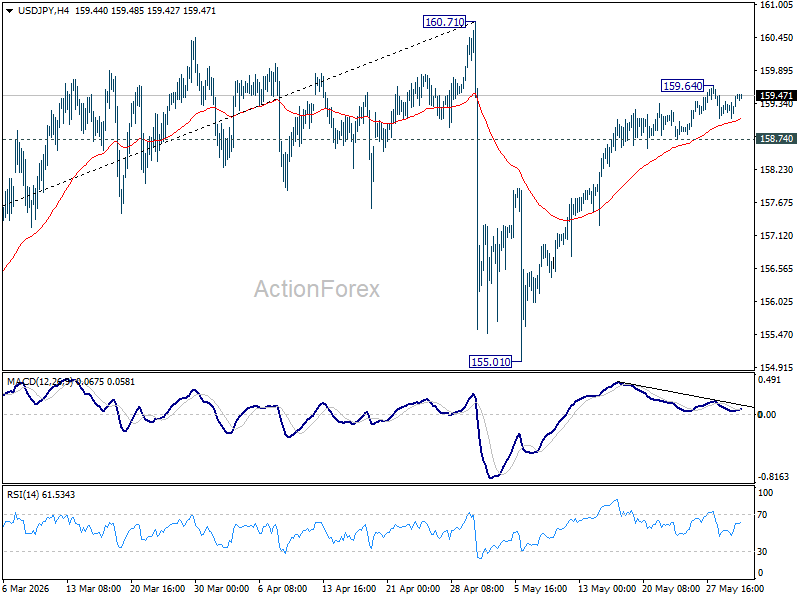
Intraday bias in USD/JPY remains neutral for the moment. Rise from 155.01 is seen as the second leg of the corrective pattern from 160.71. While another rally cannot be ruled out, strong resistance should be seen from 160.71 to bring reversal. Considering bearish divergence condition in 4H MACD, firm break of 158.74 support will argue that the rise from 155.01 has completed already. Intraday bias will be back on the downside for 55 D EMA (now at 158.40) and below.
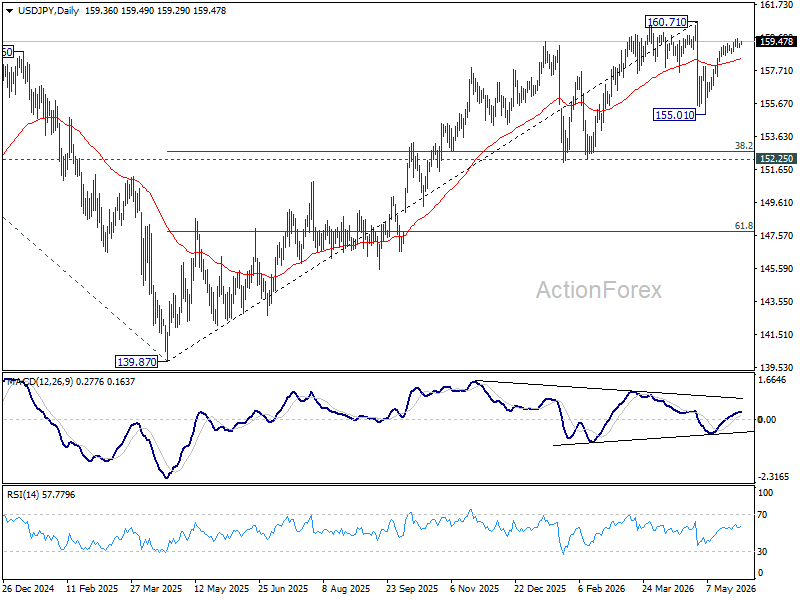
In the bigger picture, for now, corrective pattern from 161.94 (2024 high) is still seen as completed at 139.87. Rise from there is seen as resuming the long term up trend. So, break of 161.94 is expected at a later stage to resume the long term up trend. However, sustained break of 55 W EMA (now at 154.55) will dampen this view and bring deeper fall back towards 139.87 to extend the pattern from 161.94.
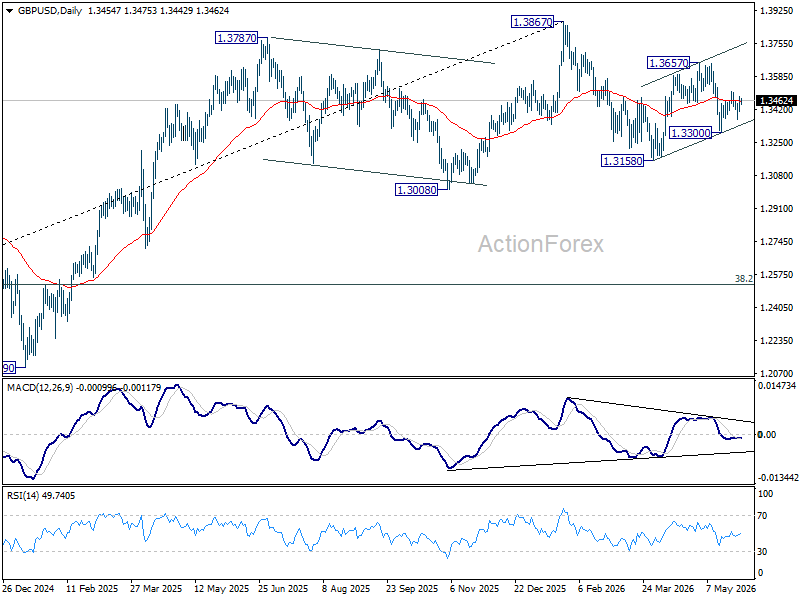
GBP/USD Daily Outlook
Intraday bias in GBP/USD stays neutral as range trading continues. On the upside, above 1.3508 will extend the rebound from 1.3300 to 1.3657 resistance first. On the downside, below 1.3300 will bring deeper fall back to 1.3158 support instead.
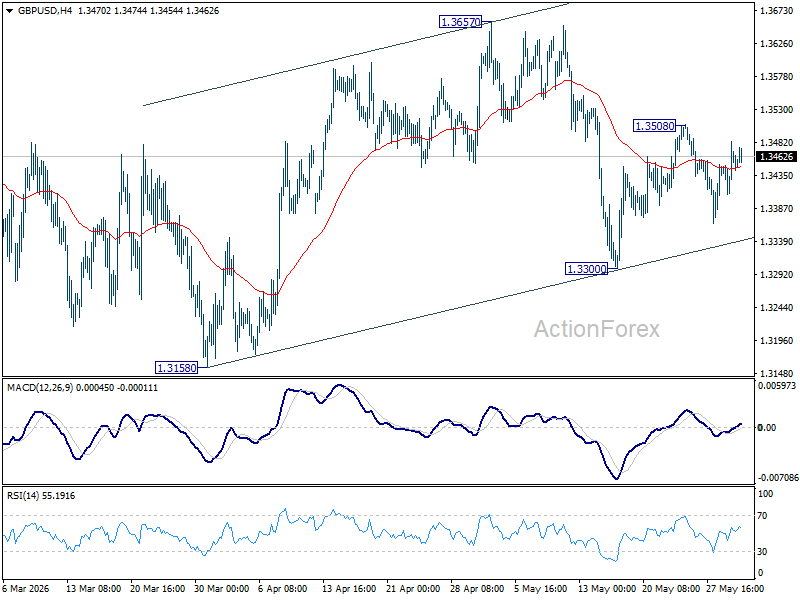
In the bigger picture, price actions from 1.3867 are a corrective pattern within the broader up trend from 1.0351 (2022 low). With 1.3008 support intact, medium term bullishness is maintained and break of 1.3867 is in favor for a later stage, towards 1.4248 key resistance (2021 high). However, firm break of 1.3008 will at least bring deeper fall to 38.2% retracement of 1.0351 to 1.3867 at 1.2524, with increased risk of bearish reversal.
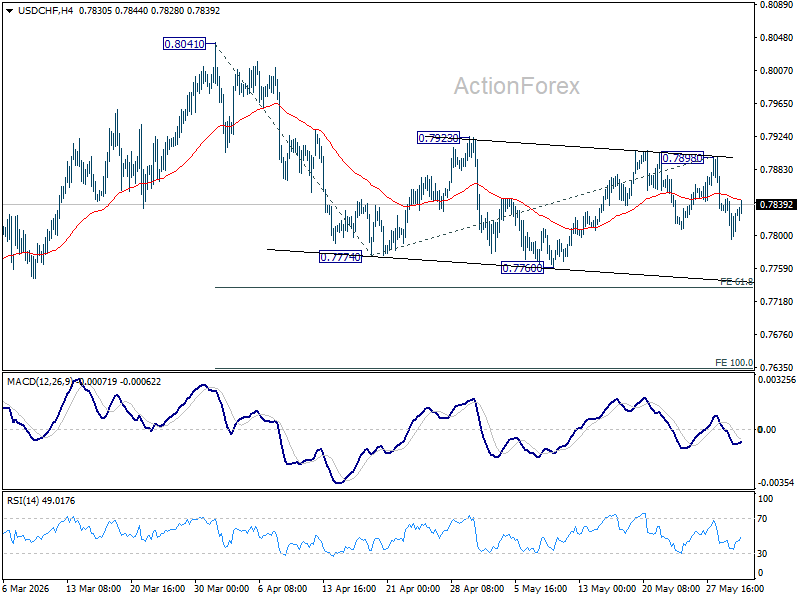
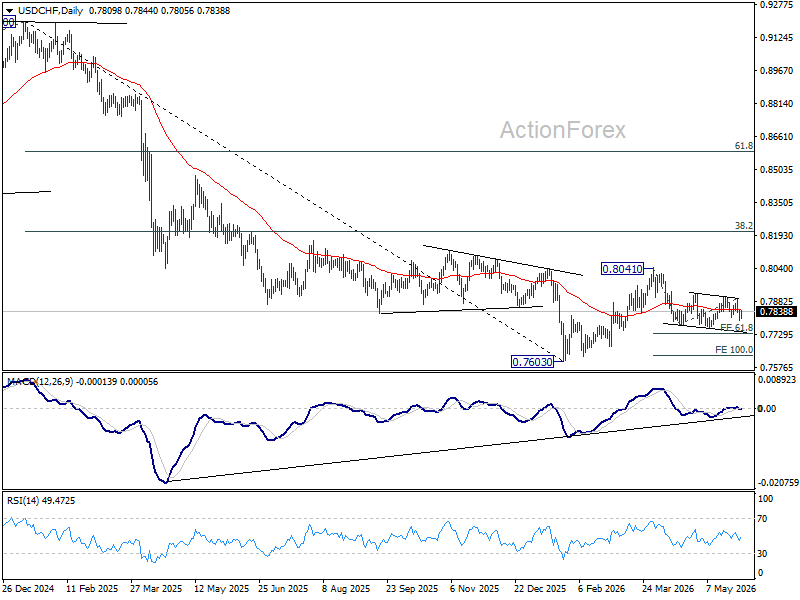
USD/CHF Daily Outlook
Intraday bias in USD/CHF is turned neutral again with current recovery. Risk is mildly on the downside as long as 0.7898 resistance holds. Break of 0.7760 will confirm resumption of the whole fall from 0.8041, and target 61.8% projection of 0.8041 to 0.7774 from 0.7898 at 0.7733.
In the bigger picture, as long as 55 W EMA (now at 0.8028) holds, fall from 0.9200 is expected to continue, as part of the larger down trend. Firm break of 0.7603 will target 100% projection of 1.0146 (2022 high) to 0.8332 from 0.9200 at 0.7382.
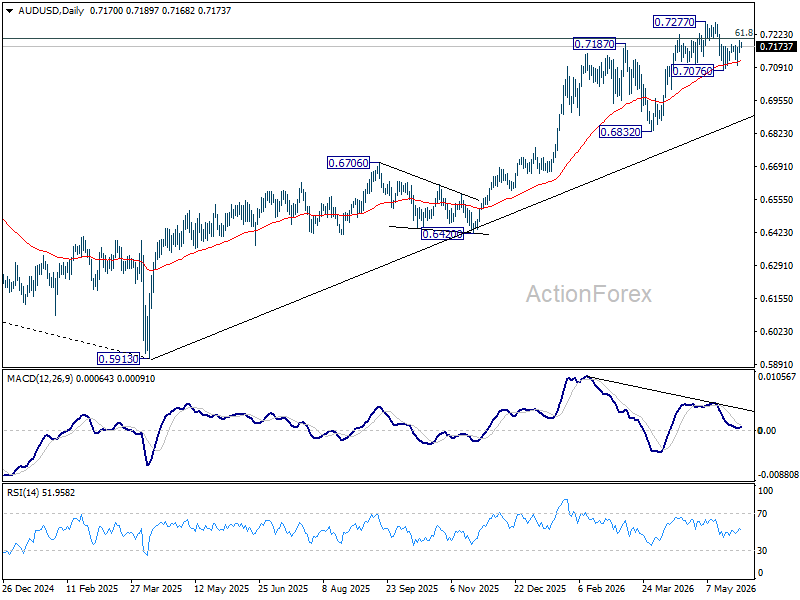
AUD/USD Daily Report
Intraday bias in AUD/USD stays mildly on the upside for the moment. Rebound from 0.7076 should extend to retest 0.7277 high first. Firm break there will resume larger up trend. For now, risk will stay on the upside as long as 0.7076 support holds, in case of retreat.
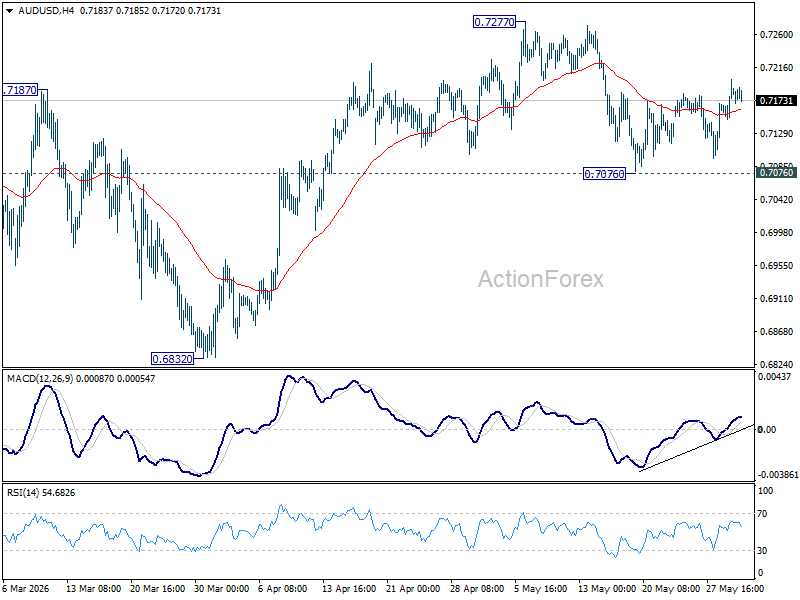
In the bigger picture, rise from 0.5913 (2024 low) is still in progress. Decisive break of 61.8% retracement of 0.8006 to 0.5913 at 0.7206 will solidify the case that it's already reversing the down trend from 0.8006 (2021 high). Further rally should then be seen to retest 0.8006. For now, outlook will remain bullish as long as 0.6832 support holds, in case of pullback.