
Sample Category Title
Market Heard Japan’s Intervention Warning. But USD/JPY 160 Test Still Alive.
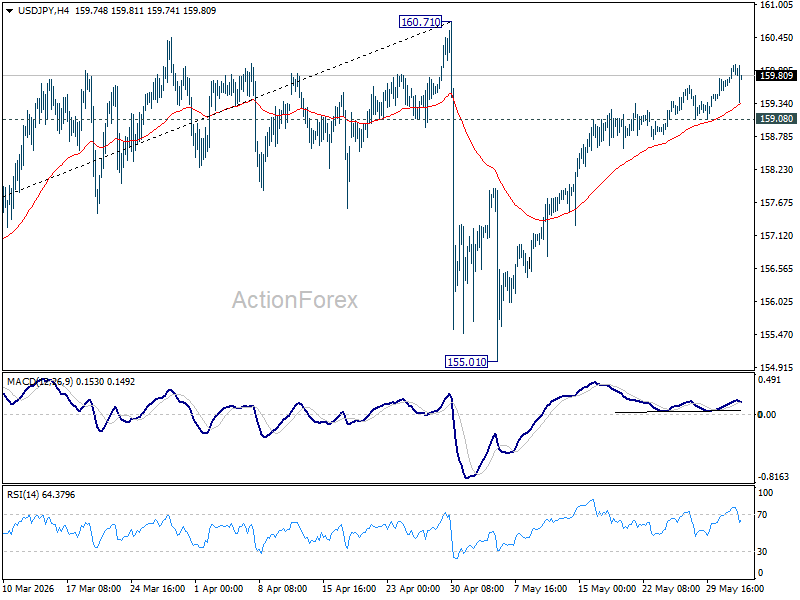
The Japanese Yen bounced slightly briefly after fresh intervention warnings from Tokyo, but the market's overall message appears unchanged: traders are still eyeing another test of the 160 level. After USD/JPY flirted with the intervention red line earlier in the day, comments from Prime Minister Sanae Takaichi and Finance Minister Satsuki Katayama helped trigger a modest pullback.
Takaichi warned that "speculative trading that is not based on real demand is having a big impact on the currency market," while authorities reiterated their readiness to respond to excessive moves.
Yet the reaction was notably limited. USD/JPY remains comfortably above minor support at 159.08, suggesting traders are not rushing to abandon bullish Dollar positions.
In many ways, this reflects the broader problem facing Japan. Markets already expect the Bank of Japan to raise rates later this month, but a single 25 basis point increase is unlikely to significantly alter the interest-rate gap between Japan and other major economies. More important is whether the BoJ can provide a convincing roadmap for further normalization, something policymakers have yet to clearly deliver.
There was at least one encouraging signal for Yen bulls. Katayama said she is largely aligned with BoJ Governor Kazuo Ueda and noted that Ueda and Takaichi recently held "very constructive discussions." That may ease concerns that the government and central bank are working at cross purposes.
Even so, the next major test is likely to come from outside Japan. Friday's US non-farm payrolls report could determine whether traders have sufficient fundamental justification to challenge 160 again.
A strong payrolls reading would likely reinforce higher-for-longer Fed expectations, support Treasury yields, and strengthen the Dollar broadly. Under that scenario, traders may feel emboldened to push USD/JPY back toward 160 and beyond.
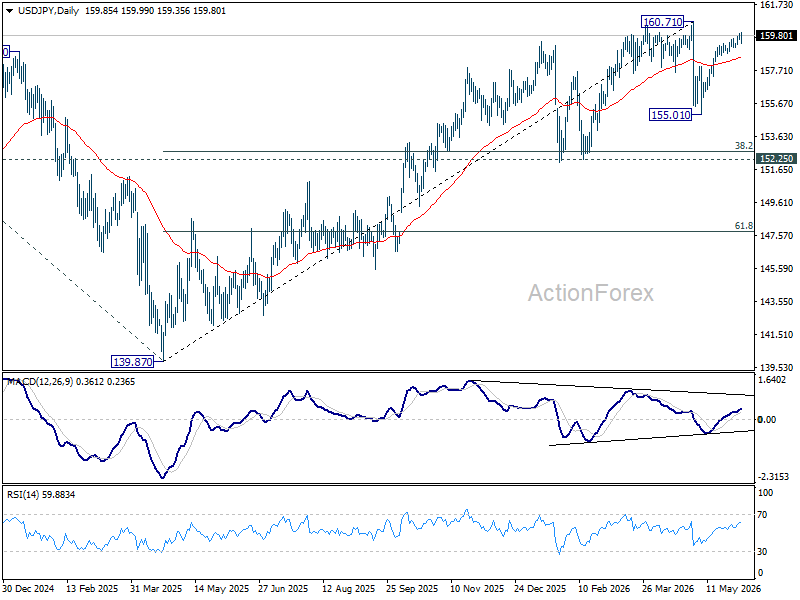
Technically, 160.71 remains the key resistance level to watch. Meanwhile, firm break of 159.08 support will be a strong sign of short term topping. USD/JPY will likely fall through 55 D EMA (now at 158.46) to extend recent sideway trading with another falling leg.
EUR/USD on Edge as Markets Await Key Employment Data
EUR/USD remained under pressure on Wednesday, holding at 1.1629. The US dollar continues to draw support from difficulties in negotiations between the US and Iran, as well as a renewed escalation of tensions in the Middle East, which has increased demand for safe-haven assets.
According to the US Central Command, Iran launched ballistic missiles towards neighbouring states. In response, US forces carried out strikes on targets on Qeshm Island following alleged attacks linked to Tehran.
The ongoing conflict has kept energy prices elevated, fuelling concerns about inflation and reinforcing expectations that interest rates may remain higher for longer than previously anticipated.
Additional support for the dollar came from US labour market data. Figures released on Tuesday showed that job openings rose to their highest level in nearly two years in April, while layoffs declined. The data highlighted the resilience of the US economy despite ongoing geopolitical and economic uncertainties.
Investor attention is now turning to the ADP report, which may provide further insight into labour market conditions.
However, the key event of the week remains Friday’s Non-Farm Payrolls report, which could offer important clues regarding the Federal Reserve’s next policy steps.
Technical Analysis
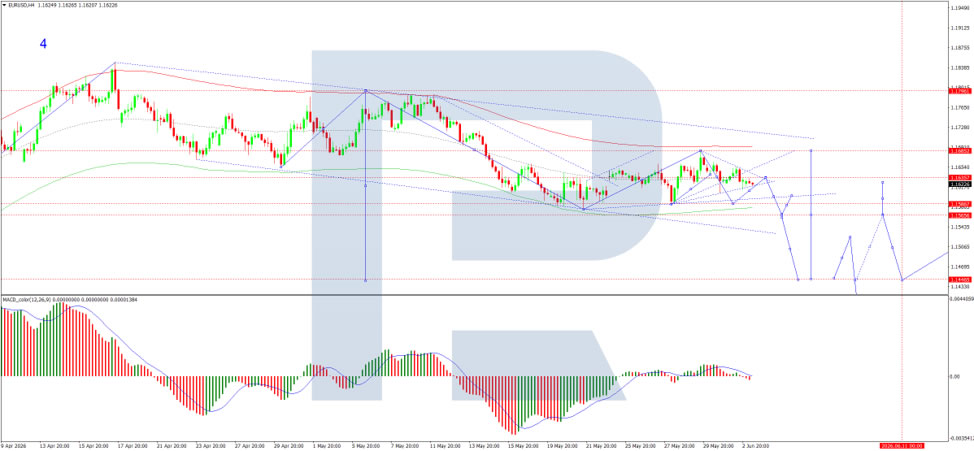
On the H4 EUR/USD chart, the pair is trading within a consolidation range around 1.1635, currently extending between 1.1605 and 1.1654. A move lower towards 1.1585 is likely. The MACD indicator supports this scenario, with its signal line below zero and pointing firmly downwards, reflecting
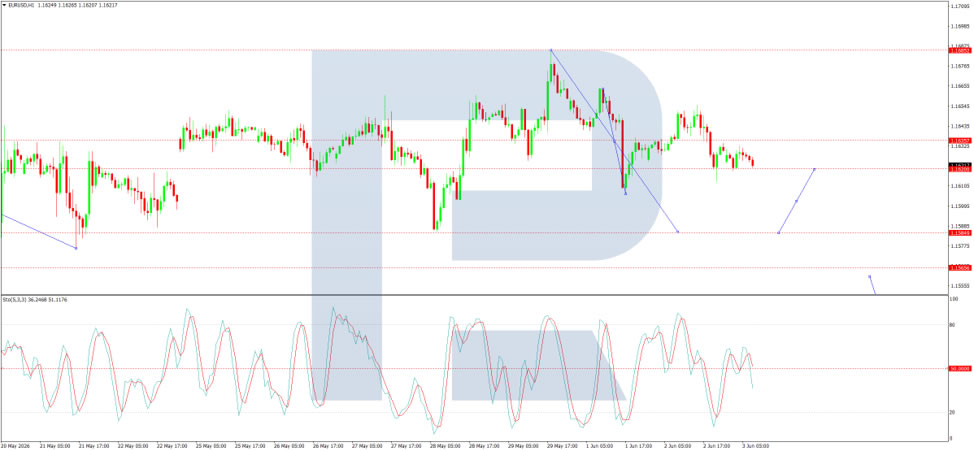
On the H1 chart, EUR/USD has reached 1.1655 and is now moving lower towards 1.1585. A corrective rebound to 1.1636 may follow, before a further decline towards 1.1555. The Stochastic oscillator confirms this outlook, with its signal line around the 50 level and pointing downwards towards 20.
Conclusion
EUR/USD remains under pressure as geopolitical tensions and strong US labour market data continue to support the dollar. With the ADP report and Friday’s Non-Farm Payrolls release approaching, traders are likely to remain cautious. At the same time, technical indicators suggest a bias towards further short-term weakness in the pair.
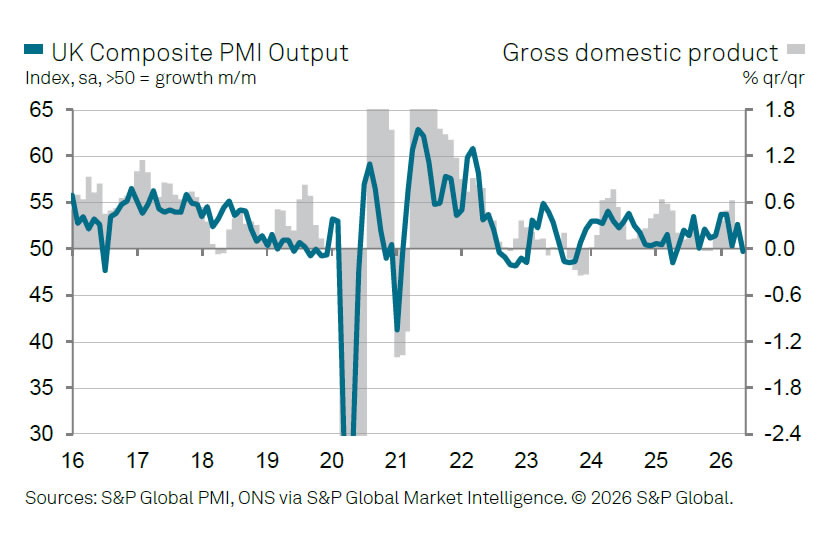
UK Services PMI Finalized Below 50 as Inflation and Geopolitics Hurt Confidence
UK service-sector activity slipped into contraction in May for the first time in more than a year, highlighting the growing economic impact of elevated inflation and geopolitical uncertainty. PMI Services (final) fell sharply from 52.7 to 49.3, while PMI Composite dropped from 52.6 to 49.7, marking the first contraction in overall private-sector activity in 13 months and the weakest reading since April 2025.
According to S&P Global's Tim Moore, subdued business and consumer demand across both domestic and overseas markets weighed heavily on activity. Many firms cited the Middle East conflict as a direct drag on sales pipelines and business prospects. Hospitality and transportation companies reported weaker discretionary spending and sharply rising operating costs, while professional services firms pointed to growing client caution and risk aversion. One notable exception remained technology-related investment spending, which continued to support parts of the services economy.
The survey also highlighted persistent inflation concerns. Moore noted that higher fuel and transportation costs continued to drive strong input-price pressures, with inflation running at levels not seen since the 2022 energy crisis. At the same time, business confidence deteriorated further, falling to its lowest level since the US tariff-related slowdown in April 2025.
| Indicator | April | May | Notes |
|---|---|---|---|
| PMI Services | 52.7 | 49.3 | First contraction since Apr 2025 |
| PMI Composite | 52.6 | 49.7 | First contraction in 13 months |
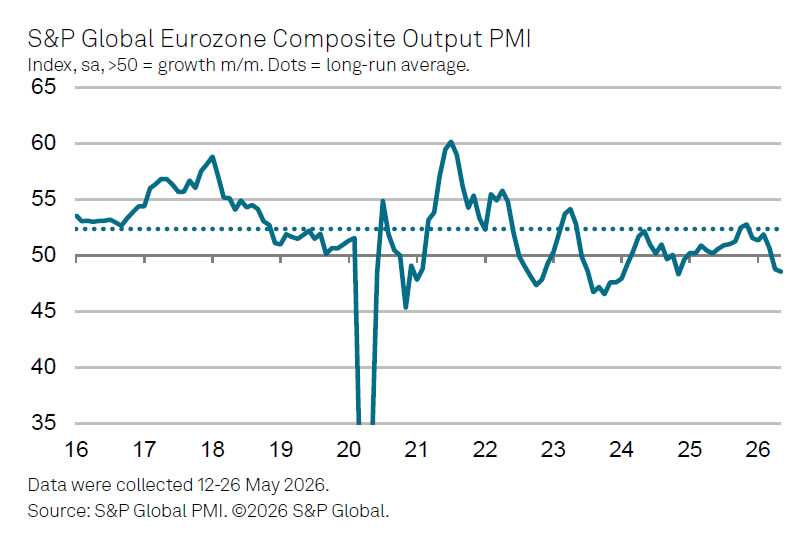
Eurozone PMI Composite Signals 4% Inflation and GDP Contraction. ECB Faces Tough Choice.
Eurozone business activity deteriorated further in May, adding to concerns that the region could slip into contraction in the second quarter. The final Composite PMI Output Index fell from 48.8 to 48.5, its lowest level in 18 months. PMI Services edged up slightly from 47.6 to 47.7. Although the services reading improved marginally, both indicators remained firmly below the 50 threshold that separates expansion from contraction.
According to S&P Global's Chris Williamson, the latest survey data point to a worsening growth outlook. He said the PMI figures are consistent with a -0.2% quarterly decline in GDP unless activity improves significantly in June. At the same time, inflation pressures are moving in the opposite direction. Williamson warned that price pressures have intensified to their most concerning levels in more than three years, with inflation potentially running close to 4% in the coming months.
The combination leaves the ECB facing an increasingly uncomfortable policy dilemma. On one hand, rising inflation and recent upside surprises in core CPI strengthen the case for next week's widely expected rate hike. On the other, weakening business activity suggests the economy is already losing momentum. Williamson argued that one rate increase could be viewed as an "insurance policy" against inflation becoming entrenched, but warned that the case for additional tightening will become harder to justify if demand continues to weaken.
| Indicator | April | May | Notes |
|---|---|---|---|
| PMI Composite | 48.8 | 48.5 | 18-month low |
| PMI Services | 47.6 | 47.7 | 2-month high |
| GDP Signal (Q2) | -0.2% | PMI-implied estimate | |
| Inflation Signal | Near 4% | PMI price indicators |
Gold: Attempt to Break Out of the Short-Term Trend
Fundamental backdrop
In April, US inflation stood at 3.8% year-on-year — the highest level since May 2023. A significant contribution came from rising fuel prices amid escalating tensions in the Middle East. Market reaction was somewhat paradoxical: instead of inflows into safe-haven assets, the strong CPI print triggered a reassessment of Federal Reserve monetary policy. Expectations of a possible rate hike by the end of the year appear to have strengthened the US dollar and weighed on gold.
By the end of May, the precious metal had lost more than 4% and is currently trading roughly 20% below its January record high. Markets are now awaiting labour market data and comments from Federal Reserve officials as key guidance for the next reassessment of monetary expectations.
Technical picture
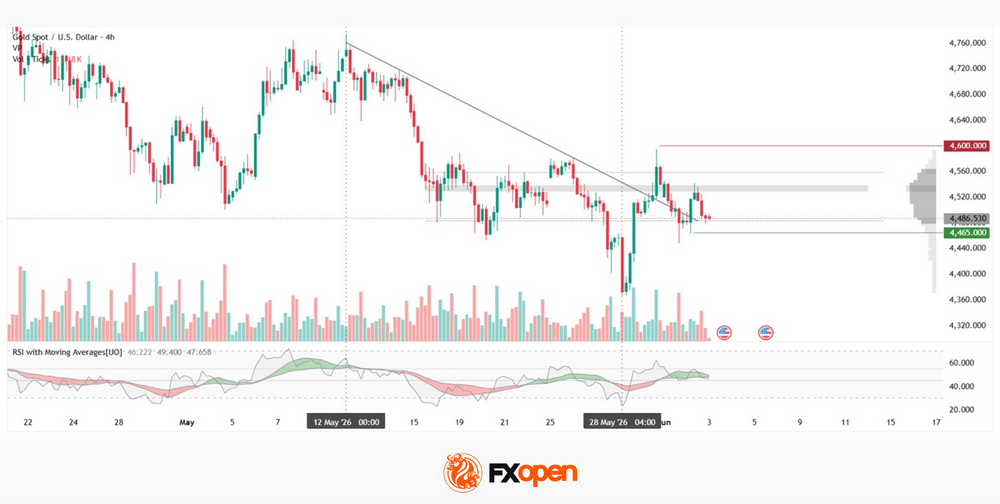
On the four-hour chart of Gold (XAUUSD on FXOpen), a short-term bearish trend can be identified: starting on 12 May and ending in a phase of acceleration on 28 May. The trendline is drawn across consecutively lower highs and is clearly defined. Following the 28 May impulse, price reversed sharply and attempted to break above the trendline. However, it has not yet managed to hold above it — the move may be viewed as an incomplete retest of trend strength, with the final outcome still undecided.
The horizontal volume profile defines the current working range, with the upper boundary located around 4,560 and the lower boundary at 4,485. The point of control (POC) is concentrated between 4,533 and 4,535. At present, price is testing the lower boundary of the profile — if this support is lost, attention could shift towards the 4,465 area, where a key support level is located. The 4,600 area could also attract interest if the upward move continues.
RSI + MAs shows readings of 46, 49 and 47 — the oscillator remains in neutral territory but is poised for a potential new impulse.
Key takeaways
Further gold price dynamics will largely depend on US labour market data and Federal Reserve rhetoric: confirmation of expectations for higher rates could increase pressure on the asset. The technical picture remains mixed — the attempted breakout above the descending trendline has not been confirmed, while RSI does not provide a clear directional advantage for either side.
Start trading commodity CFDs with tight spreads (additional fees may apply). Open your trading account now or learn more about trading commodity CFDs with FXOpen.
This article represents the opinion of the Companies operating under the FXOpen brand only. It is not to be construed as an offer, solicitation, or recommendation with respect to products and services provided by the Companies operating under the FXOpen brand, nor is it to be considered financial advice.
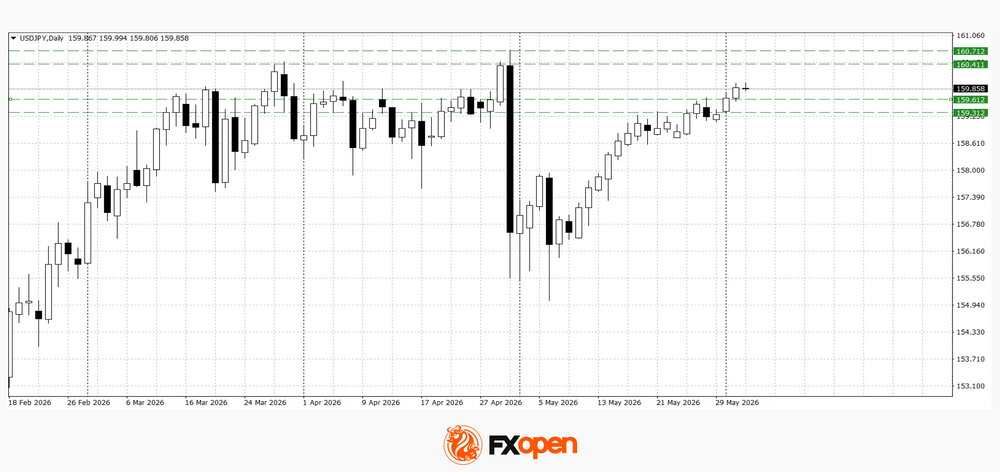
USD/JPY and USD/CAD Test Key Levels Ahead of the ADP Employment Report
The US dollar is holding on to its recently gained ground following a series of strong macroeconomic releases and a rise in US Treasury yields. Additional support for the greenback comes from resilient inflation readings, expectations that the Federal Reserve will maintain a restrictive policy stance, and cautious investor sentiment ahead of the release of the preliminary ADP employment report. At the same time, market participants continue to monitor oil price dynamics and other economic indicators that could alter perceptions of the health of the US economy.
Despite continued demand for the dollar, the next directional move remains uncertain. Both USD/JPY and USD/CAD have reached important technical resistance levels, where either profit-taking and a local correction may emerge, or a fresh bullish impulse could develop if US labour market data come in stronger than expected.
USD/JPY
USD/JPY continues its upward move and has approached a strategic resistance zone near the highs of recent months. Following the recovery from April lows, buyers have almost fully reversed the previous decline; however, price has now entered an area where selling pressure has previously intensified.
Technical analysis of USD/JPY suggests the possibility of a test of the nearest resistance levels at 160.40–160.70. Should the pair establish itself below the 159.30–159.60 range, a broader downward correction may begin.
Key events for USD/JPY:
- today at 11:30 (GMT+3): speech by Bank of Japan Governor Kazuo Ueda;
- today at 15:15 (GMT+3): US ADP Non-Farm Employment Change;
- today at 16:00 (GMT+3): speech by Federal Reserve Vice Chair for Supervision Michael S. Barr.
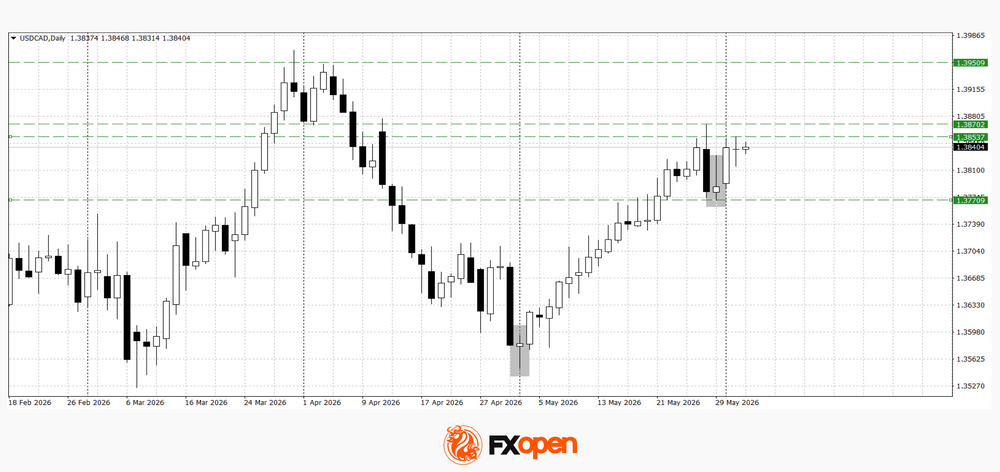
USD/CAD
USD/CAD has recovered following a corrective decline towards 1.3770. Technical analysis of USD/CAD points to the possibility of a renewed test of the 1.3850–1.3870 area, as a series of bullish candlestick formations has developed on the daily timeframe. The bullish scenario would come into question if the pair were to establish itself decisively below 1.3770.
Key events for USD/CAD:
- today at 15:30 (GMT+3): Canadian labour productivity data;
- today at 17:00 (GMT+3): US ISM Services Purchasing Managers' Index (PMI);
- today at 17:30 (GMT+3): US crude oil inventories.
Key takeaways
The dollar retains an advantage ahead of the release of preliminary US employment data; however, both USD/JPY and USD/CAD are already trading close to important technical resistance levels. The next directional move will depend on whether the incoming data can confirm the resilience of the US economy. Strong figures could provide the basis for a continuation of dollar strength and a test of fresh highs, while weaker-than-expected results may trigger a correction following the recent appreciation of the US currency.
Trade over 50 forex markets 24 hours a day with FXOpen. Take advantage of low commissions, deep liquidity, and spreads from 0.0 pips (additional fees may apply). Open your FXOpen account now or learn more about trading forex with FXOpen.
This article represents the opinion of the Companies operating under the FXOpen brand only. It is not to be construed as an offer, solicitation, or recommendation with respect to products and services provided by the Companies operating under the FXOpen brand, nor is it to be considered financial advice.
Sunrise Market Commentary
Markets
“At some point, we cannot let the market do all the lifting. We need to take a stance.” Belgian ECB governor Wunsch in an interview with the Financial Times joined Schnabel in clearly signalling a rate hike at the upcoming June 11 policy meeting. He said that any peace deal confirmed shortly before the meeting would make the hiking case only a bit less strong, not derail it, because it’s impossible to tell whether it will last or be credible enough. Such an agreement, by the way, seems unlikely in the short run with renewed skirmishes in the last couple of hours. Iran targeted multiple US sites in Kuwait and Bahrain in retaliation for American forces striking a tanker that was headed to Iranian ports. That in turn prompted a US response on Qeshm island, Iran’s oil nerve center. Brent oil prices’ recent recovery extends into a third day with one barrel currently trading for $97.5. Wunsch was already “slightly in favour of hiking” at the April meeting. His comments came after European inflation yesterday accelerated from 3% in April to 3.2%, the highest since September 2023. Underlying gauges including core CPI quickened to an above-consensus 2.5%. Services inflation rallied to 3.5% from 3%, the joint-highest in a year. Euro area money markets are now fully convinced of a rate increase to happen next week with a follow-up hike priced in for September. European yields yesterday finished up to 2.8 bps lower. They recovered a large part of the drop at the open which was triggered by US President Trump trying to downplay Iran’s suspension of the talks. US yields showed similar intraday movement, supported by a sharp jump in April job openings to a 2-year high. Net daily changes were <1.5 bps. EUR/USD closed at opening levels of 1.163, EUR/GBP fell for a second day towards 0.8638 – both in uninspired trading. USD/JPY meanwhile hit the 160 barrier in trading this morning. Japanese officials probably have their finger at the trigger. Renewed JPY weakness comes as the finance minister announced an extra budget to Middle East conflict impact.
Accompanying the overnight geopolitical news flow, are the new US trade tariffs that have been announced by the Office of the US Trade Representative (see below). They more or less match the 10% that is currently in place but which expires in July, meaning it may not change that much in practice. Private credit is also returning to the fore with two funds capping withdrawals in the last couple of hours. Overall market sentiment remains mildly positive still, with most Asian indices trading in the green. European exchanges are readying for a slightly lower open though. The economic calendar today features the US ADP job report and the May services ISM. Solid readings are likely to add further to already growing Fed rate hike bets and may keep US yields and the dollar upwardly oriented. The Fed releases its Beige Book as the kickstarter to its policy meeting cycle. A slew of ECB and Fed speeches are scheduled.
News & Views
Australian GDP growth slowed from a stellar 0.9% Q/Q-pace in the Dec 2025 quarter to 0.3% Q/Q in the March 2026 quarter (vs 0.4% consensus estimate). Y/Y-growth was unchanged at 2.5%. Modest household and public sector expenditure as well as cyclone disruptions to mining and export activities explain the growth slowdown. The demand-side breakdown showed household spending rising by 0.5% Q/Q. Rising interest rates and significantly higher fuel costs in the March month created an environment for more cautious consumer behavior. A halving of the fuel excise could provide some relief in the June quarter. Government consumption fell by 0.2% Q/Q, the lowest since Sept 2022. Private business investment rose by 6% with the largest rise in 30 years in machinery & equipment (+16.3%) on the back of an expansion of data centers. The contribution of investment to GDP growth was moderated though as most of this equipment was imported. Net exports was the biggest drag on growth, detracting 0.8% percentage points. Exports fell by 1.1% Q/Q, the largest quarterly decline in two years, as weather disruptions impacted key industries.
The office of the US trade representative released its findings in Section 301 investigations relating to failures to take action on trade in forced labor goods. The investigation is one of the side-tracks to replace tariffs previously shut down by the US Supreme Court and currently being replaced by a temporary levy. The USTR proposes action in 60 cases: 10% (the EU, Mexico, Canada, Ecuador, Indonesia and Pakistan) or 12.5% (other 54) depending on whether economies impose prohibitions on forced labor imports (or have committed doing so) or not. The levies are subject to a public comment and review period before implementation.
US Prepares to Extend Tariffs
In focus today
In the US, ADP's private sector employment growth will be released for May. ADP's weekly estimates have pointed towards another solid month of job creation. ISM Services Index is also due for release. The earlier flash PMI pointed towards a small uptick in business activity growth.
In the euro area, the final PMI data for May is due. The final manufacturing print was marginally higher than the flash release, so we expect the composite index to also be close to the flash estimate of 47.5, with services at 46.4.
In Sweden, the May services PMI will be published. The series is volatile, so individual observations should be taken with a pinch of salt. The latest reading showed a slight decline, but the level above 50 still points to a solid situation and a better development in Sweden than in the euro area. In the current environment, with an increased focus on inflation, we will monitor the trend in input prices particularly closely, as they tend to be a good leading indicator for core inflation.
Economic and market news
What happened overnight
In US trade policy, the USTR has completed Section 301 forced‑labour investigations covering 60 economies, paving the way for permanent tariffs to replace the expiring 10% Section 122 duties on 24 July. Proposed rates are 10% for a small group (including Canada, the EU and Mexico) and 12.5% for others, with Brazil separately hit by a 25% tariff. While the shift in legal basis could still face court challenges, overall tariff levels for now should remain little changed when the authority 'switches' from Section 122 to Section 301.
We have published our Nordic Outlook - Ripple effects from the Strait, 3 June, with updated economic forecasts for the Nordic economies, the euro area, the US and China. In the Nordics, the picture is mixed. Sweden continues to recover, albeit at a slower pace than previously expected. Norway is slowed down by higher inflation and interest rates. Danish GDP growth is surging but the underlying reality is one of modest growth. Finland is seeing some welcome recovery but could use more.
What happened since yesterday
In the US, April JOLTS job openings surprised on the upside at 7.6 million (cons: 6.9), while hires eased to 5.1 million and layoffs were broadly unchanged at 1.7 million. The ratio of job openings to the number of unemployed reached 1.03 (from 0.95) - the hottest level since January 2025. Even though the figures are for April and not May (as in Friday's payrolls), they reinforce the picture of a robust labour market that is no longer cooling and may even be tightening again. Before the release, the Fed's Hammack (voter, hawk) warned the Fed 'may need to act soon if inflation trends don't cool'.
In the euro area, HICP inflation rose to 3.2% y/y (cons: 3.2%, prior: 3.0%) as expected, but slightly above country indications. Core inflation increased more than expected to 2.5% y/y (cons: 2.4%, prior: 2.2%), driven by stronger services. Services inflation rose to 3.5% y/y from 3.0%, partly due to Easter base effects but more importantly a solid 0.4% m/m s.a. increase. Outside services, momentum remains weak, with no signs of higher goods prices and seasonally adjusted food and energy prices falling in May. Overall, this should limit how hawkishly the print is interpreted, although the services surprise still makes it a marginally hawkish outcome for the ECB, consistent with our call for a June hike.
In Denmark, the Danish central bank did not intervene in the FX market in May, where EUR/DKK hit a new historic high of 7.4739. On the one hand, the central bank continues to show great patience with respect to the upwards pressure on EUR/DKK, which has since risen to 7.4742. On the other hand, the upwards pressure persists and if it continues the central bank will likely opt to step in and cap EUR/DKK. Overall, it supports our call that the chance of a 10bp unilateral rate hike in Denmark the coming year is low.
Also in Denmark, a new Danish government is finally in place after the March election. It has presented a programme with substantial tax cuts, especially on VAT on food. The VAT will lower inflation substantially when it happens, but that will not be this year and probably not 2027 either. In the meantime, previously announced cuts to food taxes are cancelled and fuel taxes are not cut, so no extra inflation relief this year. The programme is more concrete on tax cuts and expense increases than on the financing, but that is not unusual for this type of announcement and does not in itself imply increased government borrowing.
In Poland, the National Bank of Poland kept rates on hold at 3.75%, as widely expected.
Equities: Equities rose (again) yesterday, (again) led by Tech and with a large number of new all-time highs across indices.
Whereas Monday's rally was somewhat disturbed by Iran-related headlines, yesterday's move was primarily macro-driven, and the macro news was broadly positive. That triggered a sizeable cyclical rotation. The key point was that US JOLT data moved back in line with the other strong labour-market indicators we have seen over recent months, thereby removing one of the main concerns around the US economy.
If anything, the US labour market has strengthened since the escalation in the Middle East, not weakened. In other words, the geopolitical situation has so far had very limited impact on US labour-market momentum. The combination of strong macro data and very robust earnings is a major challenge for the bears. Their best hope remains a further deterioration around Iran and the Strait of Hormuz. This morning, Asian equities are higher, with Japan leading the move and up close to 3%. US and European futures are broadly flat.
FI and FX: It was a relatively quiet day in FX and fixed income market yesterday, where euro area inflation rose in line with expectations and energy prices were steady. Short-term US and euro area interest rates did not move much and consequently EUR/USD was about unchanged in 1.1620-50 range. EUR/NOK traded around 10.80 and EUR/SEK above 10.80. USD/JPY climbed closer to 160 level yesterday. That warrants close monitoring in our view as it may potentially trigger another round of FX intervention. 10Y US and German government bond yields were steady yesterday.
AI Exuberance Rotates Into Small Caps Amid Sticky Inflation and Looming Central Bank Tightening
Key takeaways
- Global equities pushed to fresh record highs as investor enthusiasm broadened beyond mega-cap technology stocks into small-cap industrial, energy, and infrastructure companies benefiting from the ongoing AI investment boom.
- Strong labour market data and rising inflation pressures in both the U.S. and Eurozone reinforced expectations of a more hawkish global monetary policy environment, with markets increasingly pricing additional tightening from the ECB and Federal Reserve.
- Capital intensity within the AI supercycle is becoming a key market theme, highlighted by Alphabet’s US$80 billion equity raise to finance expanding AI infrastructure spending, raising questions about long-term capital efficiency and balance-sheet sustainability.
- Chart of the day: Nasdaq 100 minor bullish trend remains intact above 30,245 key short-term support.
Top macro headlines
- World Stocks hit historic peaks amid calm geopolitics: Major global equity indexes, including the S&P 500, MSCI All Country, MSCI Emerging Markets, and MSCI Asia ex-Japan, advanced to brand-new record highs on Tuesday. The broad rally was underpinned by a general calm across fixed-income and currency desks, alongside a lack of major shifts in U.S.-Iran border tensions.
- Alphabet stuns markets with unprecedented $80 billion equity capital raise: Google’s parent entity, Alphabet, shocked Wall Street by announcing an $80 billion equity financing program to back its staggering AI capital expenditures, which are projected to reach $200 billion this year. Legendary holding firm Berkshire Hathaway has already committed a major $10 billion block to the capital raise.
- U.S. JOLTS job openings surge to two-year peak: Economic indicators released on Tuesday revealed that U.S. job openings for April jumped to their highest absolute level in two years, led by a massive concentration in professional and business services. This rapid pace represents the quickest sequential expansion in five years, signalling robust labour demand.
- Eurozone inflation scales 3% handle in May, securing ECB June hike: Driven by structural forces, Eurozone headline consumer price inflation crossed the 3% y/y barrier for the first time since September 2023. Core inflation also rose higher to 2.5% y/y from 2.2% in April. These hot prints have effectively locked in a 25-basis-point interest rate hike at next week’s ECB policy meeting, with traders pricing an additional 50 bps of tightening by year-end.
Key macro themes
- The small-cap rotational AI capital drift: While multi-trillion dollar megacap behemoths capture mainstream headlines, an underlying structural rotation is developing. Tech and energy small caps are outperforming as critical components of the physical "picks and shovels” layer of the global AI buildout, allowing them to monetise large capex budgets away from over-concentrated tech heavyweights.
- Megacap liquidity demands & balance sheet fatigue: Alphabet’s massive $80 billion capital raise highlights growing cash demands among AI players. Despite boasting $126 billion in cash at the end of Q1, Alphabet’s massive capex burn rate, paired with $85 billion in fresh debt issuance over the past year, is prompting concerns over long-term capital efficiency.
- Sovereign monetary policy conundrums: Central banks globally are entering a synchronised tightening regime to squash persistent price pressures. With Eurozone inflation hot, the ECB is set to follow the G10 rate-hiking cohorts of Australia and Norway. Markets are subsequently pricing in a faster policy-tightening timeline from the Fed under the new leadership of Kevin Warsh.
Global market impact (last 24 hours)
Equities: The S&P 500 closed higher at fresh peaks with seven out of 11 sectors advancing, led by Utilities (+1.9%), Materials (+1.2%), and Industrials (+1%). Small-caps and non-tech cyclicals dramatically outperformed, while European bourses rallied 0.8% and the UK FTSE added 0.3%.
Fixed Income: Global sovereign bonds enjoyed a rare relief bid. The long end of the U.S. Treasury curve rallied, dropping yields by 3 basis points. Japan’s 10-year JGB yield plunged a massive 11 basis points following a highly successful auction, registering its steepest single-day drop since April 2023.
FX: The U.S. Dollar Index continued to trade within a minor range between 99.50 and 98.90, while the USD/JPY inched higher towards the critical 160.00 intervention threshold, keeping Japanese authorities on high alert. Conversely, digital safe havens buckled, with Bitcoin sliding 6% to break toward $66,000, printing an intraday low of $65,370 in today’s Asia opening session.
Commodities: Energy markets firmed modestly, with crude oil contracts adding 1% amid uncertainty over an interim US-Iran peace deal. Precious metals stabilised, with spot gold holding steady near $4,484/oz as investors balanced sticky global yields with Middle East headlines, but remained capped below its 20-day moving average at $4,580.
Asia Pacific impact
- Stock indices surge to records: Mirroring global risk-on transitions, regional bourses posted strong sessions. The MSCI Asia ex-Japan index climbed to an all-time record, building on Monday’s massive 4.0% single-session explosion in South Korea. In today’s Asia opening session, rotation has been seen among Hong Kong shares and China’s “A” shares. The Hang Seng Index slid -1.7% intraday, while China A 50 and the broader CSI 300 index rose around 1.5% each. The outperformance of China “A” shares has been driven by an expansion in service activities, as the RatingDog Services PMI rose to 54.4 in May from 52.6 in the prior month.
- Japanese bond volatility: The 11 bps collapse in the 10-year JGB yield has significantly adjusted near-term domestic yields. However, markets remain tightly focused on the Bank of Japan's upcoming policy meeting next week, where the central bank is widely expected to signal a clear path for interest rate normalisation and tapering.
- Chinese energy inventories: Highlighting real-world supply shifts, data show that China is aggressively drawing down its domestic onshore crude stockpiles to replace regular oil imports, which have plunged to a 10-year absolute low due to high international costs.
Top 3 events to watch today
- BoJ Governor Ueda Speech - 4.30 pm SGT Impact: USD/JPY, JPY crosses, short-term JGBs, Nikkei 225
- US ADP Employment Change (May) - 8:15 pm SGT (consensus: +117K, Apr: +109K) Impact: USD, short-term US Treasuries, US stock indices, Gold
- US ISM Services PMI (May) - 10:00 pm SGT (consensus: 53.8, Apr: 53.6) Impact: USD, short-term US Treasuries, US stock indices, Gold
Chart of the day - Nasdaq 100 remains entrenched in an ascending channel
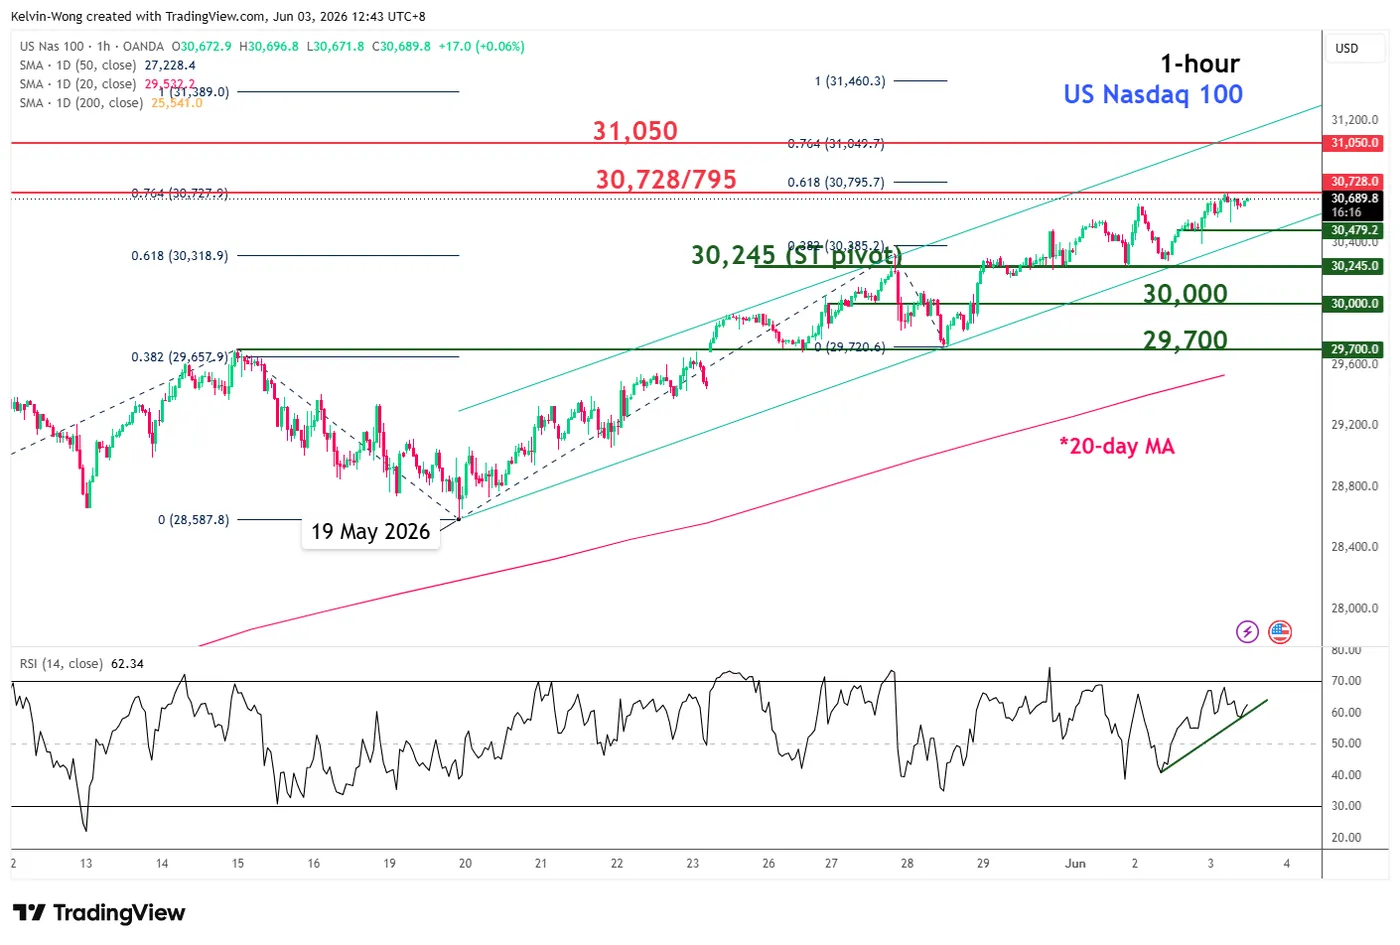
Fig. 1: US Nasdaq 100 CFD minor trend as of 3 Jun 2026 (Source: Trading View). The information presented is historical information, and past performance is not indicative of future performance.
The price action of the US Nasdaq 100 CFD (a proxy for the Nasdaq 100 E-mini futures) has continued to oscillate within a minor ascending channel in place since the 19 May 2026 low at 28,588.
In addition, the hourly RSI momentum indicator remains in a healthy bullish momentum condition (above the 60 level).
These observations suggest its minor uptrend phase remains intact. Watch the 30,245 key short-term pivotal support for a further potential push up. A clearance above 30,795 points to the next intermediate resistance at 31,050 (Fibonacci extension).
However, failure to hold and an hourly close below 30,245 would negate the bullish tone, signalling a minor corrective decline towards the next intermediate supports at 30,000 and even 29,700 (close to the 20-day moving average).
Bitcoin’s Next Stop Could Be $60k. The Bigger Risk May Be $40k.
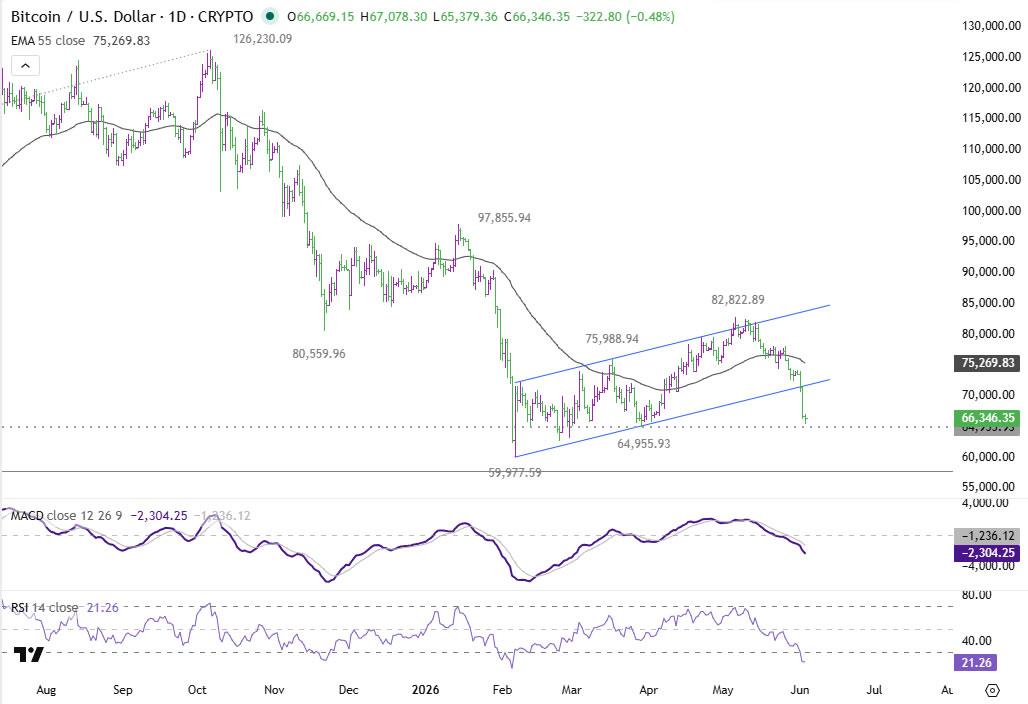
Bitcoin is flashing increasingly bearish signals at a time when many traditional risk assets continue to look remarkably resilient. The cryptocurrency plunged below $70,000 this week, accelerating a decline that has already erased much of the recovery from February's lows. The divergence with equity markets is becoming difficult to ignore. While investors continue pushing technology shares and AI-related stocks toward record highs, Bitcoin is behaving as though the macro environment is becoming steadily more hostile.
Part of the explanation lies in energy markets. The renewed uncertainty surrounding US-Iran negotiations has kept oil prices elevated even without a full-scale escalation in hostilities. Investors are worried that prolonged disruption around the Strait of Hormuz could sustain inflation pressures through higher transportation and energy costs. That in turn raises the prospect of interest rates staying higher for longer. While stock markets remain focused on earnings and AI investment themes, Bitcoin appears to be reacting more directly to concerns about liquidity and monetary conditions.
Institutional flows have amplified the weakness. More than $4.2 billion has exited digital asset investment products over the last three weeks, reversing one of the key sources of support that fueled Bitcoin's earlier rally. Spot ETF redemptions require fund managers to sell physical Bitcoin into the market, creating a persistent stream of supply. With fewer institutional buyers stepping in, normal market volatility has become harder to absorb.
The technical damage is also becoming harder to dismiss. Bitcoin has broken decisively below a rising daily channel, indicating that the rebound from 59,977 likely ended with three waves up to 82,822. As long as prices remain below 55 D EMA (now at 75,260), the path of least resistance points lower. Support around 64,955 may slow the decline initially, but a decisive break would open the door to a retest of the 59,977 low.
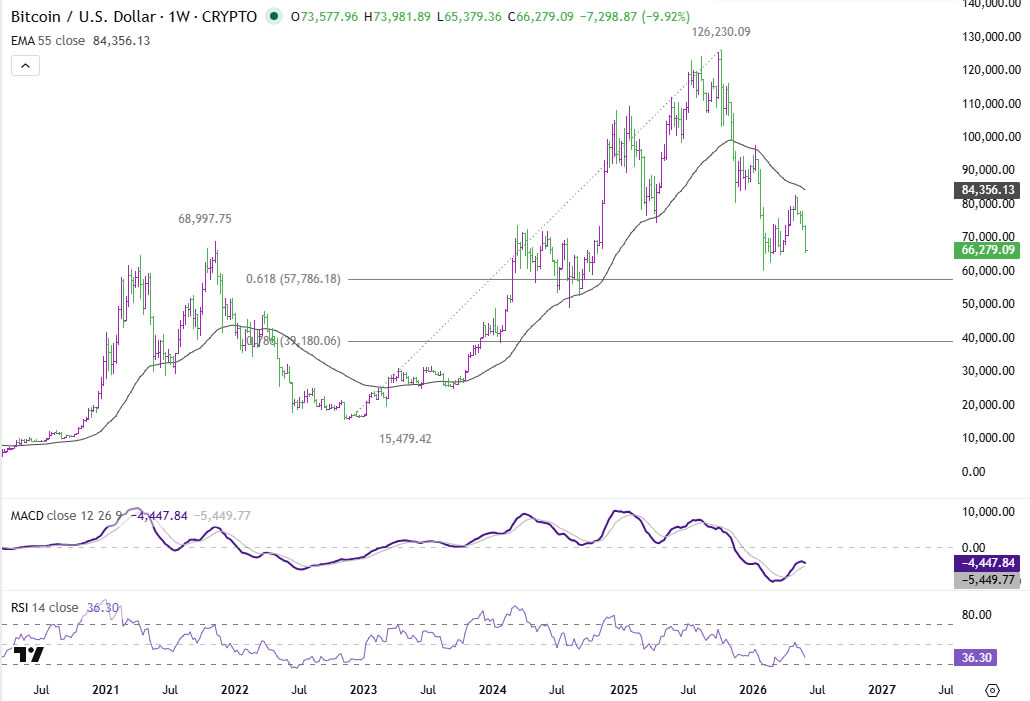
In the bigger picture, the downtrend from 126,230 is not yet complete. Rejection by 55 W EMA (now at 84,352) reinforced the bearish medium-term outlook. As the down trend extends, Bitcoin will likely dive through 61.8% retracement of 15,479 (2022 low) to 12,6230 (2025 high) at 57,786 to 78.6% retracement at 39,180.
For now, a move toward $60,000 appears to be the most immediate risk. But if macro pressures persist, ETF outflows continue, and technical support levels fail, the conversation could shift rapidly toward the possibility of a much deeper decline. In that scenario, the $40,000 area may become a far more relevant target than many investors currently expect.