Sample Category Title
EUR/USD Mid-Day Outlook
Daily Pivots: (S1) 1.0395; (P) 1.0428; (R1) 1.0455; More...
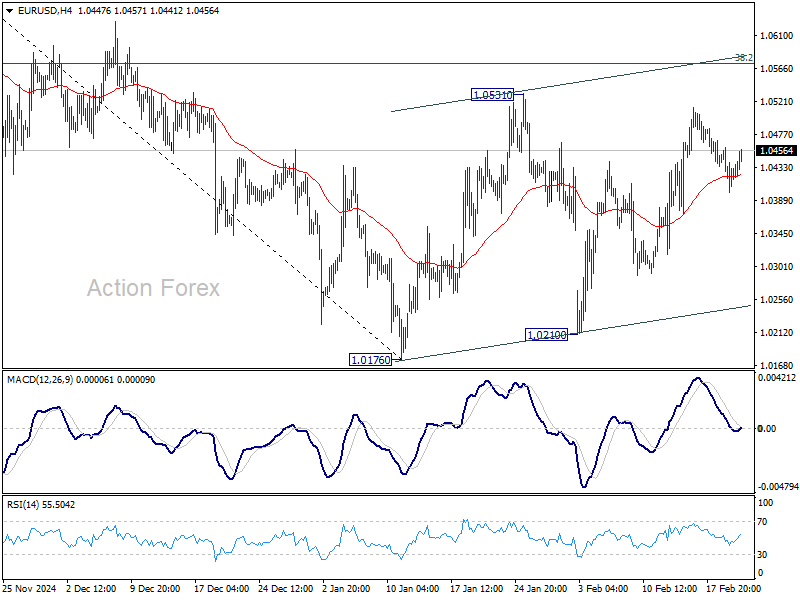
Intraday bias in EUR/USD remains neutral as consolidation from 1.0176 is still extending. Stronger rebound might be seen but outlook will remain bearish as long as 38.2% retracement of 1.1213 to 1.0176 at 1.0572 holds. On the downside, break of 1.0176 will resume whole fall from 1.1213. However, decisive break of 1.0572 will raise the chance of reversal, and target 61.8% retracement at 1.0817.
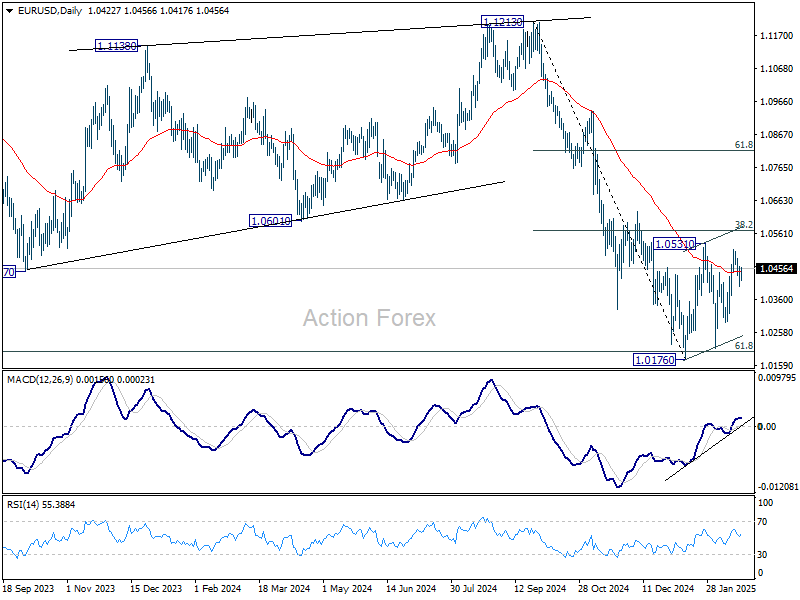
In the bigger picture, immediate focus is on 61.8 retracement of 0.9534 (2022 low) to 1.1274 (2024 high) at 1.0199. Sustained break there will solidify the case of medium term bearish trend reversal, and pave the way back to 0.9534. However, reversal from 1.0199 will argue that price actions from 1.1274 are merely a corrective pattern, and has already completed.
GBP/USD Mid-Day Outlook
Daily Pivots: (S1) 1.2552; (P) 1.2597; (R1) 1.2631; More...
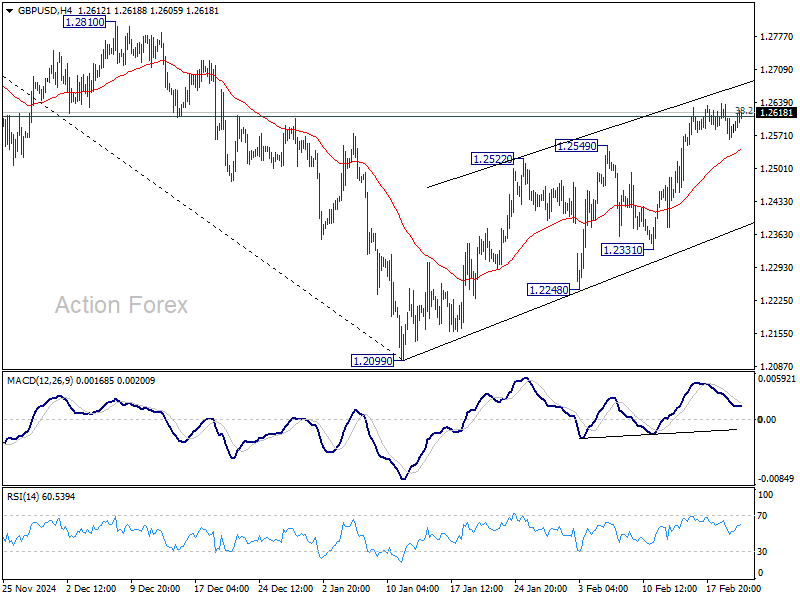
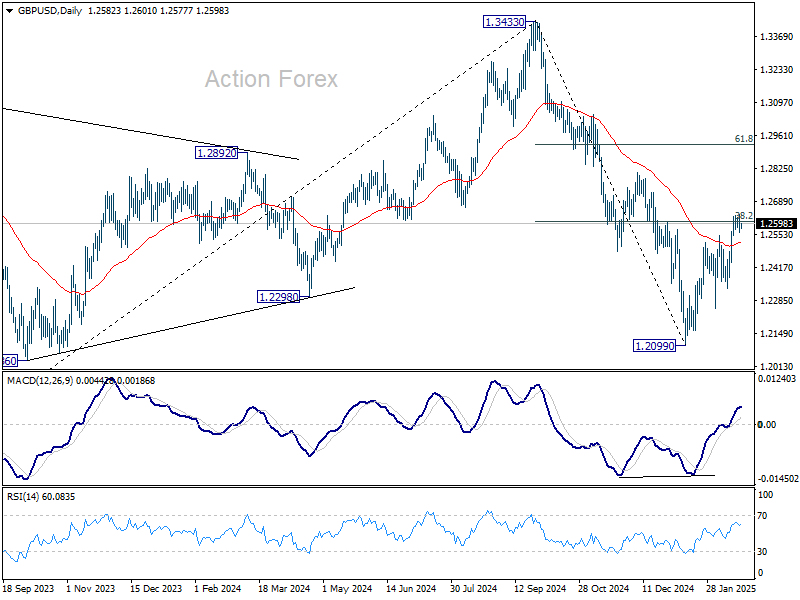
Intraday bias in GBP/USD remains neutral and attention stays on 38.2% retracement of 1.3433 to 1.2099 at 1.2609. Rejection by 1.2609 will keep near term outlook bearish. Break of 1.2331 support will suggest that the rebound from 1.2099 has completed as a correction, and bring retest of 1.2099 low. However, firm break of 1.2609 will raise the chance of near term reversal, and target 61.8% retracement at 1.2923.
In the bigger picture, rise from 1.0351 (2022 low) should have already completed at 1.3433 (2024 high), and the trend has reversed. Further fall is now expected as long as 1.2810 resistance holds. Deeper decline should be seen to 61.8% retracement of 1.0351 to 1.3433 at 1.1528, even as a corrective move. However, firm break of 1.2810 will dampen this bearish view and bring retest of 1.3433 high instead.
USD/CHF Mid-Day Outlook
Daily Pivots: (S1) 0.9027; (P) 0.9041; (R1) 0.9060; More…
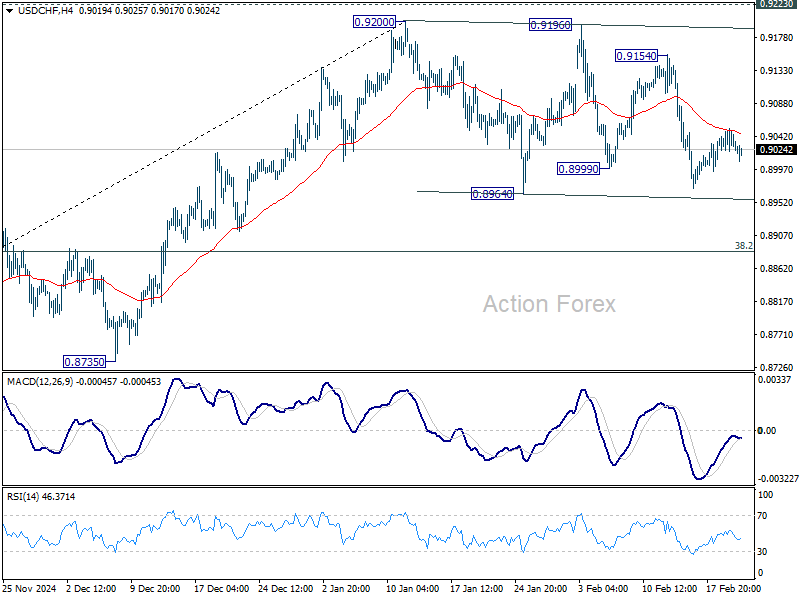
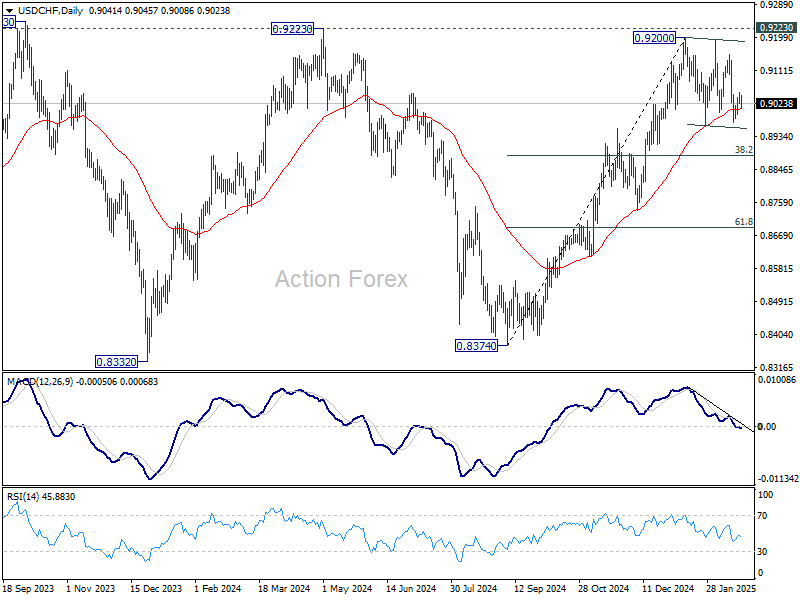
No change in USD/CHF's outlook as consolidation from 0.9200 is still extending. Intraday bias stays neutral at this point. While deeper pull back might be seen, outlook will stay mildly bullish as long as 38.2% retracement of 0.8374 to 0.9200 at 0.8884 holds. On the upside, firm break of 0.9223 key resistance will carry larger bullish implication. However, sustained break of 0.8884 will indicate bearish reversal, and target 61.8% retracement at 0.8690 instead.
In the bigger picture, decisive break of 0.9223 resistance will argue that whole down trend from 1.0342 (2017 high) has completed with three waves down to 0.8332 (2023 low). Outlook will be turned bullish for 1.0146 resistance next. Nevertheless, rejection by 0.9223 will retain medium term bearishness for another decline through 0.8332 at a later stage.
USD/JPY Mid-Day Outlook
Daily Pivots: (S1) 151.06; (P) 151.68; (R1) 152.12; More...
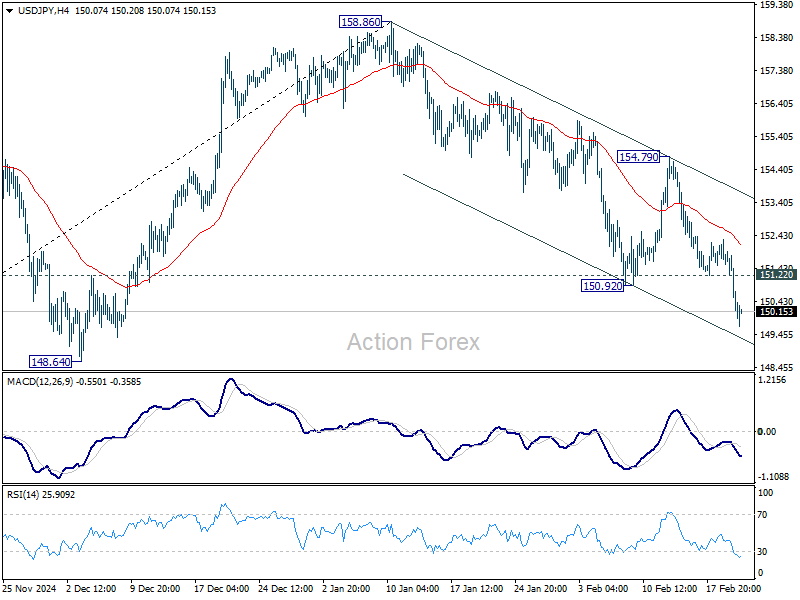
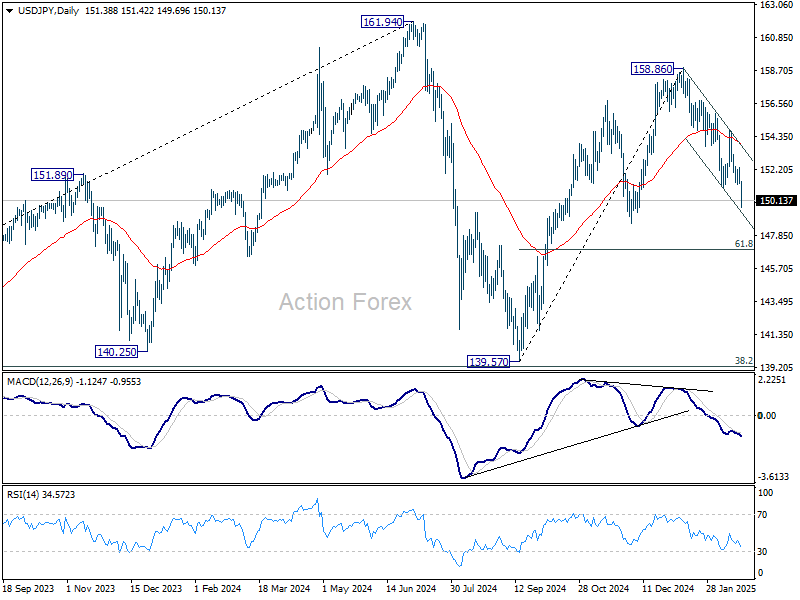
Intraday bias in USD/JPY remains on the downside for the moment. Fall from 158.86 is seen as the third leg of the pattern from 161.94 high. Deeper decline should be seen to 61.8% retracement of 139.57 to 158.86 at 146.32 next. On the upside, above 151.22 minor resistance will turn intraday bias neutral again first. But near term outlook will now stay bearish as long as 154.79 resistance holds.
In the bigger picture, price actions from 161.94 are seen as a corrective pattern to rise from 102.58 (2021 low). In case of another fall, strong support should be seen from 38.2% retracement of 102.58 to 161.94 at 139.26 to bring rebound. However, sustained break of 139.26 would open up deeper medium term decline to 61.8% retracement at 125.25.
USD/JPY Drops Below 150, Japan CPI to Decide Next Move
Yen continues to dominate the relatively quiet forex markets today, with USD/JPY slipping below the key 150 psychological. The move is largely fueled by rising speculation that BoJ may tighten policy again sooner than expected, a sentiment that's also reflected in 10-year JGB yield's rally to another 15-year high. While the base case for BoJ’s next rate hike remains in the second half of the year, traders are increasingly betting on an earlier move—especially if this year’s Shunto wage negotiations deliver wage increases in line with last year’s strong outcomes.
The next major test for Yen will be Japan’s January CPI release in the upcoming Asian session. The market is expecting core CPI to rise slightly from 3.0% to 3.1%. Any upside surprise, particularly if core-core CPI (which excludes fresh food and energy) also rises, could strengthen market conviction that BoJ may need to act sooner than currently anticipated. A hot inflation print, combined with rising wage pressures, would likely push traders to further price in an earlier rate hike and adding to Yen strength.
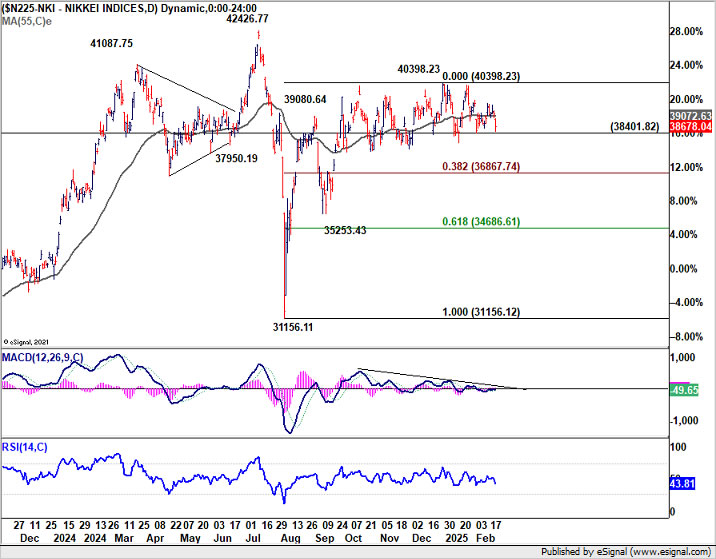
Beyond Yen’s rally, Nikkei 225 is also worth watching, as its technical outlook could provide further signals. Firm break of 38401.82 support could be an earlier sign that corrective rebound from 31156.11 has finally completed. That would set up deeper fall to 38.2% retracement 31156.11 to 40398.23 at 36867.74. If realized, deeper decline in Nikkei should also be accompanied by extended fall in USD/JPY.
In the broader currency market, Aussie ranks as the second-strongest performer today so far, supported by robust employment data and hawkish commentary from a senior RBA official. Kiwi is also firm, after RBNZ Governor Adrian Orr reaffirmed a slower pace of rate cuts ahead. Meanwhile, Dollar is under pressure, ranking as the weakest currency of the day, followed by Sterling and then Euro. Swiss Franc and Loonie are positioning in the middle.
In Europe, at the time of writing, FTSE is down -0.40%. DAX is up 0.19%. CAC is up 0.24%. UK 10-year yield is up 0.019 at 4.632. Germany 10-year yield is down -0.005 at 2.555. Earlier in Asia, Nikkei fell -1.24%. Hong Kong HSI fell -1.60%. China Shanghai SSE fell -0.02%. Singapore Strait Times fell -0.17%. Japan 10-year JGB yield rose 0.0106 to 1.450.
US initial jobless claims rise to 219k vs exp 216k
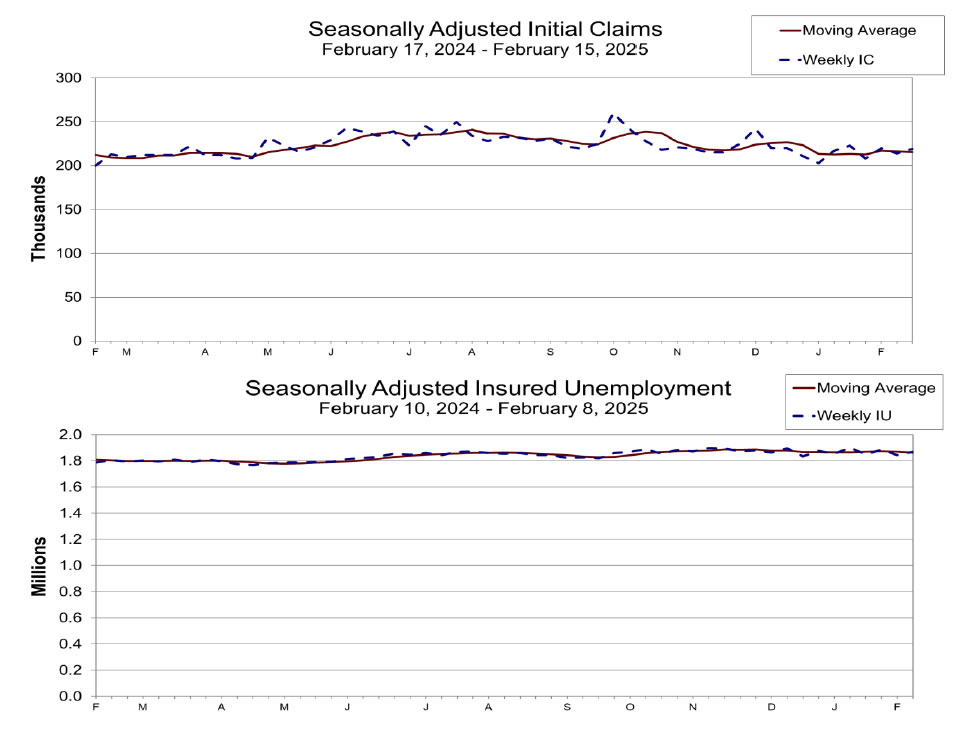
US initial jobless claims rose 5k to 219k in the week ending February 15, above expectation of 216k. Four-week moving average of initial claims fell -1k to 215k.
Continuing claims rose 24k to 1869k in the week ending February 8. Four-week moving average of continuing claims fell -8k to 1863k.
RBA’s Hauser: Rate cut justified, but inflation fight not a done deal
RBA Deputy Governor Andrew Hauser explained the 25bps rate cut to 4.10% earlier this week, highlighting that the decision was influenced by an “alternative version” of the inflation forecast. Under a scenario where rates remained unchanged, inflation would have undershot inflation target midpoint, albeit slightly. This factor played a key role in the board’s decision to ease policy.
However, Hauser struck a cautious tone on further cuts, emphasizing that core inflation at 3.2% remains above target. He reinforced that RBA’s remains “rigorously” focused on controlling price pressures, stating that the battle against inflation is “not a done deal” . He explained that RBA is not “whamming down on the accelerator”, but has simply “eased back on the brake a little bit”.
Regarding the strong January employment report release today, Hauser welcomed the figures, calling them part of a “striking employment growth” trend in Australia. He noted that Australia’s labor market performance stands out internationally, with strong participation rates and employment growth exceeding many other developed economies.
Australia’s employment grows 44k in Jan, outpacing population growth rate
Australia’s employment surged by 44k in January, more than double the expected 20k gain. The increase was driven by a 54.1k rise in full-time jobs, while part-time employment declined by -10.1k. However, the number of unemployed people also grew by 23k.
Employment growth at 0.3% mom matched 2024 monthly average, but outpacing population growth of 0.2%.
Unemployment rate edged up from 4.0% to 4.1%, in line with expectations, as the participation rate hit a record high of 67.3%, up from 67.2% in December. Meanwhile, monthly hours worked fell by -0.4% mom.
RBNZ’s Orr: No more 50bps cuts without a shock, sees stable inflation ahead
RBNZ Governor Adrian Orr reaffirmed that a 50bps rate cut would only happen again in the event of an economic shock, reinforcing the central bank’s guidance for two 25bps cuts in the first half of 2025.
Speaking before a parliamentary committee today, Orr noted that New Zealand is now in an environment of low and stable inflation, though global uncertainty remains a key risk.
He expressed optimism, stating that “GDP growth, employment growth, and low and stable inflation” should support an improving economic environment throughout the year. However, he warned that “geoeconomic fragmentation” is weighing on global growth, leading to increased price volatility in international markets.
RBNZ Chief Economist Paul Conway told the committee that escalating trade tensions will contribute to higher inflation, weaker global growth, and reduced economic efficiency. He stressed that "The best thing we can do is have headline inflation at 2% so that we can sort of absorb that future volatility."
USD/JPY Mid-Day Outlook
Daily Pivots: (S1) 151.06; (P) 151.68; (R1) 152.12; More...
Intraday bias in USD/JPY remains on the downside for the moment. Fall from 158.86 is seen as the third leg of the pattern from 161.94 high. Deeper decline should be seen to 61.8% retracement of 139.57 to 158.86 at 146.32 next. On the upside, above 151.22 minor resistance will turn intraday bias neutral again first. But near term outlook will now stay bearish as long as 154.79 resistance holds.
In the bigger picture, price actions from 161.94 are seen as a corrective pattern to rise from 102.58 (2021 low). In case of another fall, strong support should be seen from 38.2% retracement of 102.58 to 161.94 at 139.26 to bring rebound. However, sustained break of 139.26 would open up deeper medium term decline to 61.8% retracement at 125.25.
US initial jobless claims rise to 219k vs exp 216k
US initial jobless claims rose 5k to 219k in the week ending February 15, above expectation of 216k. Four-week moving average of initial claims fell -1k to 215k.
Continuing claims rose 24k to 1869k in the week ending February 8. Four-week moving average of continuing claims fell -8k to 1863k.
USD/JPY: Cracks 150.00 Support After 1% Drop on Thursday
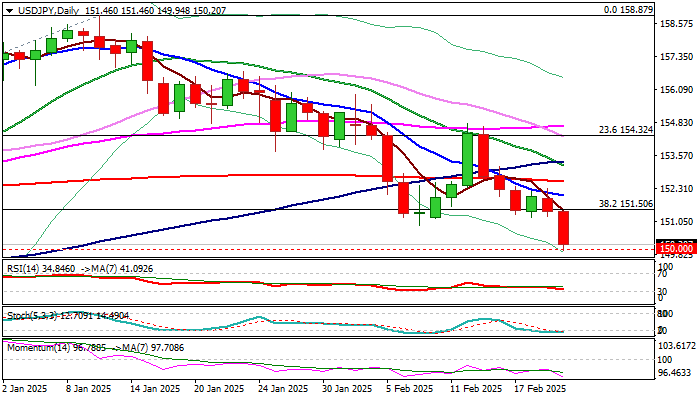
USDJPY was sharply down on Thursday morning as yen received fresh boost from growing expectations of BoJ’s more aggressive approach to monetary policy.
The price fell almost 1% during Asian/ early European trading and cracked psychological 150 support for the first time since Dec 9.
The support is reinforced by lower 20-d Bollinger band and provided temporary footstep, where bears may pause for consolidation.
Upticks should stay capped under 151.00 zone to keep bears intact for fresh push lower and firm break of 150 trigger which would signal bearish continuation and expose next targets at149.22 and 148.64 (50% retracement of 139.57/158.87 / Dec 3 higher low respectively).
Negative daily studies (MA’s in bearish setup / strong negative momentum) with latest formation of 20/100DMA bear-cross, support scenario.
Caution on lift above 151.00 and violation of 151.50 (broken Fibo 38.2%) which would sideline bears and open way for stronger recovery.
Res: 151.00; 151.50; 152.05; 152.59.
Sup: 150.00; 149.22; 149.00; 148.64.
USD/JPY Hits Two-Month Low as Demand for Safe-Haven Yen Surges
The USD/JPY pair has fallen to a two-month low, trading near 150.07, as geopolitical and trade uncertainties drive investors towards the safe-haven yen.
Key factors behind JPY strength
The yen's rise is largely due to growing global risk aversion. Earlier this week, US President Donald Trump announced plans to impose 25% tariffs on cars, semiconductors, and pharmaceuticals, sparking fresh concerns about a global trade war.
Additionally, the market is reacting to Trump's foreign policy statements, particularly regarding the Russia-Ukraine conflict, which has further intensified the demand for safe-haven assets, including the yen.
Domestically, the Bank of Japan (BoJ) is expected to raise interest rates this year, providing fundamental support for the yen. However, uncertainty remains as to whether the BoJ will act in March or delay its decision.
Investors are now awaiting inflation data from Japan, which could provide more clarity on the central bank’s next move.
USD/JPY technical analysis
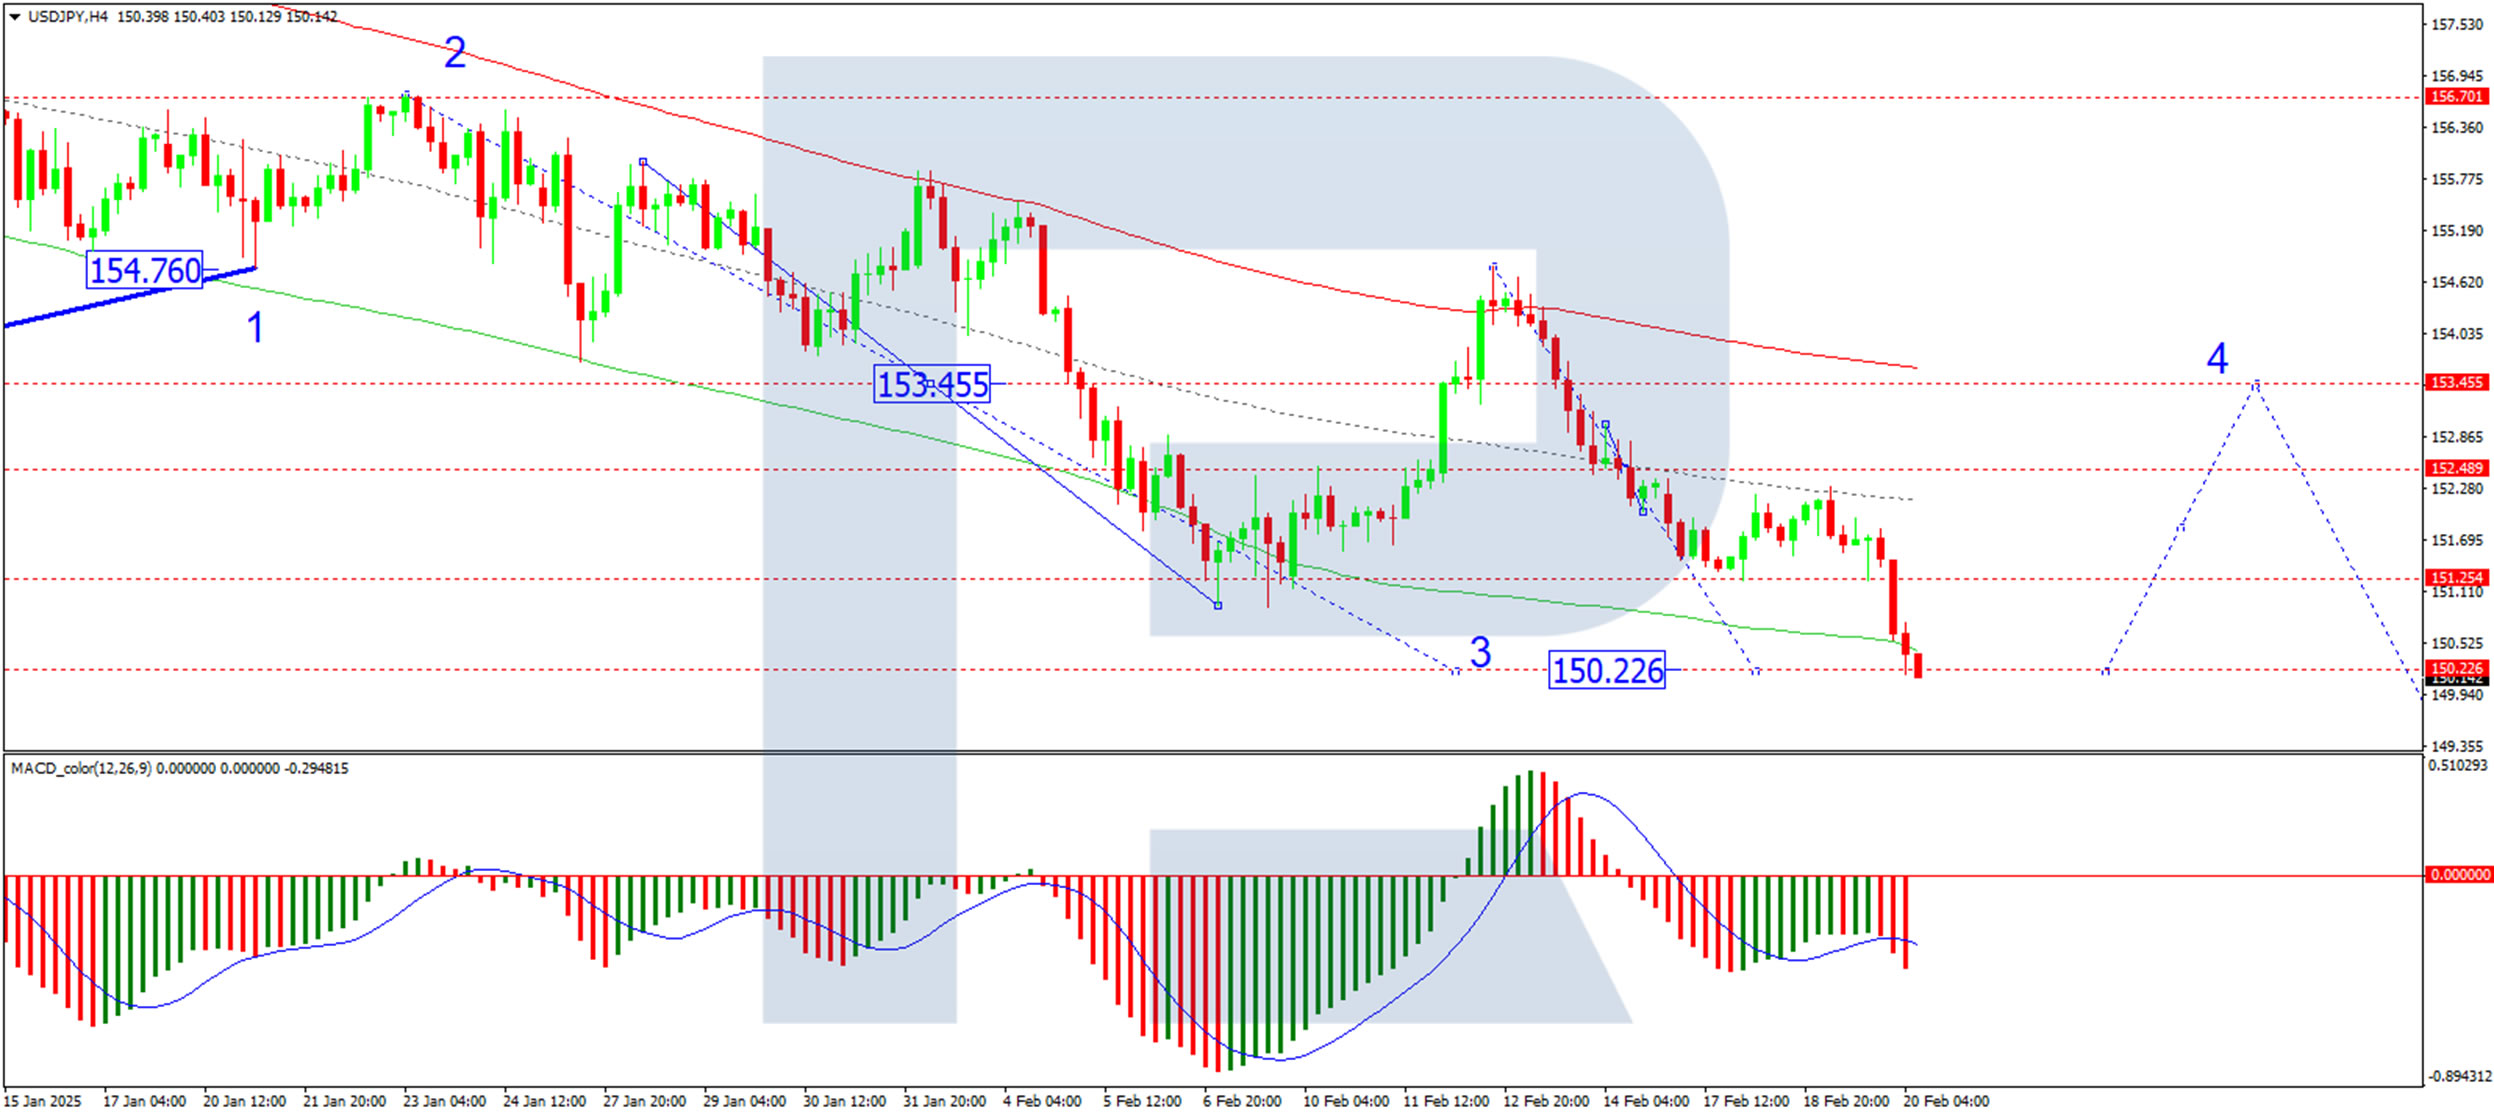
On the H4 chart, USD/JPY has reached its local downside target at 150.22. A consolidation range is expected to form at these lows. If the pair breaks upwards from this range, a corrective move towards 153.45 could begin. However, after completing this correction, a fifth wave of decline may develop, targeting 148.11. The MACD indicator confirms this outlook, with its signal line positioned below zero and pointing strongly downward, indicating bearish momentum.
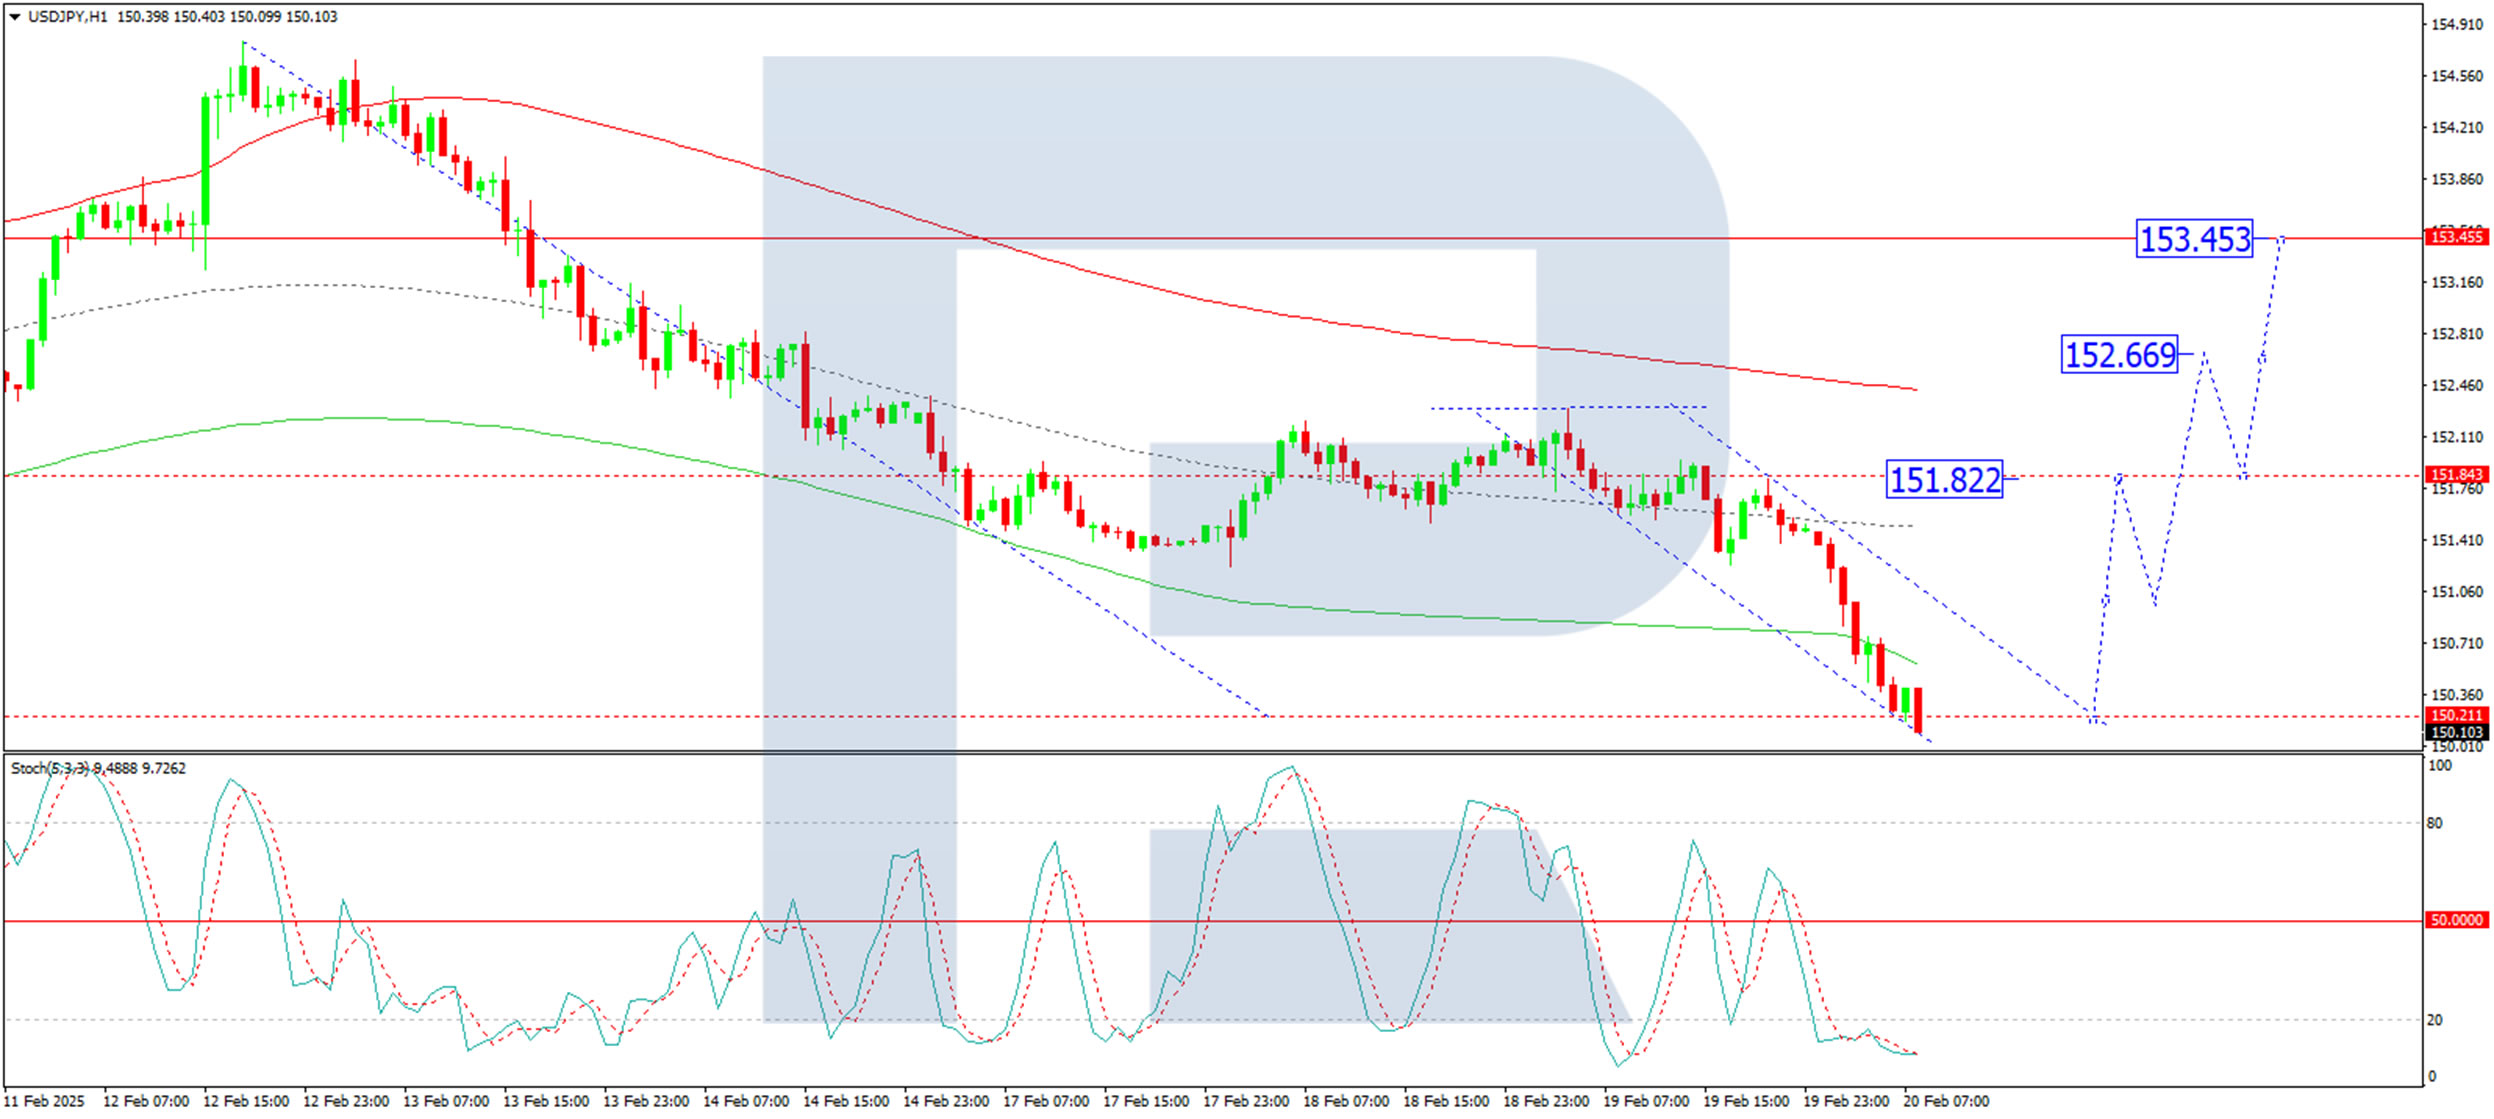
On the H1 chart, USD/JPY completed a downward wave to 150.22 and is currently consolidating above this level. If the price breaks upwards, the first corrective wave could extend to 151.82. After reaching this level, a potential pullback to 150.98 may follow before the broader trend resumes. The Stochastic oscillator also supports this view, with its signal line below 20, preparing for a move towards 80, suggesting a short-term correction before further downside.
Conclusion
The Japanese yen continues to benefit from heightened global trade and geopolitical risks, along with expectations of further BoJ tightening. While a short-term correction towards 151.82 is possible, the overall trend remains bearish, with downside targets at 150.22 and potentially 148.11. Market focus will remain on Japan’s inflation data and further developments in US trade policy, both of which could shape the yen’s next major move.
Trump Bypasses Europe to End Ukraine War – Euro and Gold Fight for Attention
- US and Russian officials meet to discuss peace without Ukraine.
- UK and EU shut out of talks, but markets see hope for Europe.
- Is Trump cosying up to Putin, hanging NATO out to dry?
- Even with a deal, gold is likely to stay in demand.
First talks to end Ukraine war
Talks aimed at resolving the war between Russia and Ukraine - the first since the conflict started three years ago – took place in Saudi Arabia this week. The long-sought push for peace should have brought widespread relief, except it comes with a caveat. The talks in Riyadh on Tuesday were not between Russia and Ukraine, as one would have expected, but between Russia and the United States.
US President Donald Trump, in his desire to reach a quick deal to end the war, has hijacked the negotiations, engaging directly with Russia’s President Putin and sidelining Ukraine and America’s European allies in the process. This is significant in two ways – first it’s symbolic that Russia has been brought in from the cold, ending the country’s isolation from the global stage, and second, it undermines the NATO alliance, as Trump seems ready for a thaw in relations with the West’s arch-foe at the expense of Washington’s traditional allies.
Will US-Russia talks bear fruit?
The question now is whether the Trump administration’s gamble will pay off. Trump’s businessman leadership style suggests he wants instant results, hence, why he’s reached out to Putin even before consulting with Ukraine’s President Zelensky. However, there is no guarantee that Ukraine will agree to any basis of a deal that’s been struck without its involvement.
US Secretary of State Marco Rubio argued that these talks were merely a “first step”, intended to determine how serious the Russians are about peace, and that Europe and Ukraine would become part of any “real negotiations”. But it appears that both sides were pleased with the initial discussions, as they’ve agreed to explore closer relations as well as a negotiated end to the conflict.
Trump opens US rift with Europe
Angry about being excluded from the talks, European countries, including the United Kingdom, held a summit in Paris on Monday to discuss the security threat posed to Ukraine as well as the wider continent from a possible Trump-Putin pact. Whilst the leaders agreed to meet again on Wednesday, expanding the number of countries participating to Canada and smaller European nations, Monday’s talks appear to have exposed divisions rather than come up with a unified response to Trump’s dangerous escapades with Russia.
What is clear, though, is that there is growing recognition among Europeans for the need to boost defence spending, but less so when it comes to the commitment for sending ground troops to Ukraine as part of any future peacekeeping force.
A negotiating tactic?
The latter is probably one reason why Trump is keen to obtain the upper hand in the negotiations. It’s unlikely that America will contribute to any peacekeeping troops, putting the responsibility firmly on Europe. Trump reportedly also wants Europeans to buy more weapons from the United States and it can’t be ruled out that he will not use tariffs to pressure the European Union to get his way. Moreover, Trump wants access to Ukraine’s very large reserves of rare earth minerals.
All this implies that Trump wants any peace deal to be first and foremost, a win-win situation for the US, even if it’s not the best outcome for Ukraine or Europe. It’s quite likely therefore that, despite the outrage in Kyiv and other European capitals, US-led negotiations with Russia will be able to bring an end to the current fighting in Ukraine but not necessarily guarantee the country’s security in the long term.
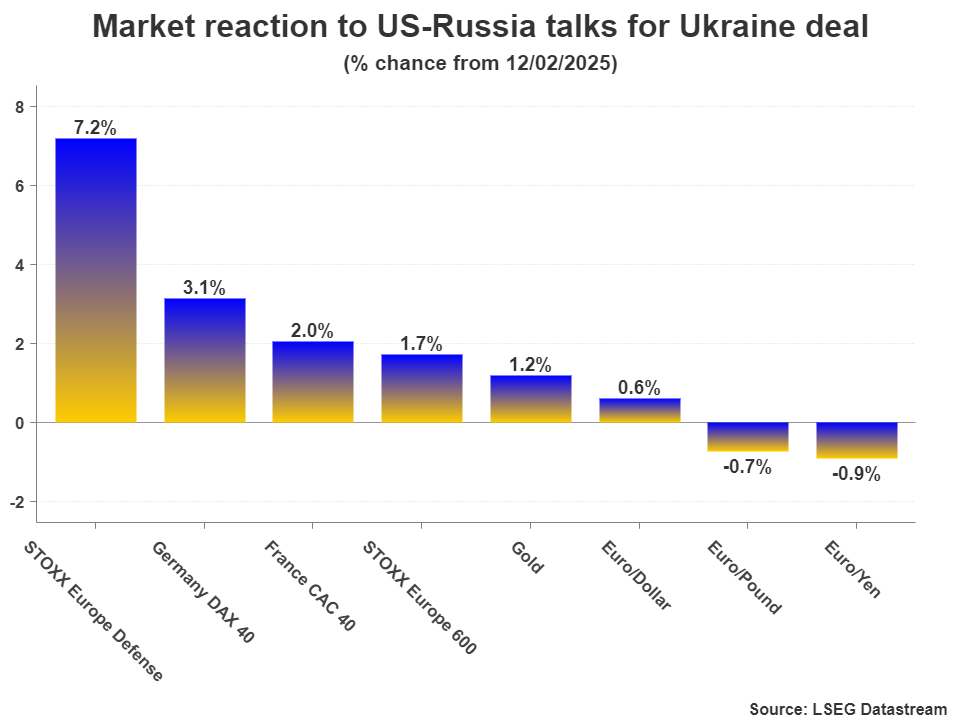
Peace talks lift the Euro and European stocks
Yet, investors seem to be seeing light at the end of the tunnel, pushing the euro higher on the first real prospect of a peace deal since the start of the war. European stocks have also rallied somewhat, with defense stocks in particular benefiting from the shift towards higher military spending.
More broadly, a peace agreement would bring about lower energy prices via a return of Russian oil and gas into European markets, while ending the uncertainties associated with war. The German economy is likely to see the biggest boost from any viable deal as its manufacturing sector has been tarnished by the loss of cheap Russian gas.
A stronger German economy equals a stronger single currency, hence, further progress in the US-Russia talks could spur more gains for the euro, even if at this stage, European and Ukrainian leaders insist that they will not sign up for the concessions being demanded by Russia and which US officials appear to have no problem with.
NATO red lines
Russia’s biggest demand is that Ukraine should not become a NATO member. This may be a hard concession to swallow but Moscow has gone a step further and is insisting that any peacekeeping force should not include NATO troops. This is probably something that the Trump administration would not agree to. Nevertheless, the bigger question mark is what kind of security guarantees is the US willing to provide?
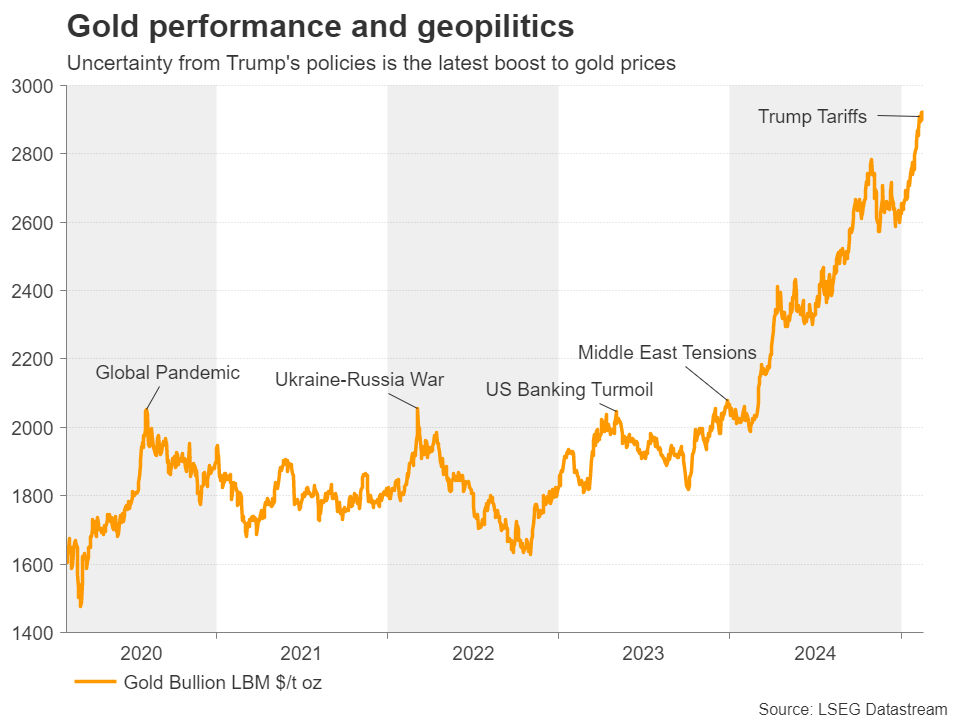
Any deal forged hastily that does not address the security of Europe’s borders with Russia is likely to give investors another reason to flock to gold. The safe-haven metal is already basking in all the geopolitical uncertainty generated by Trump’s tariff policies and his wild plan for the Middle East.
Gold tracks long-term peace hopes
Thus, while the euro might benefit from the medium-term prospect of peace on the continent and the lifting of at least some of the sanctions against Russia, a simultaneous rally in gold would reflect unease among some investors about Trump’s abandonment of America’s NATO friends in favour of a more isolationist stance, but one that includes better ties with Russia.
For now, although markets will be watching the developments very carefully, any moves are likely to be limited until the gap between Ukraine/EU and Russia/US has narrowed.
Aussie Hits 2025 High on Strong Jobs Data
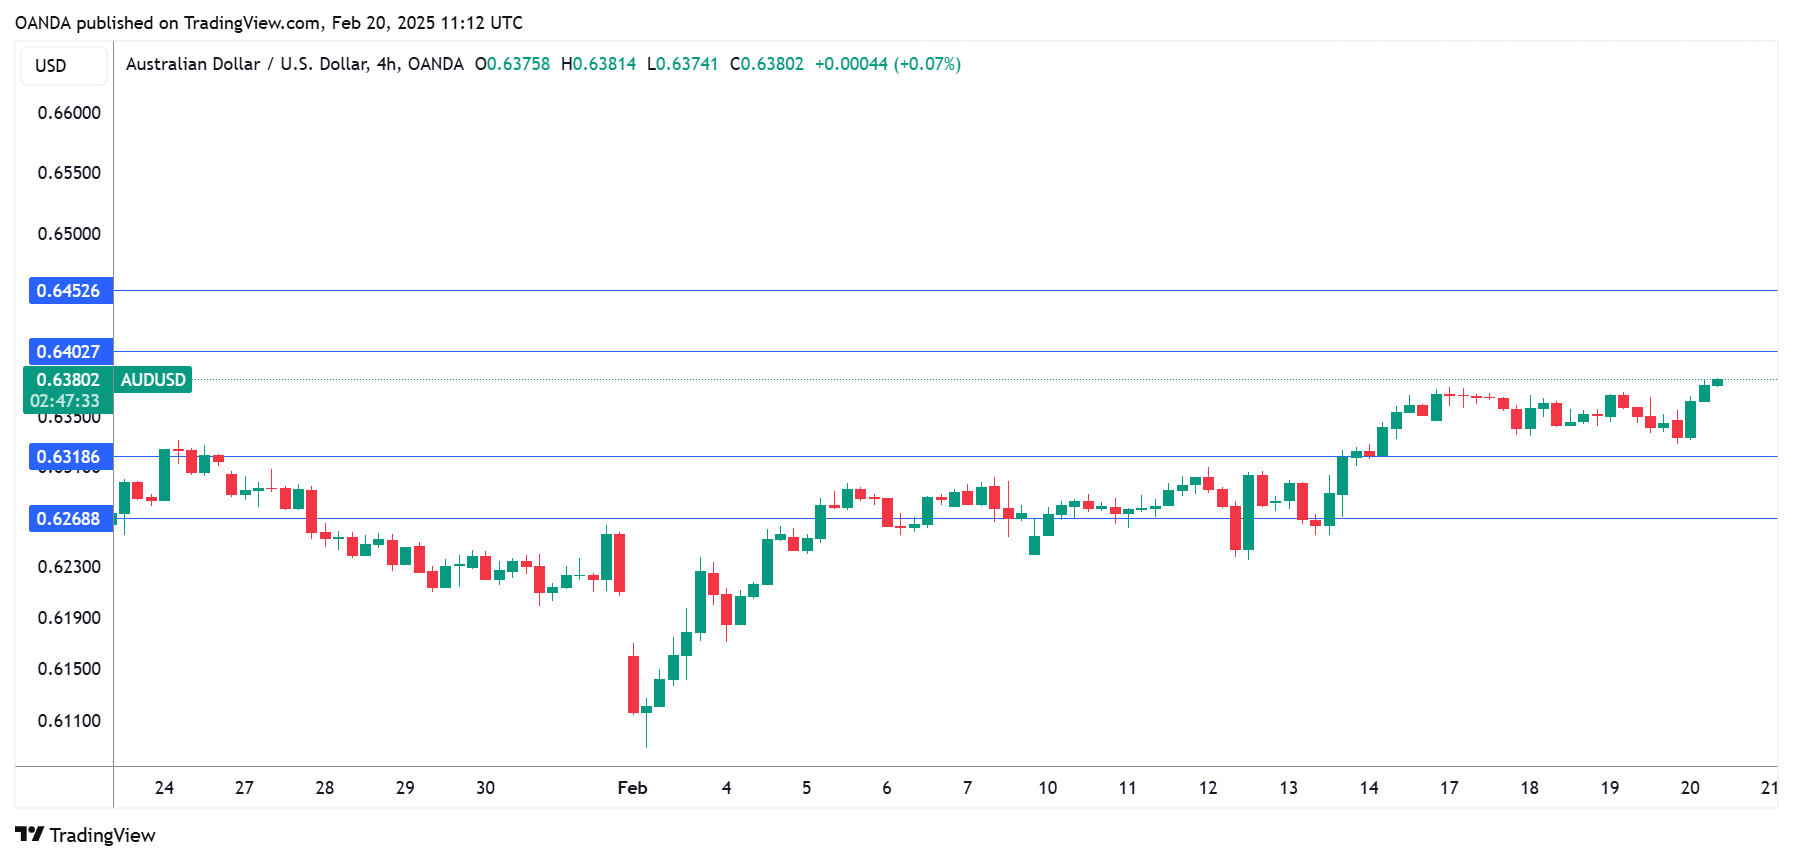
The Australian dollar has posted strong gains on Thursday. In the European session, AUD/USD is trading at 0.6377, up 0.55% on the day.
Australia’s job growth beats forecast
Australia’s labor market continues to shine. The economy created 44 thousand jobs in January, blowing past the market estimate of 20 thousand. This followed an upwardly revised gain of 60 thousand in December. Impressively, full-time employment jumped 54.1 thousand and part-time employment decreased by 10.1 thousand. The unemployment rate crept up to 4.1% from 4%.
The hot jobs report was well-received by the market and sent the Australian dollar as high as 0.6379, its highest level since December 16. What impact will the release have on interest rates?
The Reserve Bank of Australia cut the cash rate by a quarter-point on Tuesday to 4.10%. This was the first rate cut in over four years but the RBA sounded hawkish at the meeting, saying that there were upside risks to inflation and the Bank would be cautious about continuing to cut rates. The strong jobs report lowers the pressure on the RBA to deliver another cut at the next meeting in April, but the markets have priced in a 75% chance of a rate reduction in May.
Fed minutes: members worried about tariffs
The Federal Reserve minutes from the January meeting expressed concern about upside risks to inflation. In particular, members were worried about the effects of “potential changes in trade and immigration policy”. US President Trump’s threats of tariffs and mass deportations could stoke inflation, which would delay rate cuts. The minutes also noted “substantial optimism about the economic outlook”. The Fed held rates at the January meeting and meets next in March. The markets have priced in the next rate cut in July or September.
AUD/USD Technical
- The next resistance line is 0.6402, which has held since December 2024. Above, there is resistance at 0.6452
- 0.6318 and 0.6268 are the next support levels