Sample Category Title
Swing & Intraday Analysis: Key Levels for Trading AUDUSD
Fundamental Analysis:
The Reserve Bank of Australia will meet on February 17 and 18, and a rate cut is expected as recent inflation data shows that inflation is approaching the RBA's target faster than previously anticipated. This scenario puts pressure on the AUD as the Fed is not considering rate cuts in the short term, which will continue to support USD buying.
Technical Analysis
AUDUSD, Daily
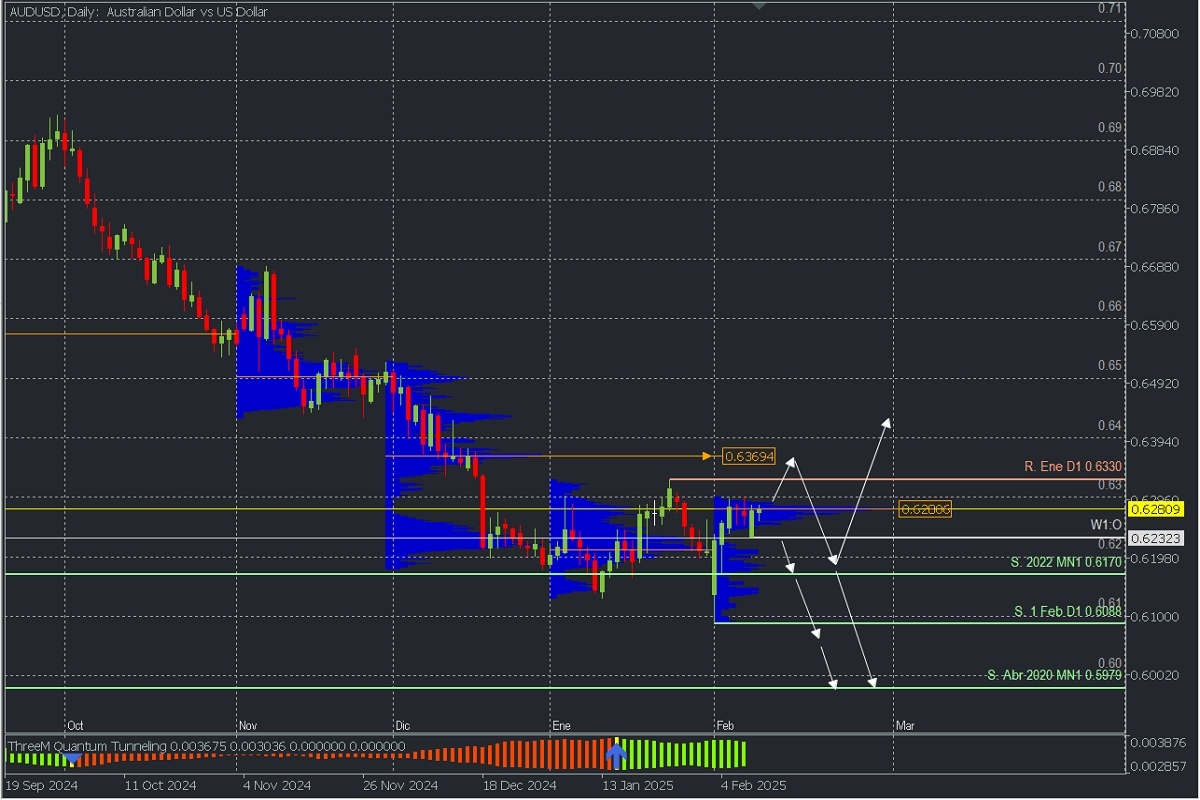
- Supply Zones (Sell): 0.6369 and 0.6280
- Demand Zones (Buy): 0.66
After breaking the 2022 support, the price is now at levels seen in April 2020, leaving daily support at 0.6088, which triggered the January high at 0.6330 as the last validated daily resistance. The current consolidation and correction are developing a volume concentration for February (not fixed until the month ends) around 0.6280, a potential supply zone that could trigger bearish activity early and renew selling towards 0.61 or the 2020 lows. This scenario will remain valid if the price does not break above this zone and the key resistance from January.
On the other hand, the potential rebound from the first break of the January resistance targets the macro supply zone in December around 0.6369, which is expected to be defended by bears to drive sales towards 0.62 at least, from where a bullish reversal or further bearish continuation will be assessed. The bearish continuation should break the 0.6088 support.
AUDUSD, H2
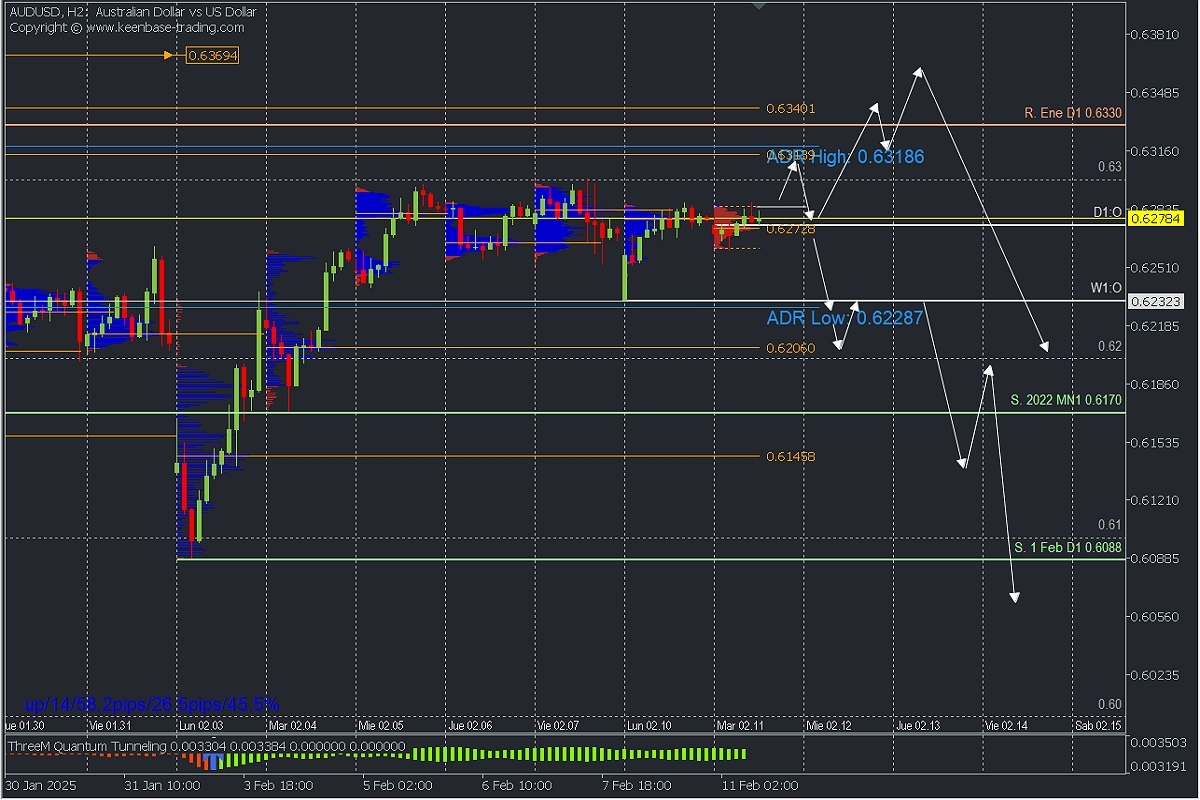
- Supply Zones (Sell): 0.6313, 0.6340, and 0.6369
- Demand Zones (Buy): 0.6272, 0.6206, and 0.6145
On an intraday basis, the price has consolidated for the fifth consecutive day below 0.63, with the last validated support at 0.6170. This implies that the correction will continue with an upward bias as long as this level is not broken.
In this sense, buying has struggled to break above the POC from the early sessions at 0.6272, but if we see a move above 0.6287, a rally towards the supply zone around 0.6318 is expected, where there is an uncovered POC and the average bullish range.
On the other hand, if the price drops below 0.6272, we do not rule out selling towards the weekly open (W1:O) at 0.6232 and, more extended, the uncovered POC at 0.6206, with potential for bearish continuation.
Technical Summary:
- Corrective Bullish Scenario: Buy above 0.6287 with targets at 0.63, 0.6318, and potentially 0.6340
- Bearish Continuation Scenario: Sell below 0.6272 with targets at 0.6232, 0.62, 0.6170, and 0.6145.
Always wait for the formation and confirmation of an *Exhaustion/Reversal Pattern (PAR) on M5, like the ones we teach here https://t.me/spanishfbs/2258 before entering any trades in the key zones we indicate.
*Uncovered POC: POC = Point of Control: It is the level or zone where the highest volume concentration occurred. If there was a bearish movement from this point, it is considered a sell zone and forms a resistance area. Conversely, if there was a bullish impulse, it is considered a buy zone, usually located at lows, thus forming support zones.
Crypto Market Stays Near the Lower Boundary
Market Overview
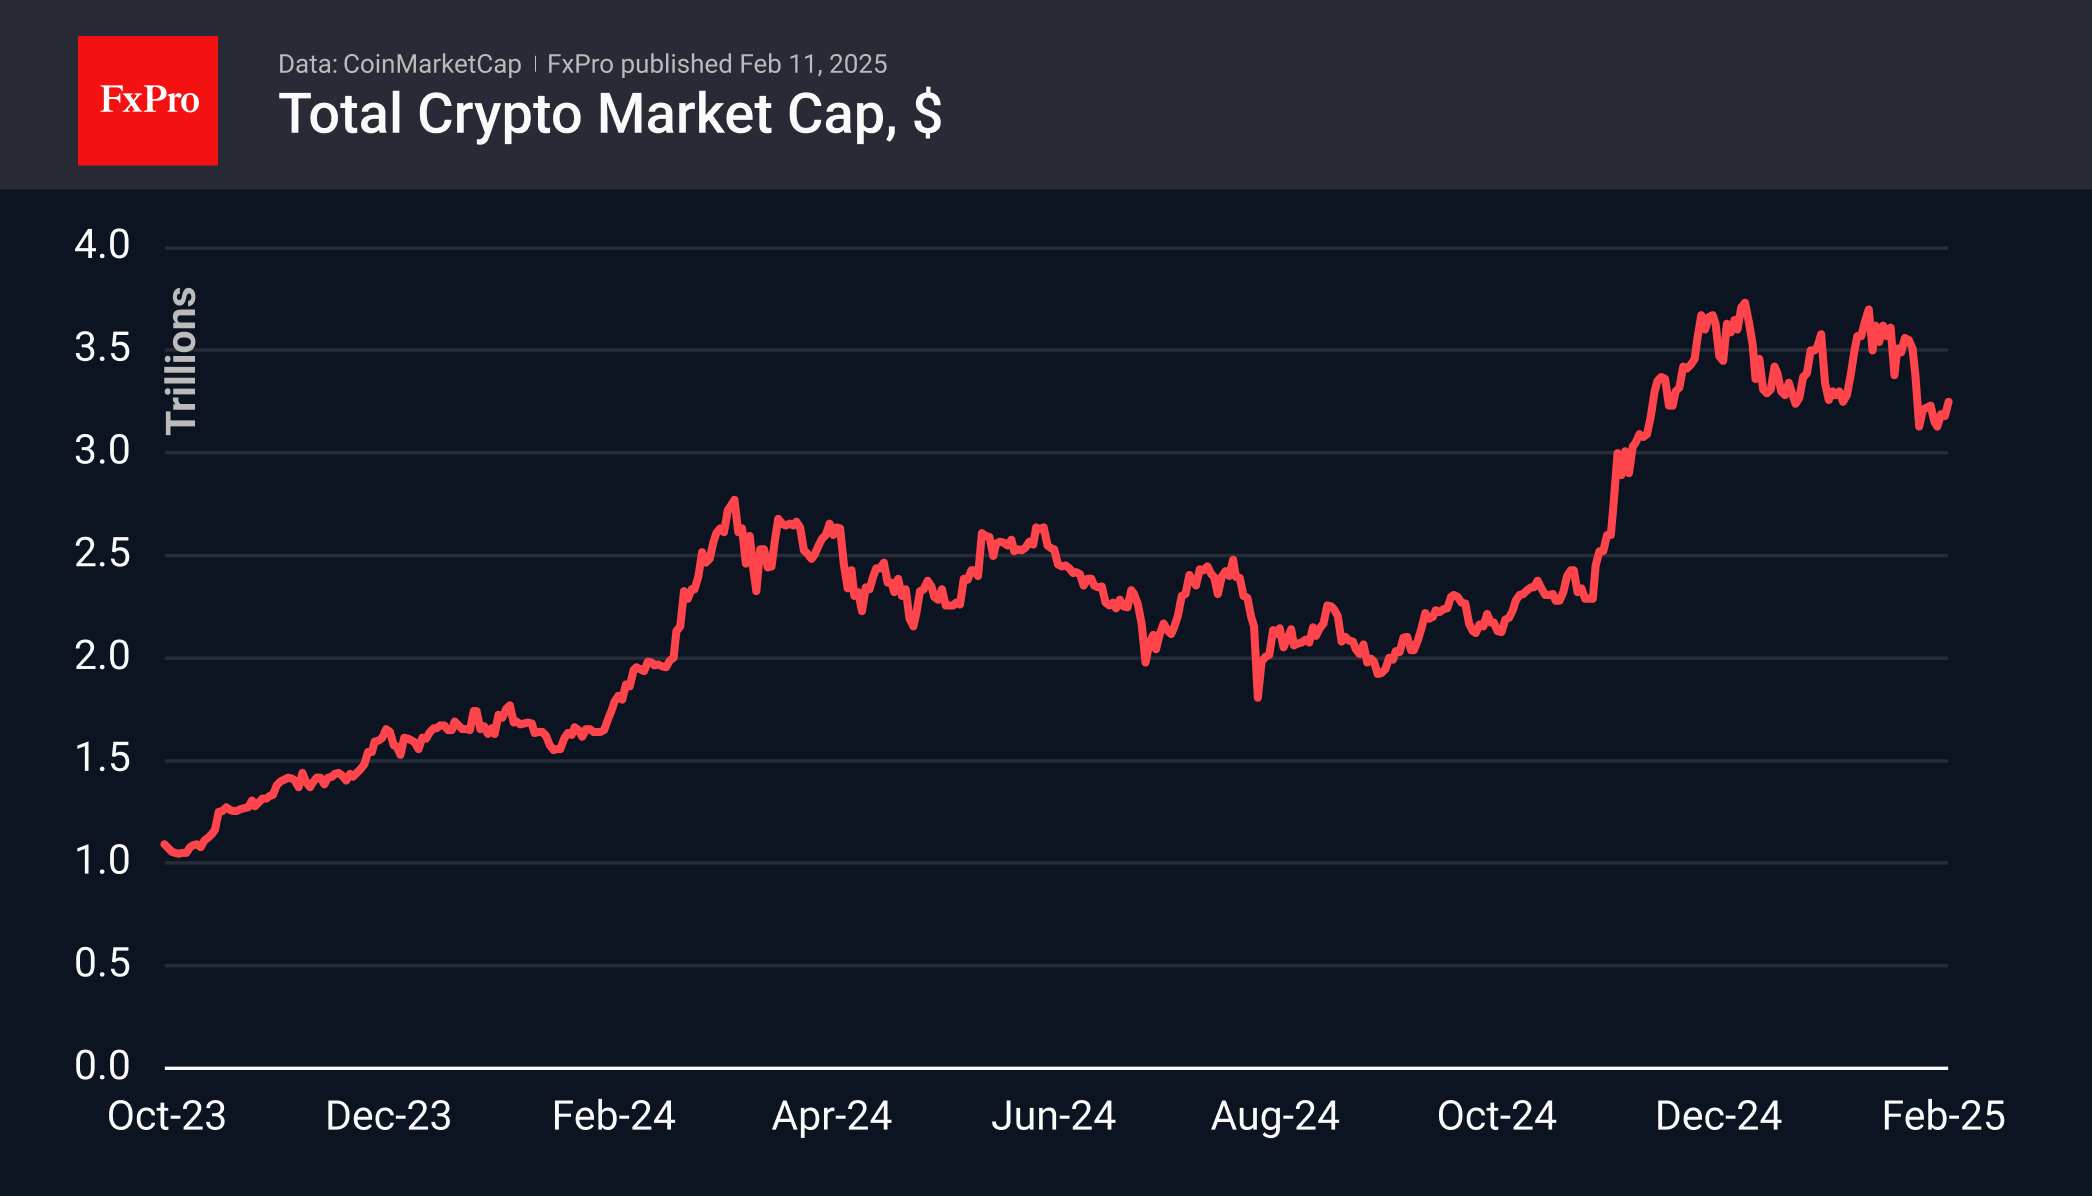
The total capitalisation of cryptocurrencies increased by 2.5% over the last 24 hours, moving away from the lower boundary of the local range. However, at $3.25 trillion, the market remains nearly unchanged from the previous week. Despite record highs in gold and European stocks, along with strong performance in U.S. securities, cryptocurrencies remain out of favour with buyers.
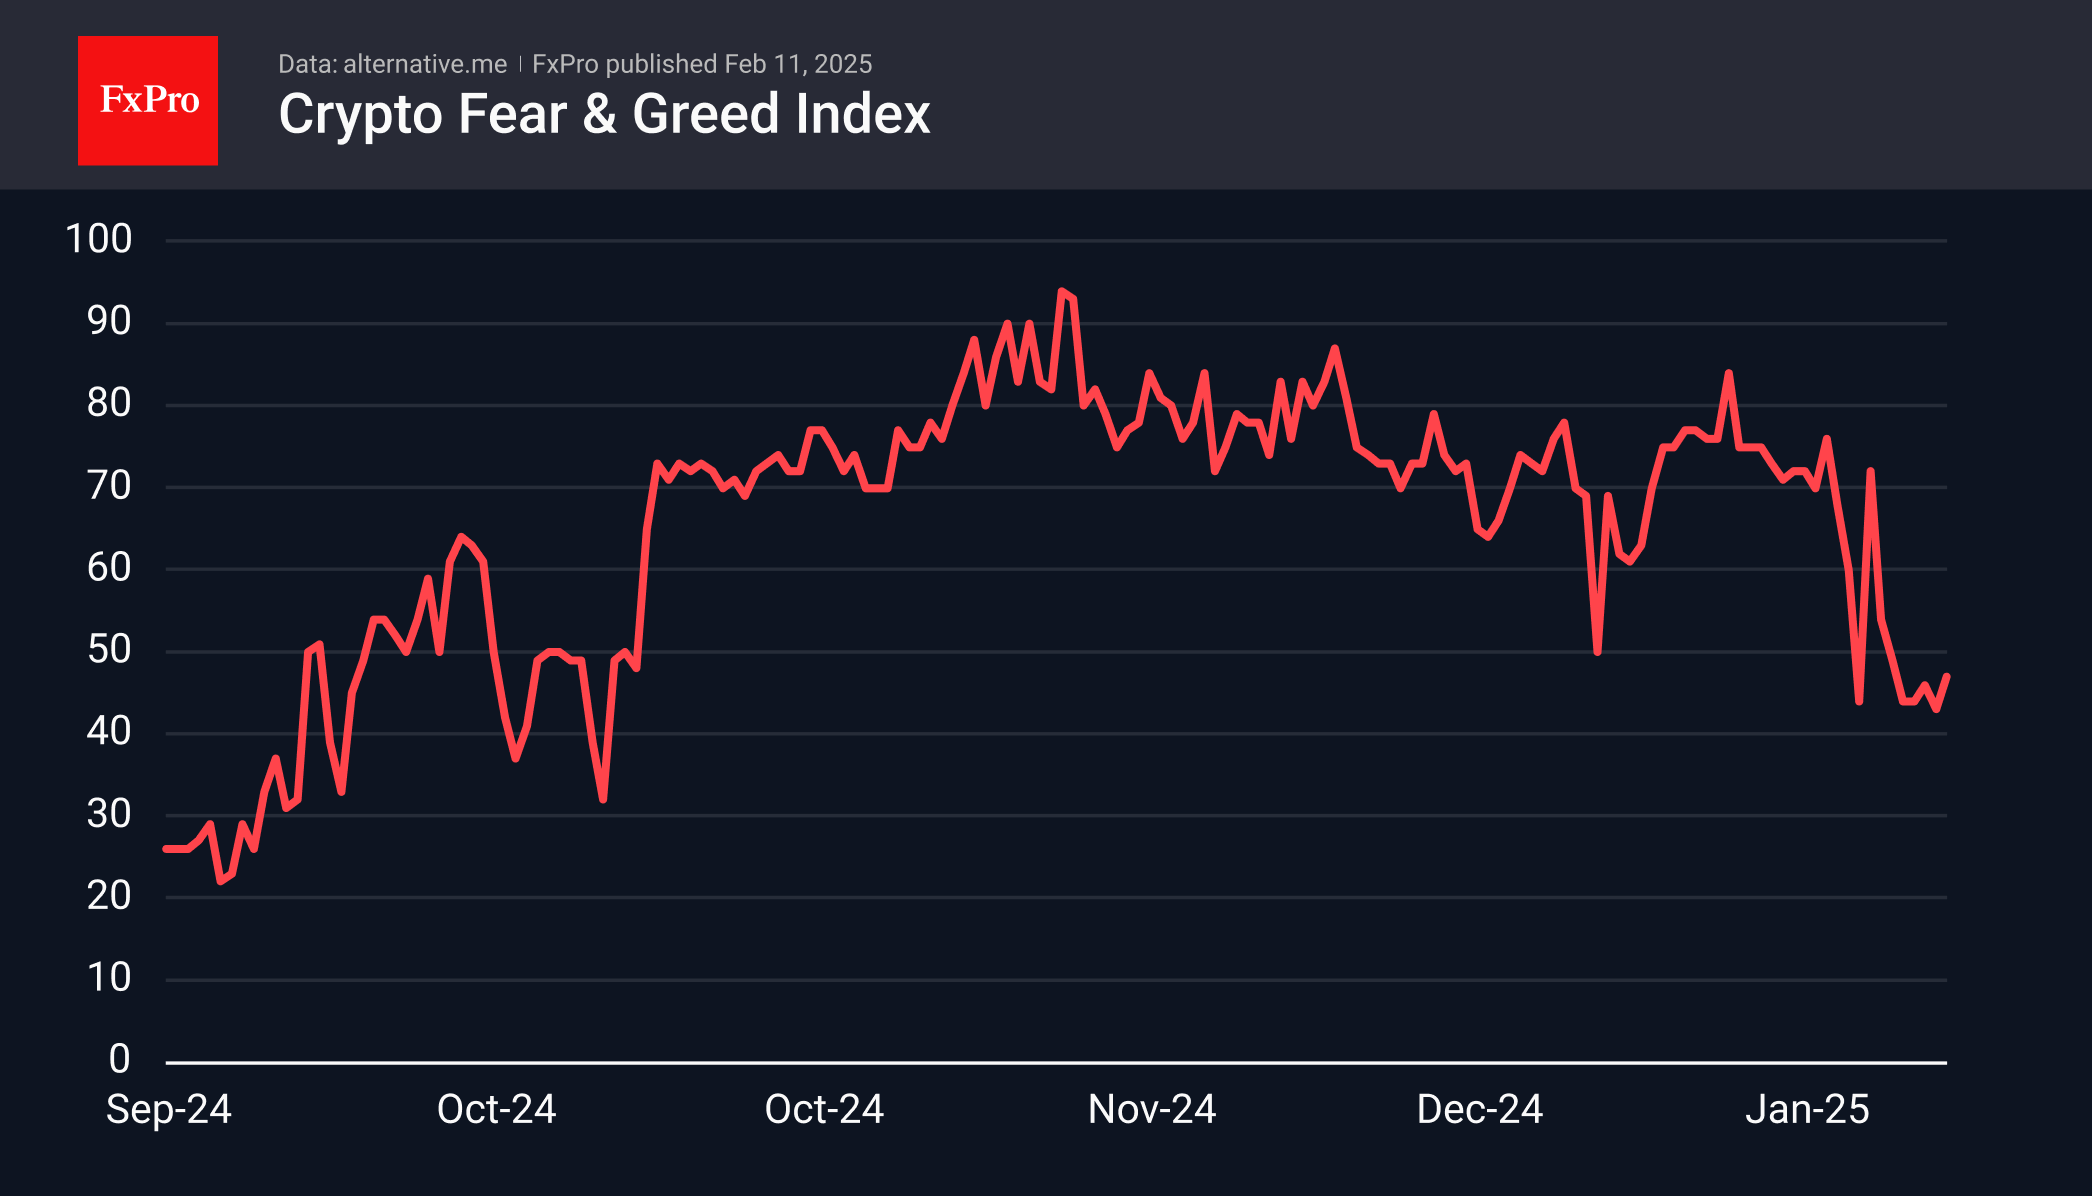
The cryptocurrency fear index was on the borderline between fear and neutral sentiment. There has been no quick recovery, and the lack of a dip in the fear zone has deterred some buyers from being active.
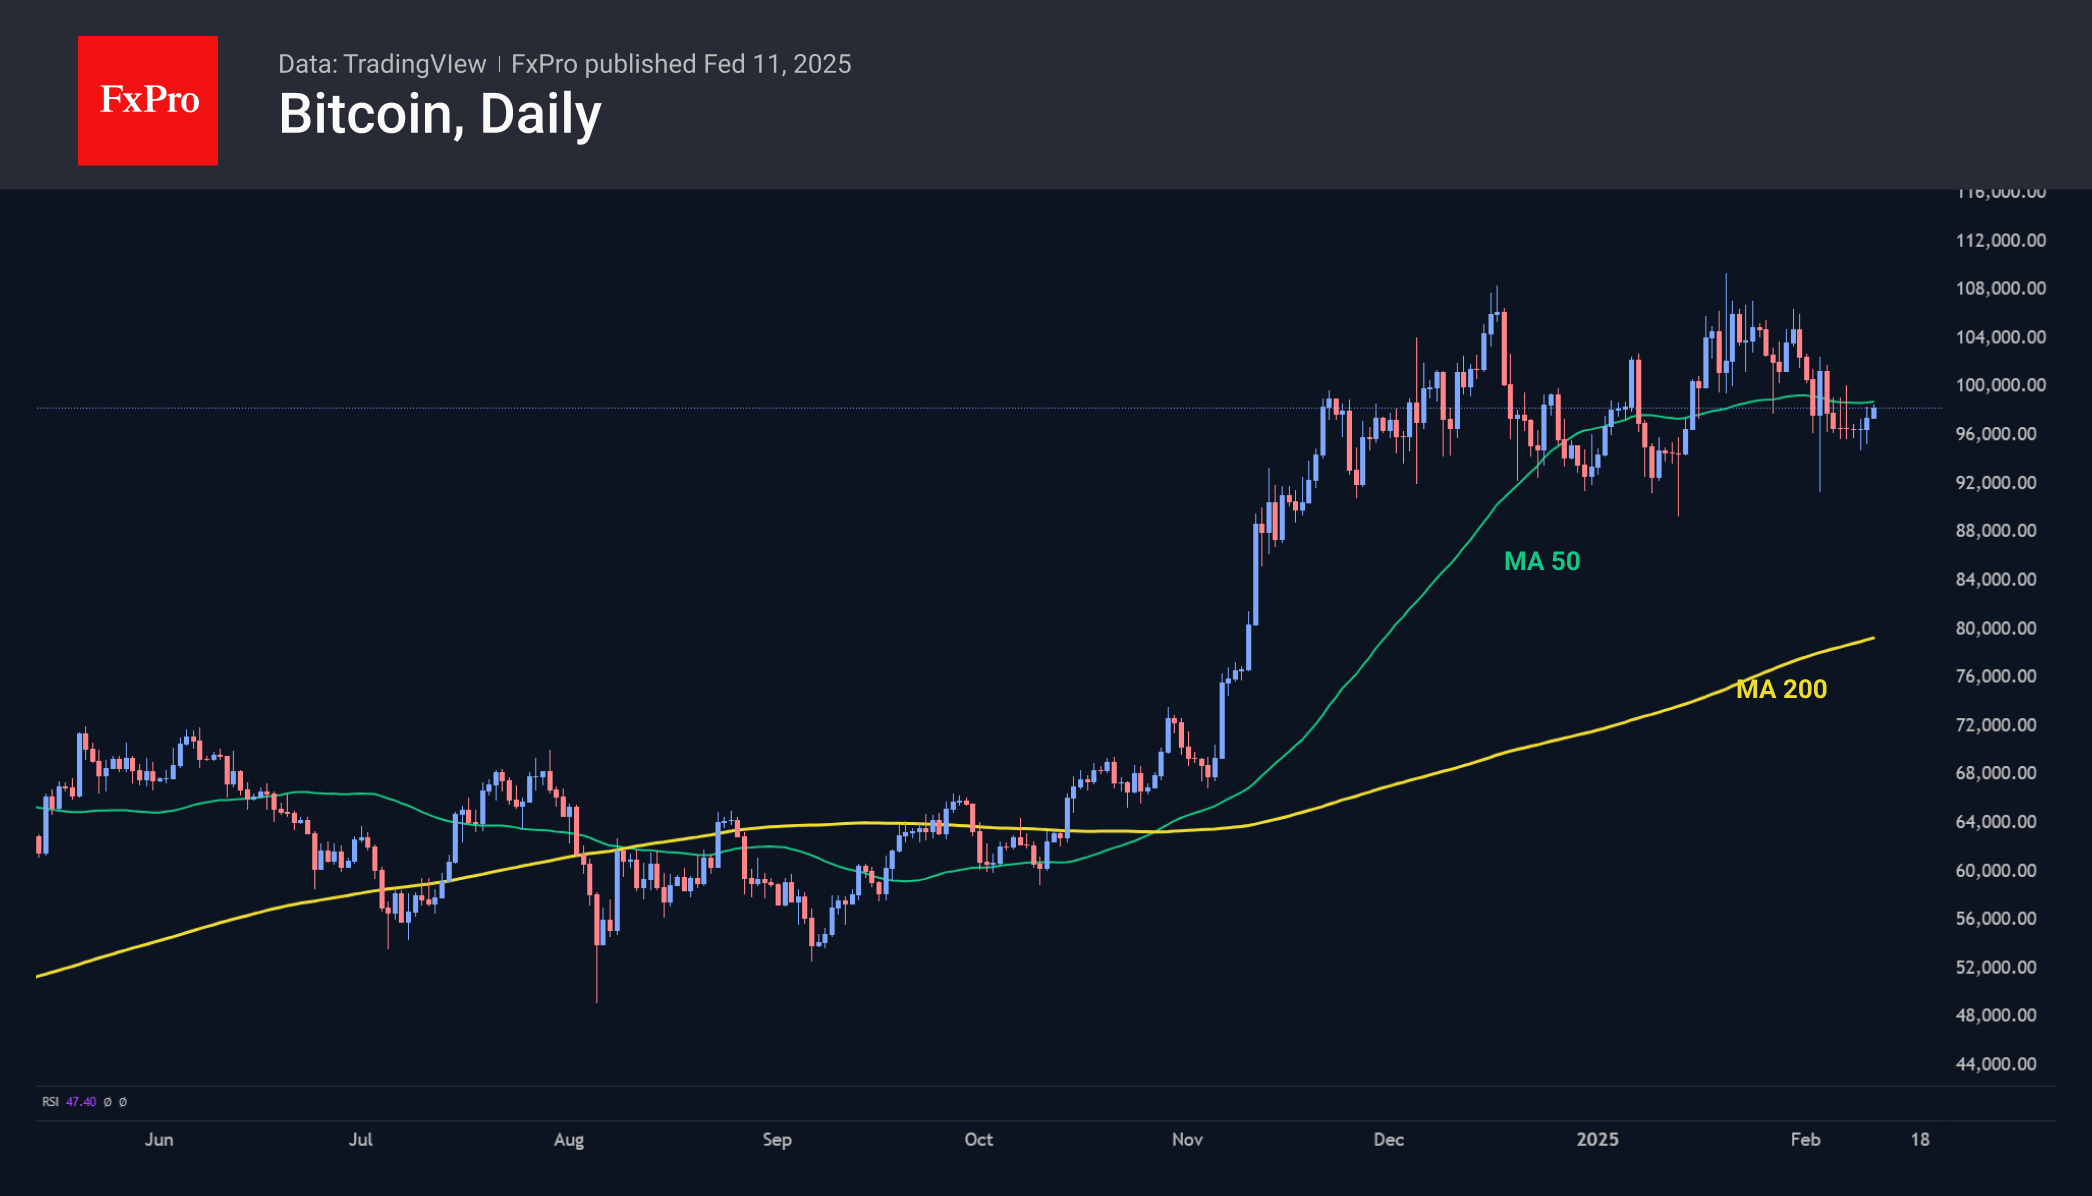
Bitcoin has traded below its 50-day moving average since early February and has stopped rising since mid-December, remaining within a long correction. A fall below 92,500 could trigger a deeper sell-off. However, given the positivity in other markets, there are signs that the decline is attracting new buyers.
News Background
According to CoinShares, global investment in crypto funds more than doubled last week to $1.26bn, with Bitcoin investments up $407m, Ethereum up a significant $793m, XRP up $21m, Solana up $11m, and Sui up $4m.
Ethereum took centre stage last week as its price dropped to nearly $2,100, prompting significant buying, according to CoinShares.
Tiger21 founder Michael Sonnenfeld said Bitcoin has become a capital preservation tool for wealthy investors. Among his network of ultra-wealthy investors, BTC holdings typically range from 1% to 3% of their portfolios. In the latest adjustment, Bitcoin’s mining difficulty rose by 5.61%, hitting a record high of 114.17T. Just two weeks ago, it saw its first decline since September 2024, driven by a cold snap in the U.S.
The Nasdaq exchange filed Form 19b-4 with the SEC to launch spot ETFs from CoinShares based on XRP and Litecoin. With the new instruments, the European issuing firm will expand its presence in the US market amid an expected softening regulatory environment.
GBP/USD Bears Regain Control
- GBP/USD returns to bearish territory after rejection from 1.2500.
- A move below 1.2350 could renew downside pressures.
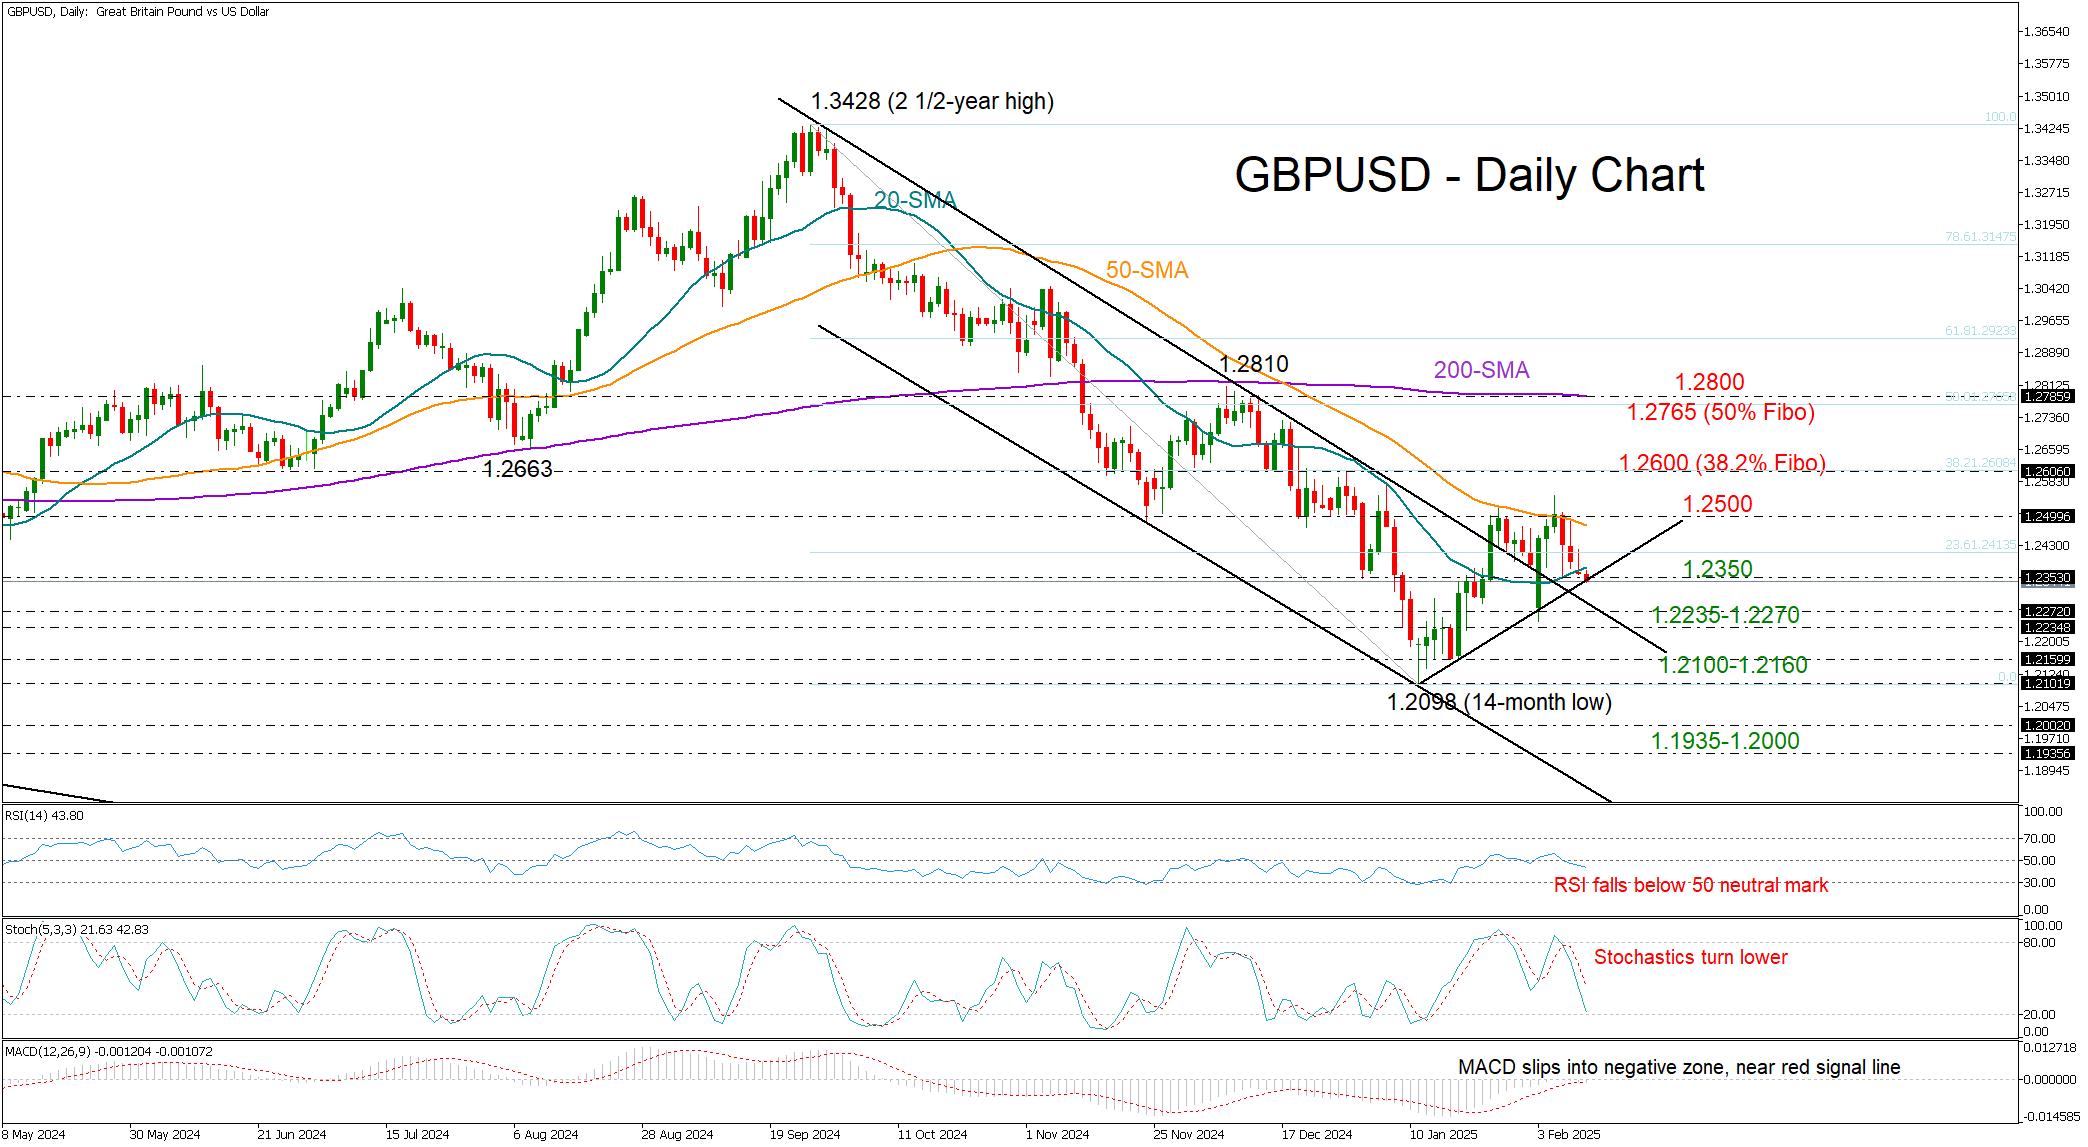
GBPUSD has taken a negative turn again after its strong bullish start to the month failed to break above the 1.2500 resistance and the 50-day simple moving average (SMA). The pair couldn't sustain levels above its 20-day SMA on Monday and is currently seeking support from a short-term trendline at 1.2350. With technical signals leaning to the bearish side, a continuation lower seems more likely as the Fed chief is heading to Capitol Hill for a two-day testimony.
Additional losses could initially pause within the 1.2235-1.2270 constraining zone. If selling interest persists, the price could challenge the bottom of its September-December downtrend at 1.2100-1.2160. Failure to pivot there could spark a decline towards the 1.2000 psychological level, with the 1.1935 territory, last seen in February-March 2023, also coming into sight.
Conversely, if the pair establishes a strong foothold near 1.2350 and climbs back above its 20-day SMA, it may stage another battle between its 50-day SMA and the 1.2500 barrier. A victory there could clear the way towards the 38.2% Fibonacci retracement of the September-December downtrend of 1.2600. A steeper rally could target the 50% Fibonacci level and the 200-day SMA within the 1.2765-1.2800 area.
In summary, GBPUSD is facing a bearish short-term outlook, with sellers waiting for a close below 1.2350 to target lower levels.
SPX Reacting Higher From Extreme Equal Legs Area
In this technical blog, we will look at the past performance of the 1-hour Elliott Wave Charts of SPX. We presented to members at the elliottwave-forecast. In which, the rally from 13 January 2025 unfolded as an impulse structure. And showed a higher high sequence favored more upside extension to take place. Therefore, we advised members not to sell the index & buy the pullback in 3, 7, or 11 swings. Based on Elliott wave hedging area looking to get 3 wave reaction higher at least. We will explain the structure & forecast below:
SPX 1-Hour Elliott Wave Chart From 2.01.2025
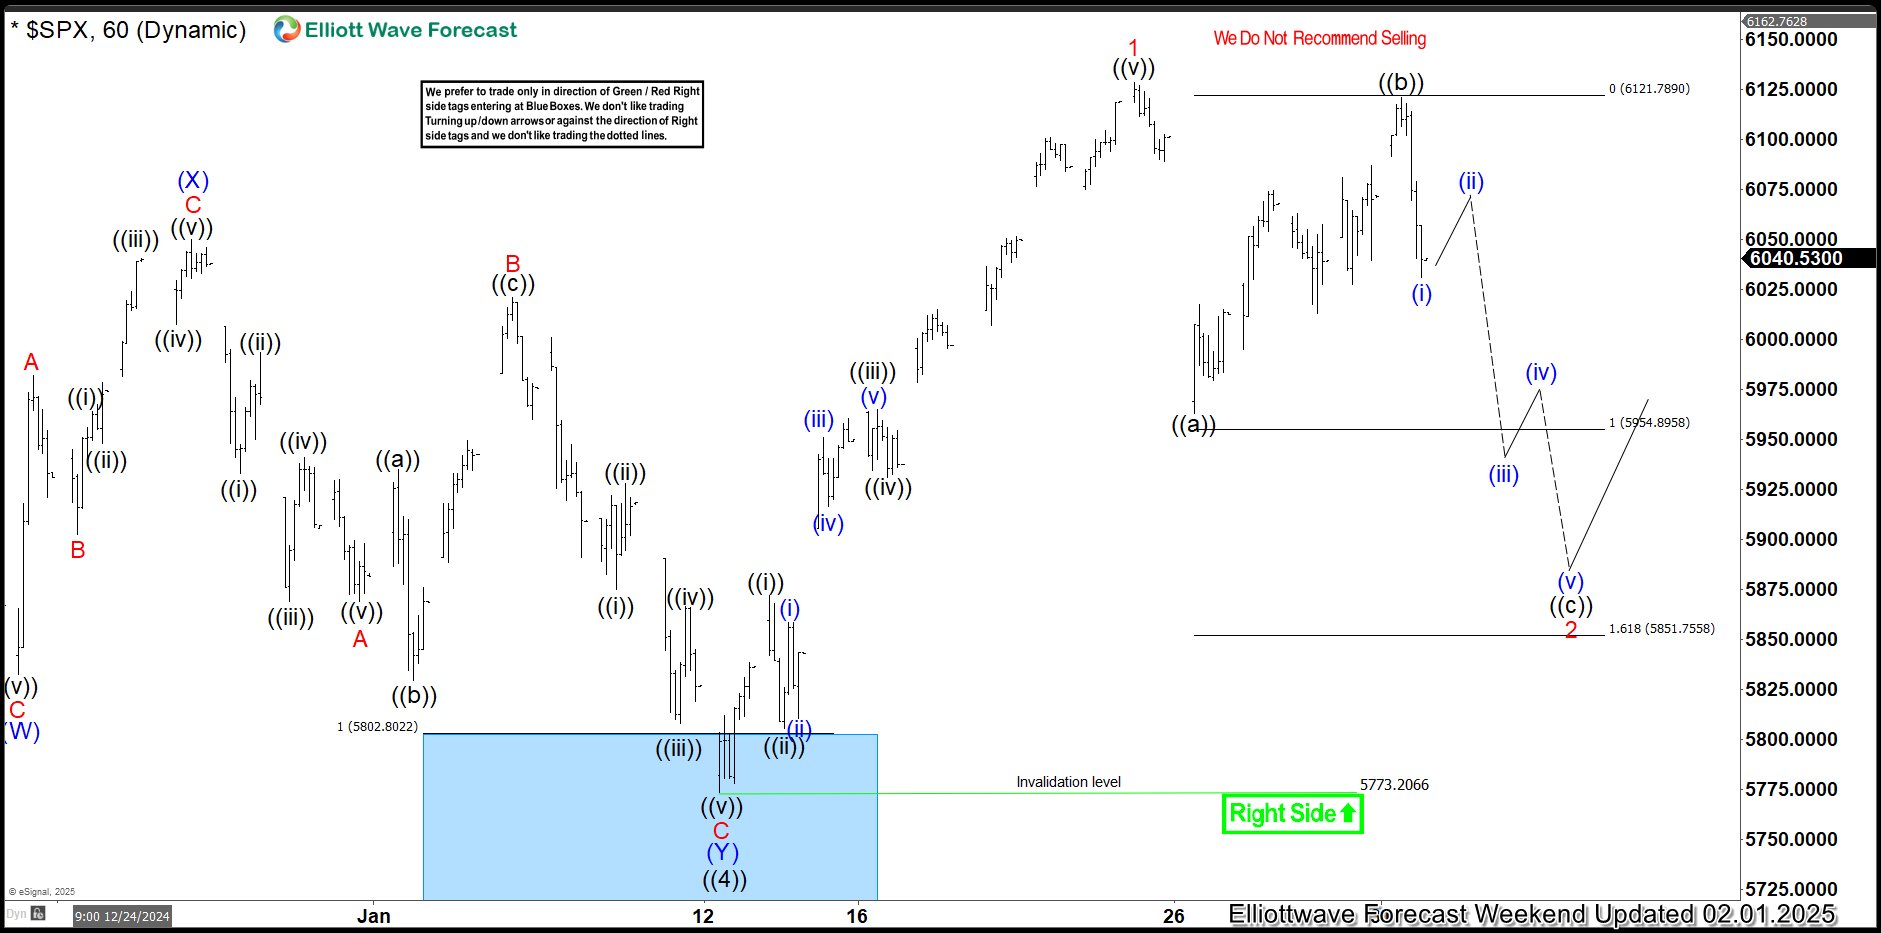
Here’s the 1-hour Elliott wave chart from the 2.01.2025 update. In which, the cycle from the 13 January low ended in wave 1 as an impulse structure at $6128.18 high. Down from there, the index made a pullback in wave 2 to correct that cycle. The internals of that pullback unfolded as Elliott wave zigzag structure where wave ((a)) ended at $5962.92 high. Then wave ((b)) bounce ended at $6120.91 high and wave ((c)) was expected to reach the Elliott wave hedging area at $5954.89- $5851.75 area. From there, buyers were expected to appear looking for next extension higher or do a 3 wave reaction higher at least.
SPX Latest 1-Hour Elliott Wave Chart From 2.11.2025
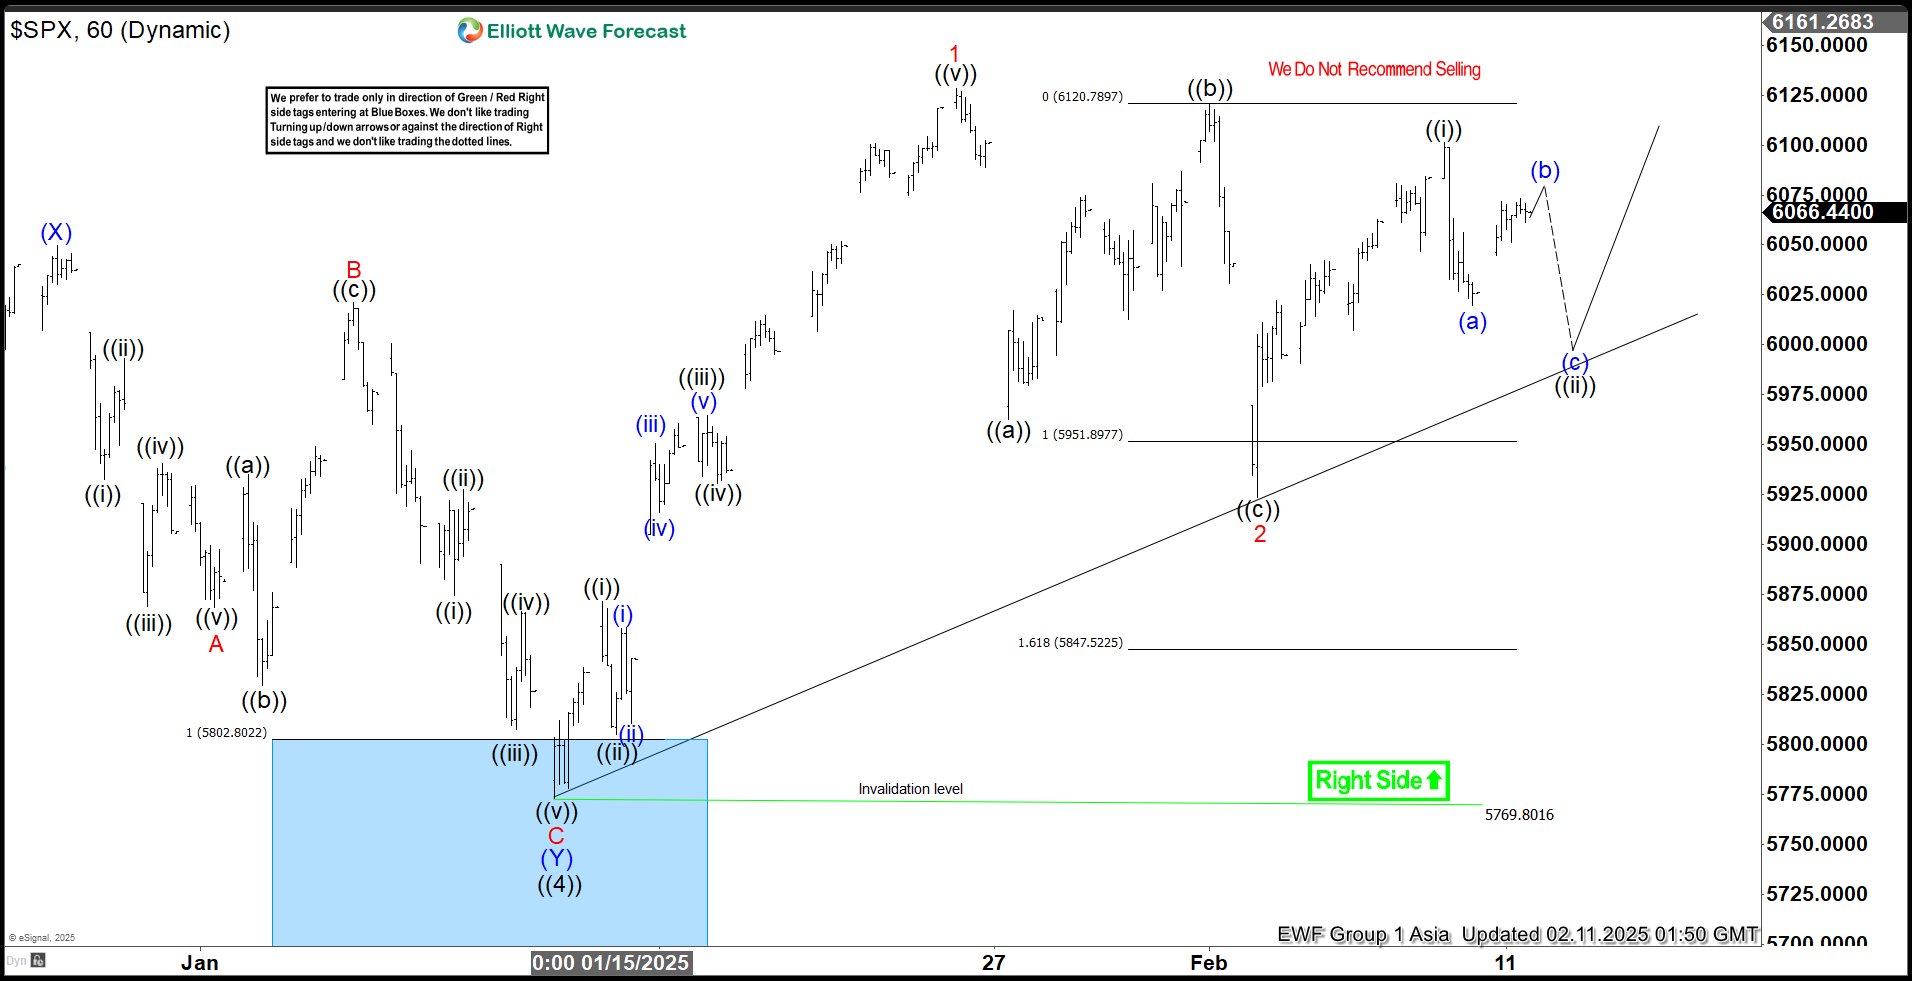
This is the latest 1-hour Elliott wave Chart from 2.11.2025 Asia update. In which the SPX is showing a strong reaction higher taking place, right after ending the zigzag correction within the equal legs area. Allowed members to create a risk-free position shortly after taking the long position. However, a break above $6128.18 high is needed to confirm the next extension higher & avoid double correction lower.
How Trump Influences Bitcoin’s Price
In a previous analysis of the BTC/USD chart titled "Bitcoin Holds Above $100K. For Now?", we hinted at the cryptocurrency market’s vulnerability to a downturn following heightened volatility triggered by Trump’s inauguration (Arrow A).
The BTC/USD chart shows that after this event:
→ B: Bitcoin’s price saw a sharp decline after Trump imposed high tariffs on Canada, China, and Mexico. Financial markets reacted with shock, causing BTC/USD to drop over 12% in just two days, leading to the largest liquidation event in cryptocurrency history.
→ C: Bitcoin later recovered as Trump delayed tariffs on Mexico and China. Additionally, market sentiment improved after the U.S. president announced plans to establish a sovereign wealth fund within a year. Forbes speculated that this fund could potentially be used by the U.S. government to acquire Bitcoin.
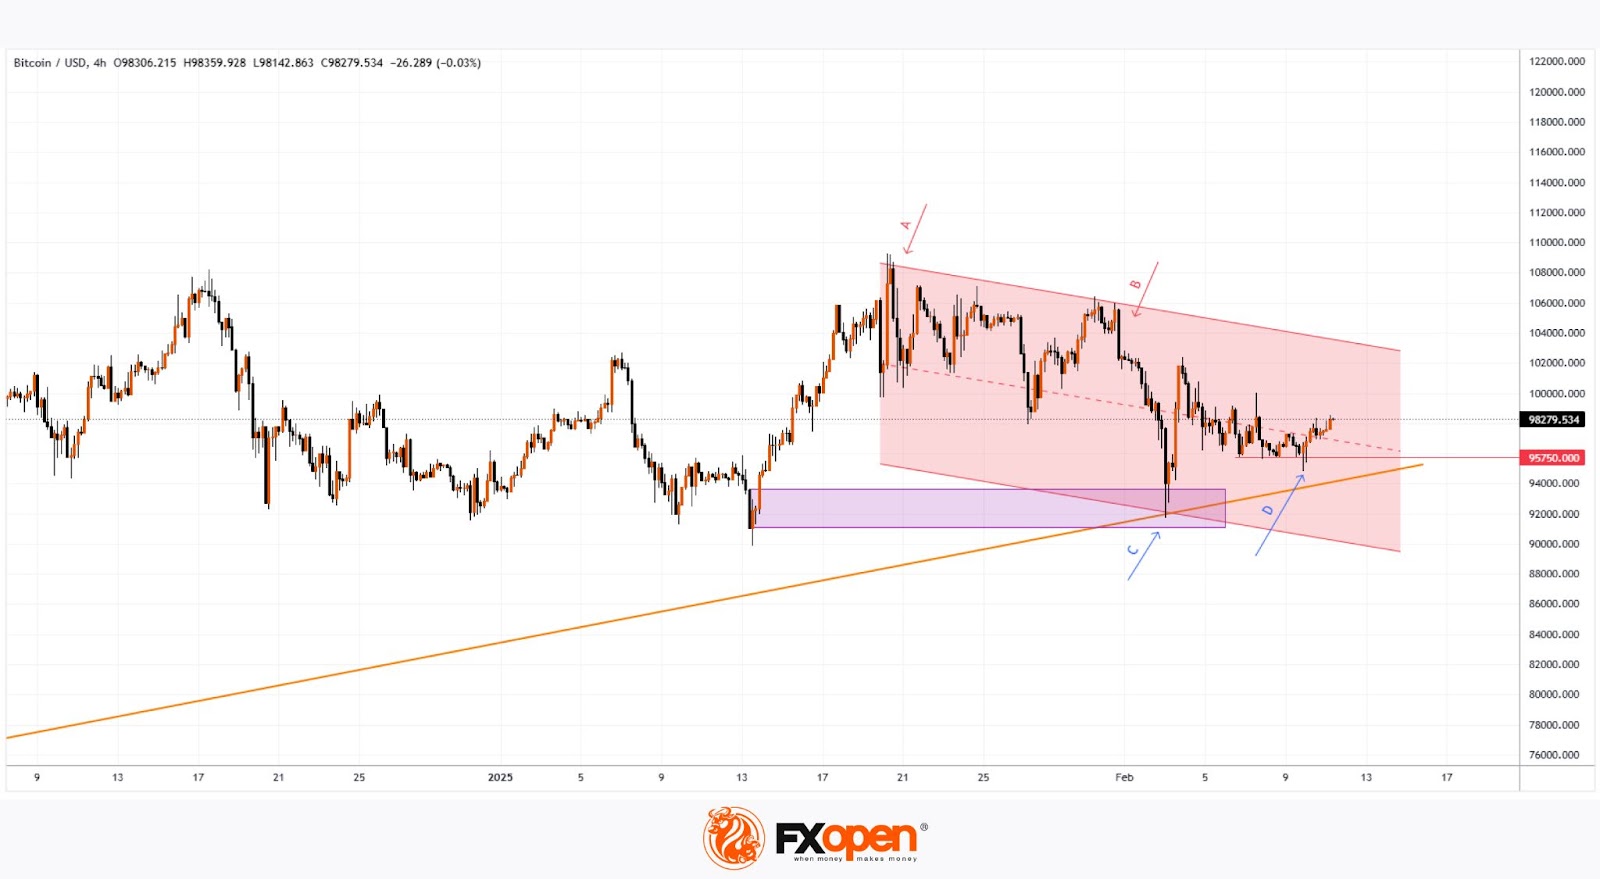
BTC/USD Technical Analysis
Bitcoin’s price movements indicate a bearish trend, highlighted by the red descending channel. However, signs of buying activity could offer hope to market participants:
→ A test of the Order Block (marked in purple).
→ February’s low may serve as a key support trendline (marked in orange), originating in 2024.
→ D: Bears failed to sustain the decline after breaking below the 95,750 level.
FXOpen offers the world's most popular cryptocurrency CFDs*, including Bitcoin and Ethereum. Floating spreads, 1:2 leverage — at your service. Open your trading account now or learn more about crypto CFD trading with FXOpen.
*Important: At FXOpen UK, Cryptocurrency trading via CFDs is only available to our Professional clients. They are not available for trading by Retail clients. To find out more information about how this may affect you, please get in touch with our team.
This article represents the opinion of the Companies operating under the FXOpen brand only. It is not to be construed as an offer, solicitation, or recommendation with respect to products and services provided by the Companies operating under the FXOpen brand, nor is it to be considered financial advice.
Potential Fallout of tariffs’ Flood Will Continue to Dominate Headlines Today
Markets
Yesterday US president Trump’s ‘announcement policy’ on tariffs continued to dominate market headlines as the president indicated that he was preparing broad-based tariffs of 25% on steel and aluminum. This could only be seen as a next step in the trade war escalation, with potentially ever growing side effects/fall-out both inside and outside the US. Still, the impact on markets remained limited. Whas it because the lack of concrete details yet? Was it market fatigue? At least the issue of a lack of details was (partially) ‘solved’ overnight. Trump ordered the tariffs to take effect next month and to apply to both metals, but the action will also be extended to downstream products. Trump also signaled tariffs on countries that have put levies on US goods. Cars and semiconductors are also on the administration’s radar for potential tariffs. As said, at least yesterday, markets just stood by and watched. US yields maintained their post-payrolls rise, changing 1-2 bps across the curve. The German yield curve steepened slightly (-2.2 bps 2-y; -0.6 bps 30-y). Chair Lagarde in an address before the EU Parliament repeated the message from the January policy meeting that disinflation is on track. Equities also still weren’t bothered by the flaring up of the tariffs rhetoric. US indices gained up to 0.98% (Nasdaq). The Eurostoxx 50 added 0.62%. The dollar gained modestly (Close DXY 108.3, EUR/USD 1.031).
Overnight, an interview of BoE MPC member Catherine Mann in the FT catches the eye. In the past, Mann of was seen as belonging to the hawkish camp, but last week she dissented in favour a 50 bps rate cut as she sees a weaking jobs market and slowing consumer demand dampening businesses pricing power. A 50 bps cut would have been a clear sign according to Mann that easier financial conditions are needed. Sterling this morning weakens slightly further to EUR/GBP 0.8335.
The potential fallout of the tariffs’ flood for sure will continue to dominate the headlines today. Still the impact on markets this morning remains very orderly. Asian equities are trading mixed to mostly modestly lower, as do US and European equity futures. The dollar also shows no clear trend (EUR/USD 1.0305, DXY 108.3). The eco data calendar in the US and Europe today still only contains second tier data. US NFIB small business sentiment won’t be a big issue for markets, but might be a pointer for sentiment in the domestic-oriented part of the economy. Fed’s Powell testifies before the Senate. He probably will sticks to the assessment of the January Fed meeting that a solid US economy/labour market and still too elevated inflation are a good reason for the Fed to wait and see upcoming developments. The US Treasury will sell $58 bln of 3-y notes tonight. After Friday’s post-payrolls rebound, the downside in US yields looks well protected. The dollar maybe still enjoys some ‘by default’ bid due to lingering uncertainty on global trade. Even so, for now this is not enough to break any important resistance levels.
News & Views
The Financial Times reports on an EU paper it has seen in which the EC plans for a radical budget overhaul for the next common budget (starting 2028). They call for a more ambitious budget in size and design to meet spending demands on defense and debt repayments. The commission is also looking to revolutionise the budget’s structure, bringing over 50 rigid spending programmes together into three main funds to provide more flexibility. A simplified budget would agree on a single plan for each country with key reforms and investments, giving national governments a bigger say in deciding projects. The creation of a European competitiveness fund to boost investment in key sectors and common projects and a revamped fund for foreign policy, to align strategic interests are the other pillars.
The British Retail Consortium said that retail spending accelerated at the start of 2025 following a disappointing 2024. Total sales were 2.6% Y/Y higher in January, down from +3.2% in December but significantly above last year’s 0.8% average. Details showed both food (+2.8% Y/Y) and non-food sales (+2.5% Y/Y) rising. Demand was solid even as the comparison base was rather low and as bouts of story weather put a temporary dampened on demand. BRC chief executive Dickinson warns though that retailers faced £7bn of extra costs later this year because of rising minimum wages, a new packaging levy and especially higher employer social security contributions: “many businesses will be left with little choice but to increase prices, and cut investment in jobs and stores".
Hang Seng Index: Positive Momentum Overrides Lackluster Fundamentals
- The emergence of China’s AI start-up, DeepSeek has triggered a positive feedback loop into the Hang Seng Index.
- Mixed consumer spending and weak factory activity in China suggest deflationary pressures are likely to persist.
- Momentum and trend have turned positive for the Hang Seng Index in the medium term.
Since our last publication, the Hang Seng Index has declined and started to reverse upwards in the middle of January after it almost hit the first medium-term support zone of 18,430/17,990 (printed a low of 18,671 on 13 January).
Hang Seng Index outperformance over major US stock indices
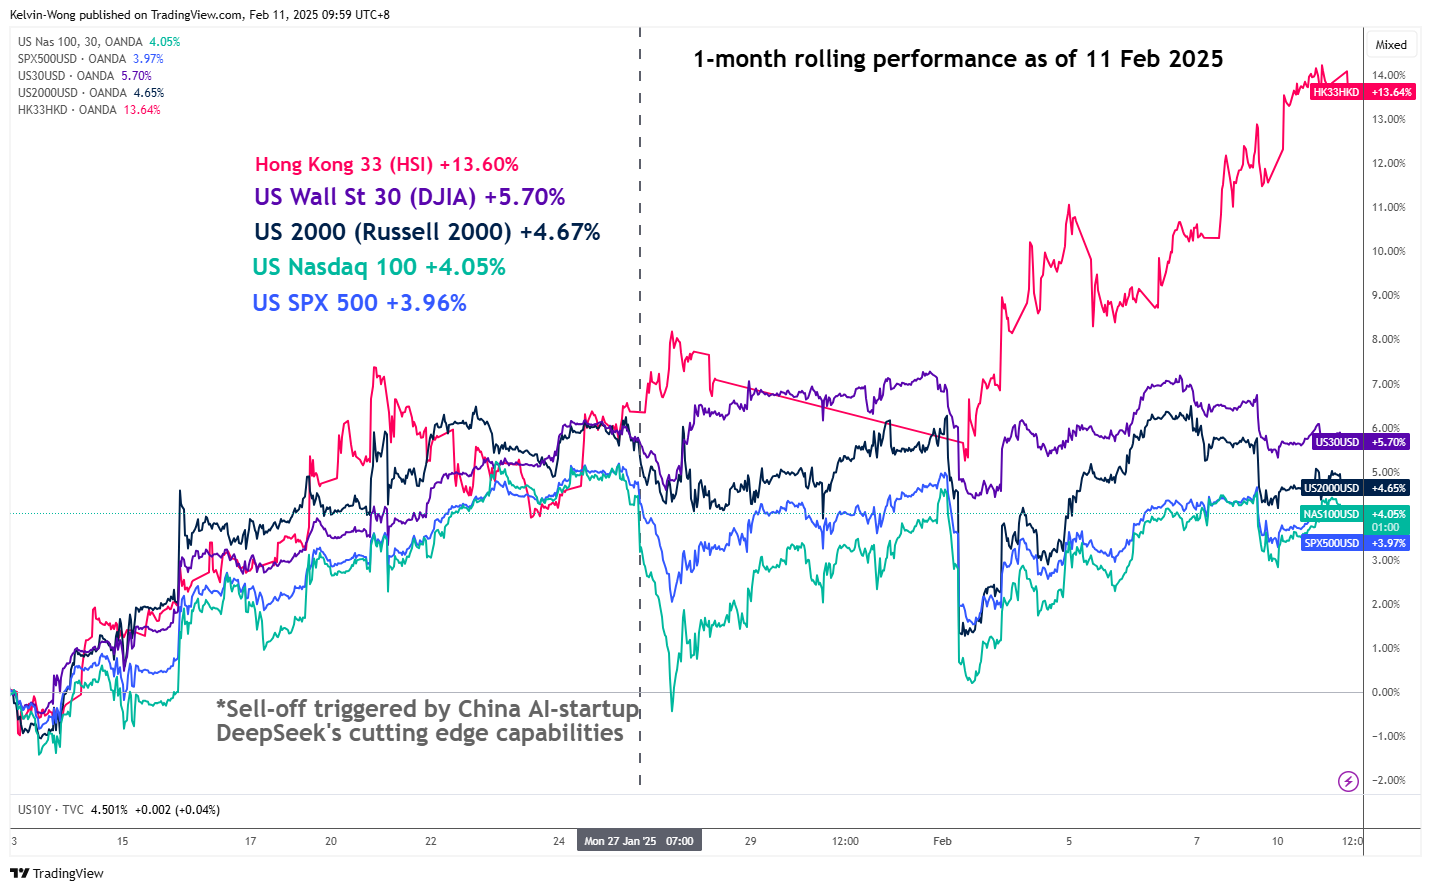
Fig 1: 1-month rolling performances of Hong Kong & US major CFD stock indices as of 11 Feb 2025 (Source: TradingView, click to enlarge chart)
Interestingly, Hang Seng stock indices (a proxy for international investors and traders to get exposure to China equities) have outperformed the major US stock indices on a one-month rolling basis at this time of the writing according to the prices of contract for difference (CFD) stock indices on these markets offered by OANDA.
The Hong Kong 33 CFD stock index (a representation of the Hang Seng Index) has started to outperform against the gravity-defying major US CFD stock indices. which have ridden on the tailwinds of the “Artificial Intelligence (AI) induced high productivity” theme play in the past year.
Based on a one-month rolling performance basis, the Hong Kong 33 CFD stock index has recorded a gain of 13.60%, three times more than the average return of 4% seen on the technology mega-cap heavy US Nasdaq100 and US SPX 500 CFD stock indices over the same period (see Fig 1).
Several catalysts drove the recent positive performance of the Hang Seng benchmark stock indices (Hang Seng Index, Hang Seng TECH & Hang Seng China Enterprises Index) in the recent four weeks. Firstly, the emergence of a relatively under-the-radar China AI start-up, DeepSeek that operated based on open-source large language models that can perform almost on par with current generative AI leader OpenAI at significantly lower operating costs without much dependency on higher-end and pricey US-based Nvidia’s graphics processing unit (GPU) semiconductor chips.
Hence, market participants have started to reprice the earnings growth expectations of the US mega-cap technology stocks that are trading at lofty valuations over China Big Tech AI equities that have now developed cutting-edge technology capabilities at lower costs despite US trade barriers and sanctions on higher-end semiconductor hardware towards China.
Secondly, it is related to geopolitical factors. Trade War 2.0 is different from Trade War 1.0 enacted in January 2018 in terms of coverage as this time round it involves major trading partners of the US, on top of the ongoing US-China rivalry.
Countries that have a significant trade surplus with the US will be at risk of being targeted by Trump’s trade tariffs policy; the European Union, Japan, South Korea, and ASEAN export-dependent countries such as Vietnam, and Malaysia.
Hence, long-term allies of the US hit with trade tariffs may be swayed to “join” China’s sphere of influence, which in turn, drives foreign fixed asset investment inflows into China that may benefit China’s economy in the long run.
Deflation risk persists in China
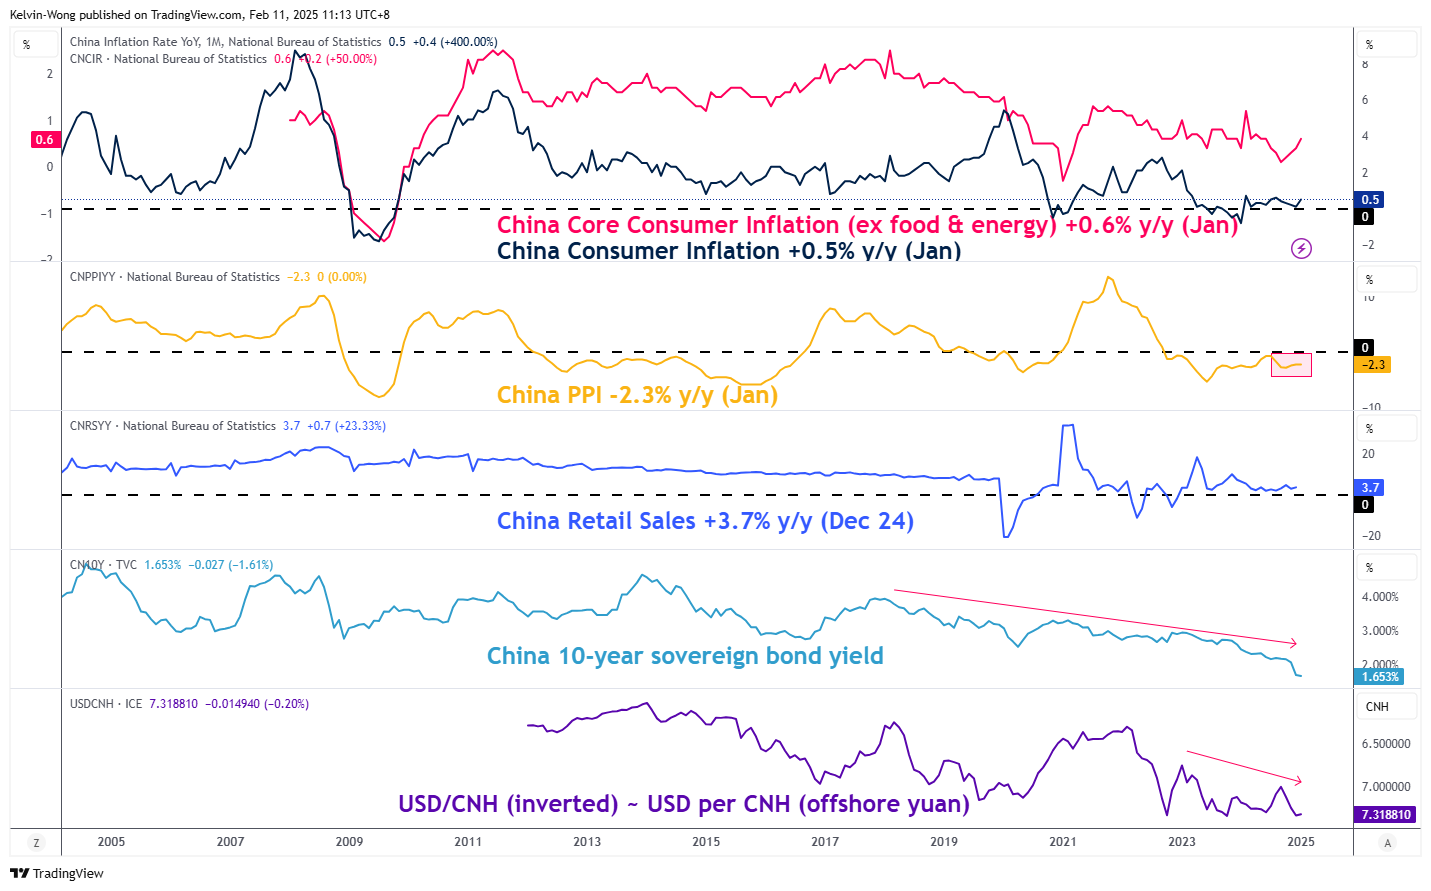
Fig 2: China’s consumer inflation & PPI trend as of January 2025 (Source: TradingView, click to enlarge chart)
China’s latest consumer inflation for January has accelerated to 0.5% y/y, its fastest rate of increase in five months, core inflation excluding food and energy rose at a slightly higher rate of 0.6% y/y while producer price deflation persisted as the producer price index continued to languish at -2.3% y/y in January amid weak factory demand (see Fig 2).
In addition, the offshore yuan (CNH) continued to face downside pressure against the US dollar The USD/CNH has rallied back up from a nine-week low of 7.2344 and is trading at 7.3120 at this time of the writing with its October 2023 high of 7.3750 coming into view.
Therefore, deflationary pressures persist in China unless policymakers are willing to implement direct stimulus measures to jolt up consumer and business sentiment.
Hang Seng Index has traded above its 50-day moving average
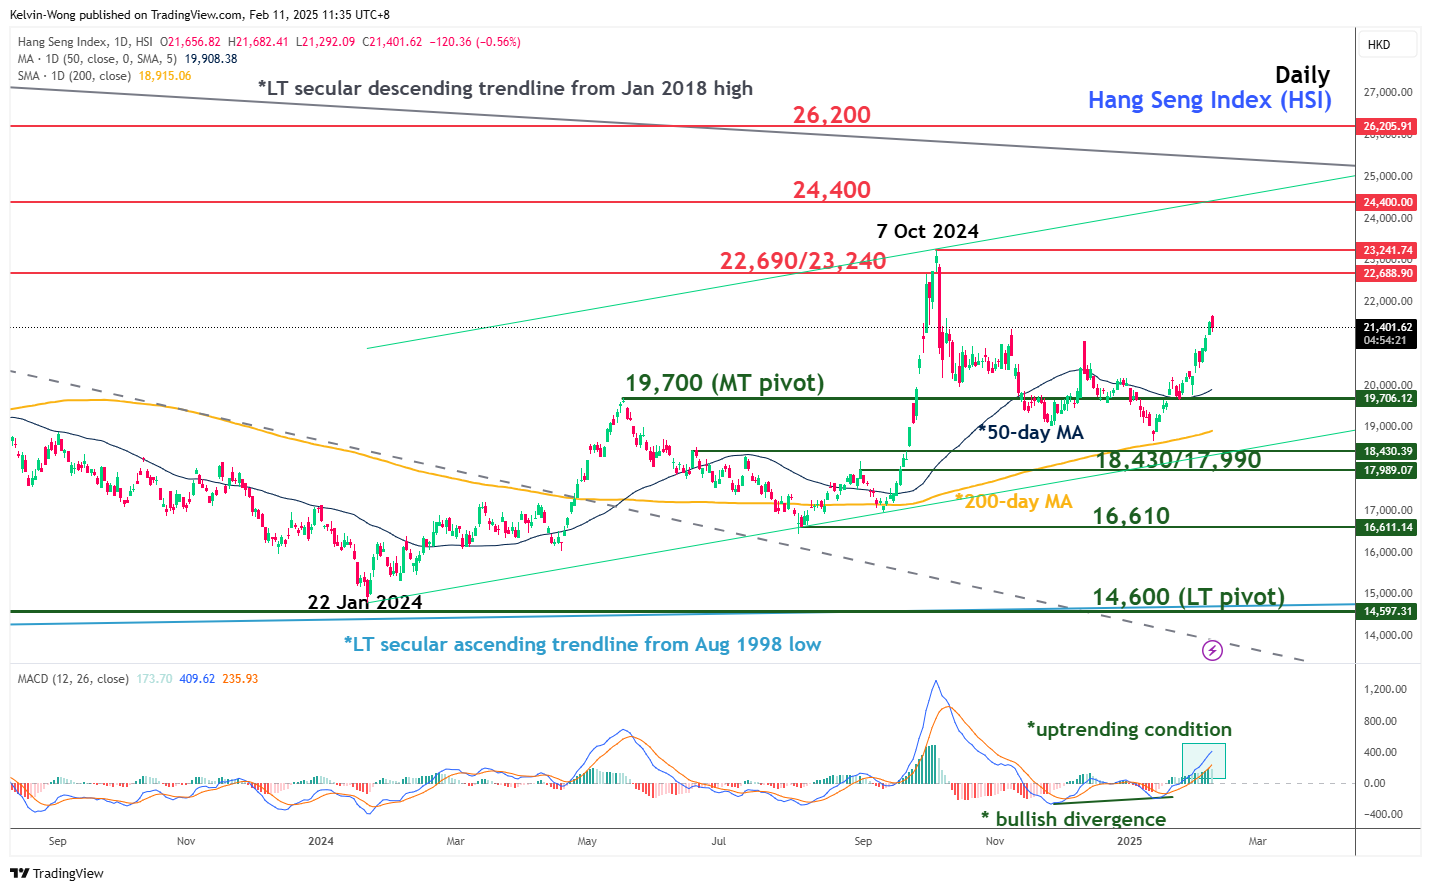
Fig 3: Hang Seng Index medium-term trend as of 11 Feb 2025 (Source: TradingView, click to enlarge chart)
The price actions of the Hang Seng Index surpassed its 50-day moving average on 20 January and retested it on 23 January before it staged a rally of 9.6% to a close of 21,522 on Monday, 10 February.
In addition, the MACD trend indicator has continued to accelerate upwards above its centreline above a prior bullish divergence condition. These observations suggest that the Hang Seng Index is likely to have transformed into a medium-term (multi-week to multi-month) uptrend phase.
Watch the 19,700 medium-term pivotal support and a clearance above 22,690/23,240 may see the next medium-term resistance zone coming in at 24,400/980 (see Fig 3).
On the flip side, failure to hold above 19,700 jeopardizes the bullish tone for another round of corrective decline to retest the next medium-term support zone of 18,430/17,990 (also the 200-day moving average).
All Eyes on Powell
The US dollar extended gains and gold hit a fresh ATH fuelled by fresh tariff threats from Donald Trump. In addition, China now allows insurers to buy gold and hold 1% of their holdings in the precious metal as other investment options are not ideal at the moment. And this policy shift in favour of gold could translate into a more than $27 bn of inflows according to Minsheng securities. More from China: the latest data showed that China’s official gold holdings rose significantly over the past two years. In fact, the country increased its official reserves by around $105.5bn in two years and 77% of that rise was accounted for by gold. Over one year, 124% of the increase was due to the increase in gold holdings meaning that China is increasing its gold holdings in expense of treasury holdings to hedge itself against the tight trade and geopolitical environment that could get tenser and uglier very quickly. And it’s not only China, many other countries including Turkey, India and the Easters European countries buy gold - and commit to buy more – to build their reserves on a supranational asset that doesn’t carry the US/Trump risks. Consequently, yes, gold remains the ultimate Trump hedge – as I said earlier this year – and Trump makes the $3000 per ounce target easily achievable.
Elsewhere, the early moodiness due to Trump’s new tariff threats quickly waned. The euro and Loonie recovered losses against the greenback, while the stock markets in Europe gave a mere reaction to Trump news – if it gave any reaction at all. The energy and mining heavy FTSE 100 led gains in Europe, goldminer Fresnillo jumped almost 5% to a year-high, while BP rallied more than 7% on news that the activist investor Elliott Investment Management has acquired a substantial stake in the company to increase focus on traditional oil and gas operations and rely less on investments in renewable energy.
BP is announcing quarterly results this morning.
Across the Channel, the Stoxx 600 extended gains to a fresh ATH as well, while in the US, the S&P500 gained. US Steel Corp and Alcoa were happy about the tariff news, while the tech stocks led the rally. Nvidia extended gains by more than 2.50% as the French PM promised to invest more than 100bn euro in AI at a tech summit in France. Still, when we talk about AI and tech progress in Europe, we talk a lot about how to regulate. As such, regulation will likely be a speed bump to European tech companies in a global race where others don’t face the same barriers.
But appetite for rotation towards the European cyclical stocks is expected to maintain the positive momentum in the European indices – even though the underlying fundamentals are not ideal. After all, the slower the economies and the murkier the outlook, the more supportive the European Central Bank (ECB) will be. The only thing, the ECB needs is to keep inflation under control. The rest is just a detail for stock valuations.
In the FX, the US dollar remains in demand as the Federal Reserve (Fed) Chair Jerome Powell begins his two-day testimony in front of US politicians today and is expected to adopt a cautious approach despite mounting pressure to lower rates from the Trump government. After all, US growth remains solid, the jobs market healthy, and inflation sticky. And Trump’s growth-boosting policies and tariff threats threaten to make it stickier. As such, a hawkish stance from Powell could further boost the dollar appetite and temper gains in US equities. Also note that, besides the fact that a hawkish shift in Fed policy is bad for valuations – the appreciation of the dollar tends to weigh on Big Tech companies’ earnings from outside the US. That’s an added headwind for companies like Tesla, Nvidia, Amazon, and Alphabet, whose slowing earnings growth is already unsettling investors.
In energy, US crude jumped nearly 2% yesterday despite the renewed tariff threats that could’ve been negative for sentiment as it is not promising for global growth expectations, but the price of a barrel is drilling above the 50-DMA this morning. Trend and momentum indicators hint that the bullish move has room to expand, but resistance is seen at $74.50 mark, near the 200-DMA and the major 38.2% retracement on the latest selloff.
Hard Euro Area Data and Soft US Data on the Menu
In focus today
From the US, the NFIB's January Small Business Optimism index is due for release. Business sentiment improved significantly in November and December after the election uncertainty eased. The Fed's Hammack and Williams will also give speeches today.
In the euro area, focus turns to industrial production data for December, which is expected to show a small increase of 0.4% m/m by consensus. However, the decline will likely be larger than 0.4% m/m as German industrial production declined 2.4% m/m in a sign of a still weak industrial sector.
In Norway, the growth picture has been relatively mixed in Q4. Based on an overall review, we believe that mainland GDP rose 0.1% q/q in Q4, well below Norges Bank's estimate of 0.3% from the December MPR. This is supported by employment which appears to have fallen slightly in Q4, signalling that GDP growth has been moderate unless productivity growth has picked up significantly.
Economic and market news
What happened yesterday
In the US, President Donald Trump signed the executive order increasing tariffs on steel and aluminium imports to the US by 25%. The tariffs are expected to take effect on 4 March according to a person familiar with the plan. This is likely to heighten the risk of trade tensions and provoke retaliatory measures from global trade partners.
In the euro area, the Sentix indicator for February was stronger than expected rising to -12.7 (cons: -16.3), indicating that investors are less pessimistic. That said, the indicator remains low in a historical context.
In Norway, the inflation report for January surprised slightly to the upside, with core inflation at 2.8% y/y (cons: 2.6%) - and at the same time exceeding Norges Bank's estimate of 2.6% y/y from the December MPR. Decomposing the print, the upside surprise stemmed entirely from imported inflation, which can be explained partly by a smaller 'January sales'-effect than last year. However, as the NOK has stabilised, the risk of a continued rise in imported inflation seems limited. On the positive side, domestic inflation and overall service inflation fell on a yearly basis. Overall, the release clearly reveals that the disinflationary trend is intact, which should lend support to the case of a rate cut in March.
In Sweden, the final pieces of data, December production and consumption, forging the Q4 outcome was released. Coupling this with the already published data, these suggests that we could see a decent Q4 GDP print when national account GDP is released by end of this month. Except for employment all other indicators suggest stronger q/q growth than suggested by the GDP indicator - which points to a meagre 0.2% q/q.
In Denmark, January CPI fell to 1.5% from 1.9%, mainly attributed to electricity prices, where large price increases last January mean prices have now actually fallen compared to last year. The price of natural gas also contributed to the decrease. January inflation is notoriously uncertain, both because of new price weightings, certain prices that are only updated once a year, and uncertainty about the size of January sales. Inflation is well under control at home, which is good news for people in Denmark. Not only does it mean increased purchasing power, but it also strengthens the outlook for lower interest rates as inflation has also come down in the euro zone. We expect the ECB to continue lowering rates until after the summer holidays and expect Nationalbanken to mirror the ECB's decisions going forward.
In the Middle East, Hamas announced that it will stop releasing the Israeli hostages on the coming Saturday as agreed upon "until further notice" amid accusing Israel for not sticking to the ceasefire agreement. Retaliatory, Israel described this as a "complete violation of the ceasefire" and has instructed the Israeli military to prepare for "any possible scenario" in Gaza.
Equities: Equities kicked off the week on a strong note (MSCI World 0.5%). Broad based increases were equally driven by US and Europe, which is interesting considering the tariff announcement. Few investors would probably have imagined Stoxx 600 setting a new all-time high the same day. However, investors seem to have adapted to Trump-era volatility and some were probably already expecting this. Energy led the increases in Europe while steel and AI-related stocks rose in the US. Financials were the weak spot in all regions, as investors probably took home some profit with financials being one of the top performing sectors this year (6% YTD globally two months into the new year). US futures are edging somewhat lower this morning though, along with Asian markets.
FI: We saw modest movements in global bond yields yesterday as bond yields declined 1-2bp across the German and US government bond yield curves. There was a very modest bullish steepening of just 1-2bp on the German and US curves. The German ASW-spreads continue to tighten apart from the Schatz-spread. This is driven by the combination of supply, QT and political uncertainty ahead of the German election. However, the US ASW-spread is widening on the back of expectations for less bank regulation and no change in the supply between bonds and bills.
FX: EUR/USD is holding steady around 1.03 as today's calendar probably lacks any major macro market mover. Scandies continue to have a strong run, with EUR/SEK currently challenging the 6M low just shy of 11.25. The yen remains supported with USD/JPY consolidating at 152.
GBP/JPY Daily Outlook
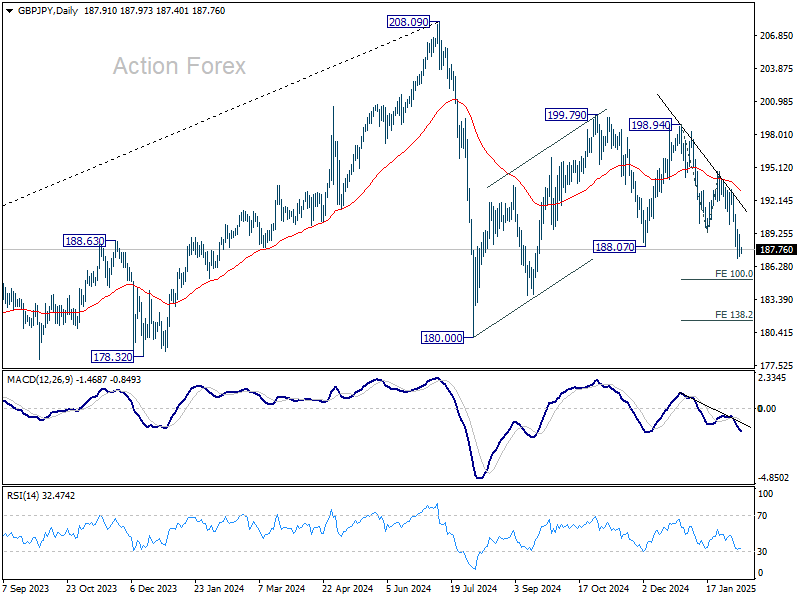
Daily Pivots: (S1) 186.95; (P) 188.05; (R1) 189.07; More...
With 189.57 minor resistance intact, intraday bias in GBP/JPY stays on the downside for 100% projection of 198.94 to 189.31 from 194.73 at 185.10. Decisive break there will target 138.2% projections at 181.42. On the upside, above 189.57 minor resistance will turn intraday bias neutral first. But risk will stay on the downside as long as 194.73 resistance holds, in case of recovery.
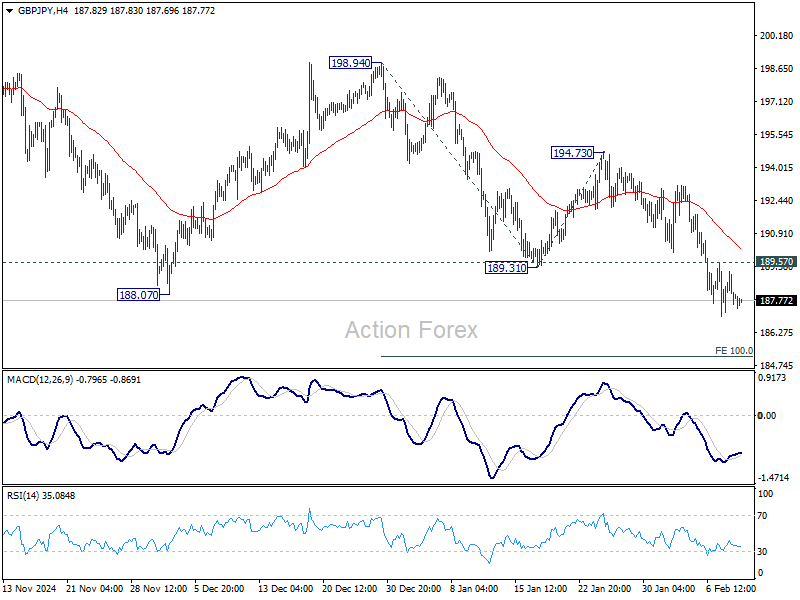
In the bigger picture, price actions from 208.09 are seen as a correction to rally from 123.94 (2020 low). Strong support should be seen from 38.2% retracement of 123.94 to 208.09 at 175.94 to contain downside. However, sustained break of 152.11 will bring deeper fall to 100% projection of 208.09 to 180.00 from 199.79 at 171.70, even still as a correction.