Sample Category Title
Sunset Market Commentary
Markets
US President Trump’s latest salvo of tariffs left global markets largely unfazed. It suggests they are either calling his bluff (having Canada and Mexico in mind) or are just tired already of running after each and every POTUS quote that’s hitting the screen. Trump this time targeted steel and aluminum, threatening a 25% levy on all imports but without saying when they would go into force. With Canada being the US’ main steel and aluminum partner, its currency is among the G10 underperformers today. USD/CAD is trading around 1.434. That’s only marginally up from 1.429 at the open, underscoring the aforementioned growing market apathy. Fall-out on the Mexican peso isn’t even worth mentioning. Mexico is the number two steel exporter (n° 3 for aluminum) to the US. There are little to no spillovers in emerging markets either, specifically in Central-Europe. CZK, PLN and HUF are all rising on a net daily basis. The dollar on a trade-weighted basis gapped a tad higher at the open before wiping out most gains again (DXY 108.22). EUR/USD isn’t going anywhere around 1.032.
What the series of tariff announcements do trigger are increasing concerns for US and by extension global growth, specifically through the rapid countermeasures that are being put in place. Canada, Mexico and China were cases in point while the EU has its anti-coercion instrument in place since Trump’s first term in 2016-2020. It’s what prompted a steady decline in (real) US yields towards their recent lows over the past couple of days & weeks. Friday’s strong payrolls report came to the rescue by lifting rates up to 8 bps at the front but part (around 3 bps) of that is evaporating again today. European rates ease less than 2 bps across the curve in sympathy. Stocks inch higher. Europe’s Stoxx600 hit a new record high. Wall Street opens higher as well.
News & Views
Statistics Norway today reported January headline CPI in the country printing at 0.2% M/M and 2.3% Y/Y (-0.1% M/M and 2.2% in December). CPI-ATE inflation (adjusted from tax changes and energy produces) reaccelerated to 0.1% M/M and 2.8% Y/Y from respectively -0.1% M/M and 2.7% Y/Y. Both figures were slightly above market expectations (2.2% headline, 2.6% core). In a monthly perspective, prices rose for food and drinks (+2.3%), housing related costs (0.9%), culture and leisure (0.5%) and other miscellaneous good and services (+1.4%). Monthly prices declined for clothing and footwear (-6.7%), household equipment (2.1%) and communications (-1.2%) amongst others. At its January policy meeting, the Norges Bank (NB) left its policy rate unchanged at 4.5%, but signaled a first rate cut for this cycle at the March 27 meeting. Today’s outcome is slightly higher than the projections in the NB monetary policy report of December (expected at 2.3% and 2.6% respectively). The NB anyway indicated that a restrictive policy will still be needed to keep inflation around the target. Markets after today’s CPI still see about a 90% chance of a 25 bps rate cut end March. However, the pace of/room for further rate cuts (seen at 3.8% in Q4 in the December policy report) might be less. February CPI still will be published before the March policy decision. The krone extended its recent rebound today gaining from EUR/NOK 11.63 to 11.57 currently.
Statistics Sweden reported a series of December activity data today. Orders in industry increased 2.0% M/M and were up by 5.8% Y/Y. A large part of the industrial subsectors recorded a positive M/M development, even as orders mainly increased in the export market while they were nearly unchanged on the domestic market. Export market increased by 6.8% and domestic market decreased by 0.1%. A similar trend was visible in industrial production. Private sector production rose 1.0% M/M and 3.0% Y/Y. However, this concealed industry production raising 5.7% M/M and 9.0% Y/Y. However production value in the services sector decreased 0.2% M/M to be only 1.6% higher Y/Y. Production in construction also rose 1.4% M/M and 3.4% Y/Y. Household consumption showed no strong momentum either, declining 0.3% M/M to be up only 0.7% Y/Y. Divergent signals from different sectors of the economy comes as the Riksbank reduced its policy rate to 2.25% end January. It indicated that the easing cycle might have come to and end depending on the outlook on inflation and activity going forward.
USD/JPY Mid-Day Outlook
Daily Pivots: (S1) 150.73; (P) 151.57; (R1) 152.26; More...
Intraday bias in USD/JPY remains neutral for the moment. Focus stays on 38.2% retracement of 139.57 to 158.86 at 151.49. Strong bounce from there, followed by break of 153.70 support turned resistance, will retain near term bullishness, and turn bas back to the upside for retesting 158.86. However, sustained trading below 151.49 will suggest that whole rise from 139.57 has completed, and bring deeper fall to 61.8% retracement at 146.32 next.
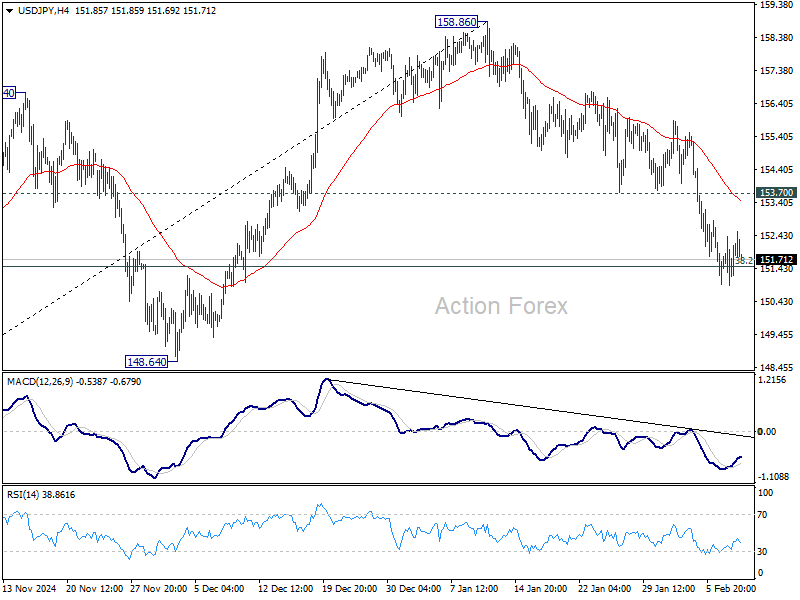
In the bigger picture, price actions from 161.94 are seen as a corrective pattern to rise from 102.58 (2021 low). In case of another fall, strong support should be seen from 38.2% retracement of 102.58 to 161.94 at 139.26 to bring rebound. However, sustained break of 139.26 would open up deeper medium term decline to 61.8% retracement at 125.25.
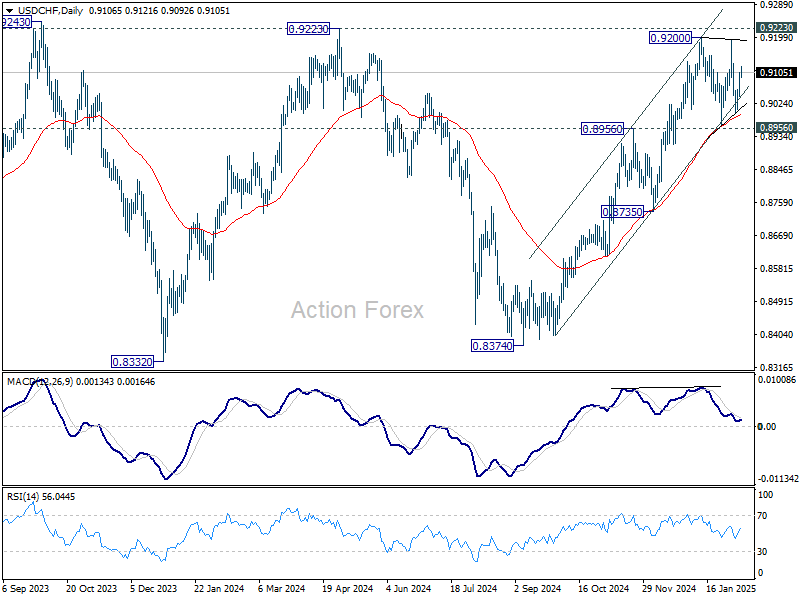
USD/CHF Mid-Day Outlook
Daily Pivots: (S1) 0.9059; (P) 0.9083; (R1) 0.9122; More…
USD/CHF is still extending the consolidation form 0.9200 and intraday bias remains neutral. Outlook stays bullish with 0.8956/64 support zone intact. On the upside, firm break of 0.9200/9223 will resume the whole rally from 0.8374 and carry larger bullish implication. However, sustained break of 0.8964 will be a sign of reversal and turn bias back to the downside.
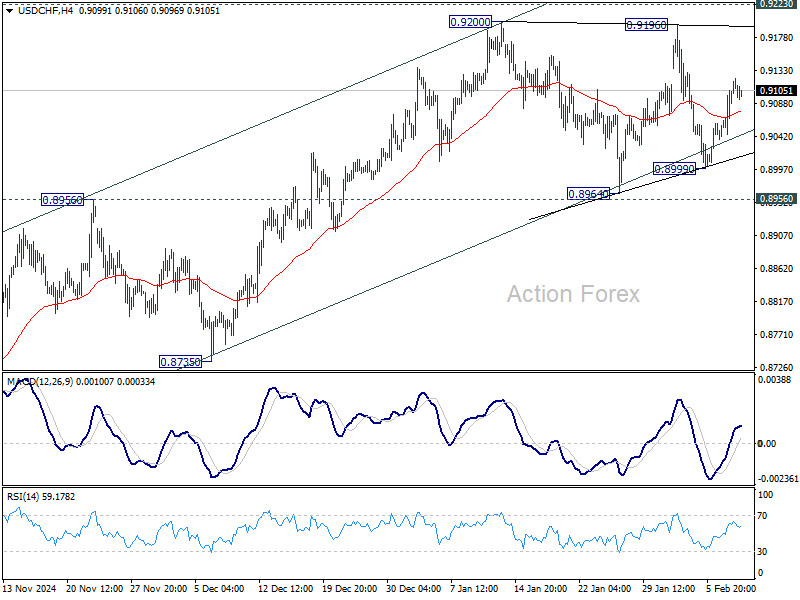
In the bigger picture, decisive break of 0.9223 resistance will argue that whole down trend from 1.0342 (2017 high) has completed with three waves down to 0.8332 (2023 low). Outlook will be turned bullish for 1.0146 resistance next. Nevertheless, rejection by 0.9223 will retain medium term bearishness for another decline through 0.8332 at a later stage.
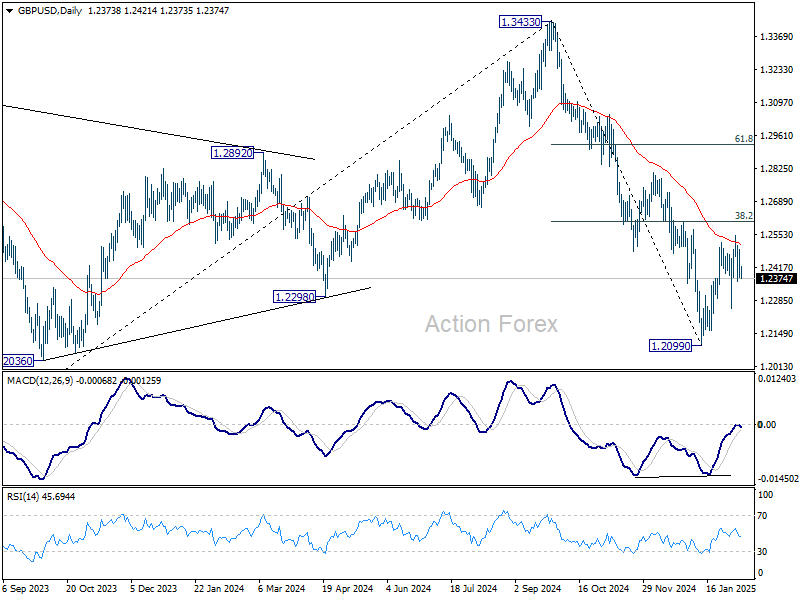
GBP/USD Mid-Day Outlook
Daily Pivots: (S1) 1.2364; (P) 1.2417; (R1) 1.2458; More...
Intraday bias in GBP/USD stays neutral at this point, and outlook is unchanged. While corrective rebound from 1.2099 might still extend, upside should be limited by 38.2% retracement of 1.3433 to 1.2099 at 1.2609. On the downside, break of 1.2248 support will bring retest of 1.2099 low. Firm break there will resume whole fall from 1.3433. However, decisive break of 1.2609 will raise the chance of near term reversal, and target 61.8% retracement at 1.2923.
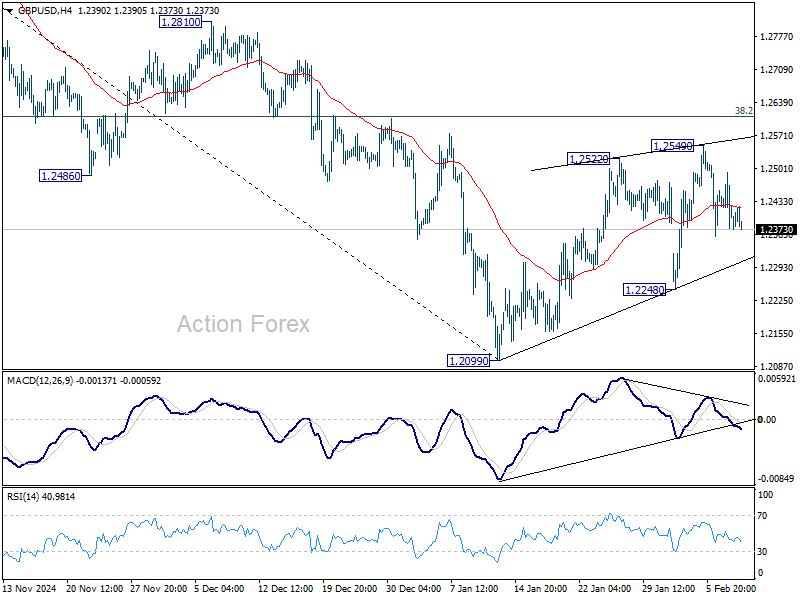
In the bigger picture, rise from 1.0351 (2022 low) should have already completed at 1.3433 (2024 high), and the trend has reversed. Further fall is now expected as long as 1.2810 resistance holds. Deeper decline should be seen to 61.8% retracement of 1.0351 to 1.3433 at 1.1528, even as a corrective move. However, firm break of 1.2810 will dampen this bearish view and bring retest of 1.3433 high instead.
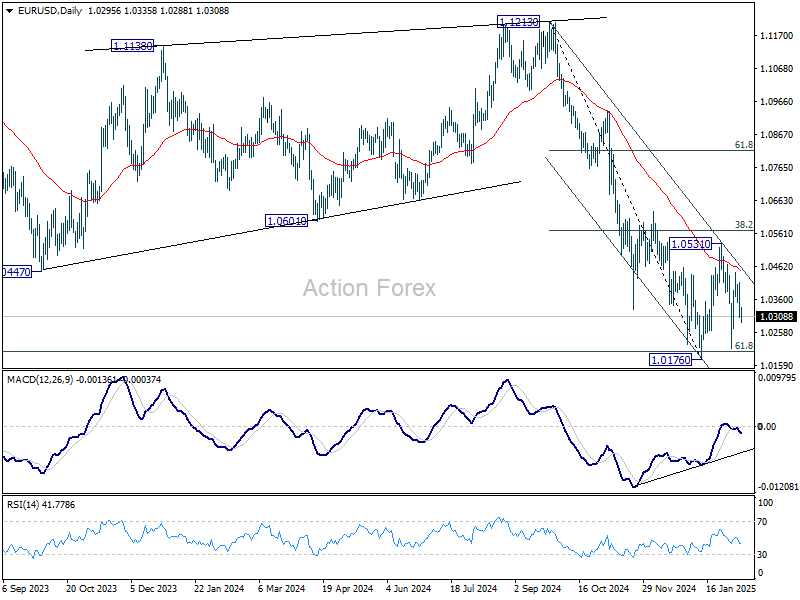
EUR/USD Mid-Day Outlook
Daily Pivots: (S1) 1.0289; (P) 1.0345; (R1) 1.0383; More...
EUR/USD is still bounded in consolidation from 1.0176 and intraday bias remains neutral. Outlook will remain bearish as long as 38.2% retracement of 1.1213 to 1.0176 at 1.0572 holds. On the downside, break of 1.0176 will resume whole fall from 1.1213. However, decisive break of 1.0572 will raise the chance of reversal, and target 61.8% retracement at 1.0817.
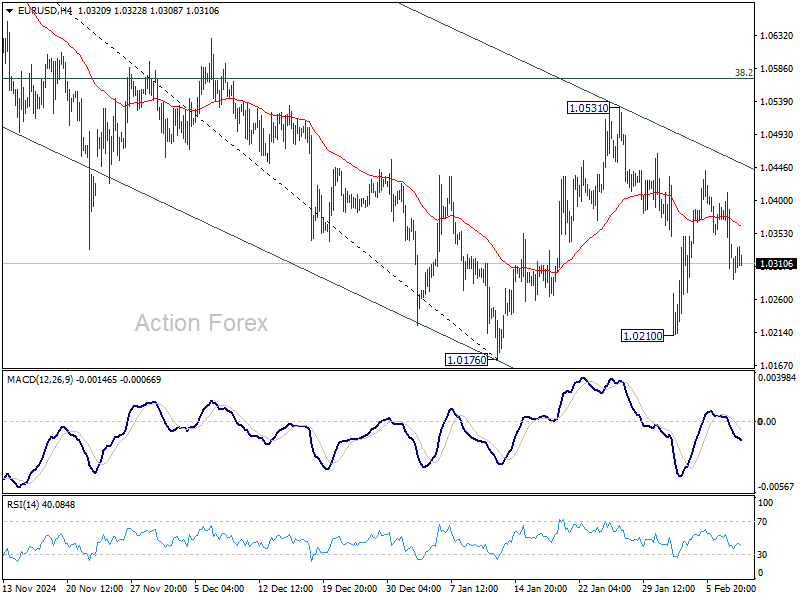
In the bigger picture, immediate focus is on 61.8 retracement of 0.9534 (2022 low) to 1.1274 (2024 high) at 1.0199. Sustained break there will solidify the case of medium term bearish trend reversal, and pave the way back to 0.9534. However, reversal from 1.0199 will argue that price actions from 1.1274 are merely a corrective pattern, and has already completed.
Tariff Impact Diminishes, Aussie Confidence Due Next
Trading in the forex markets has been relatively subdued today, with major currency pairs and crosses remaining within Friday’s range. There was some initial reactions to the latest news of US tariffs on metals, but the impact has faded quickly. Dollar is currently mildly stronger in tight range and Yen is on the softer side. Broader market sentiment also appears stable, as European equities trade in positive territory and US futures indicate a slightly higher open. Meanwhile, Gold is the standout asset, continuing its record-breaking rally with steady momentum.
Looking ahead, Australian consumer and business confidence data will be a key focus in the upcoming Asian session. Market expectations for RBA to begin rate cuts at its February 17-18 meeting have surged, with a 93% probability priced into money markets. The country’s major banks are also aligning with this view, citing the softer-than-expected Q4 trimmed mean CPI as a signal that inflation is sustainably cooling. The upcoming sentiment indicators will provide further clues on whether consumers and businesses are adjusting expectations for looser monetary policy.
Technically, AUD/JPY is back pressing 61.8% projection of 102.39 to 95.50 from 98.75 at 94.49, after prior recovery was rejected by 55 4H EMA. Sustained break of 94.49 will pave way to 100% projection at 91.86. Also, outlook will stay cautiously bearish as long as 96.74 resistance holds, in case of recovery.
In Europe, at the time of writing, FTSE is up 0.68%. DAX is up 0.47%. CAC is up 0.21%. UK 10-year yield is down -0.029 at 4.452. Germany 10-year yield is down -0.008 at 2.367. Earlier in Asia, Nikkei rose 0.04%. Hong Kong HSI rose 1.84%. China Shanghai SSE rose 0.56%. Singapore Strait Times rose 0.36%. Japan 10-year JGB yield rose 0.0136 to 1.316.
Eurozone Sentix rises to -12.7, but inflation keeps ECB in check
Eurozone investor sentiment showed signs of improvement in February, with the Sentix Investor Confidence Index rising from -17.7 to -12.7, surpassing expectations of -16.4. This also marks the highest reading since July 2024, signaling a tentative shift in market sentiment. Current Situation Index also improved, climbing from -29.5 to -25.5, while Expectations Index made an even more notable leap from -5 to 1, also reaching its highest level since July last year.
Sentix noted that the Eurozone economy is "trying to emerge from the crisis," with some early signs of stabilization. However, Germany’s economic struggles continue to act as a drag on the broader region, described as a "lead weight" on the bloc's recovery. Despite this, optimism is growing that a potential shift in German leadership could usher in a more pro-business policy stance, which could help lift economic prospects in the months ahead.
One key takeaway from the report is the diminishing likelihood of aggressive monetary easing from ECB. With investor sentiment improving and the economic outlook brightening, "hopes of more significant support measures from the ECB are also dwindling."
Inflation outlook remains a lingering concern, preventing ECB from committing to deeper rate cuts. Sentix’s "Inflation" theme index remained at -11 points, signaling persistent price pressures.
China’s CPI picks up to 0.5%, but factory prices remain stuck in deflation
China's consumer inflation accelerated at the start of 2025, with CPI rising from 0.1% yoy to 0.5% yoy in January, slightly exceeding market expectations of 0.4%. This marked the fastest annual increase in five months. On a monthly basis, CPI surged 0.7% mom, the strongest rise in over three years.
Core inflation, which strips out food and fuel prices, edged up from 0.4% yoy to 0.6% yoy, reflecting a modest pickup in underlying demand. Food prices climbed by 0.4% yoy, while non-food categories also posted a 0.5% yoy increase.
However, despite these gains, consumer inflation remains well below the government’s target, with full-year 2024 CPI growth coming in at just 0.2%, the lowest since 2009, and reinforcing the persistent weakness in domestic consumption.
Meanwhile, producer prices remained firmly in deflationary territory. PPI held steady at -2.3% yoy in January, missing expectations of a slight improvement to -2.2% yoy. This marks the 28th consecutive month of factory-gate deflation, highlighting ongoing struggles within the manufacturing sector and pricing pressures stemming from weak external demand and excess capacity.
EUR/USD Mid-Day Outlook
Daily Pivots: (S1) 1.0289; (P) 1.0345; (R1) 1.0383; More...
EUR/USD is still bounded in consolidation from 1.0176 and intraday bias remains neutral. Outlook will remain bearish as long as 38.2% retracement of 1.1213 to 1.0176 at 1.0572 holds. On the downside, break of 1.0176 will resume whole fall from 1.1213. However, decisive break of 1.0572 will raise the chance of reversal, and target 61.8% retracement at 1.0817.
In the bigger picture, immediate focus is on 61.8 retracement of 0.9534 (2022 low) to 1.1274 (2024 high) at 1.0199. Sustained break there will solidify the case of medium term bearish trend reversal, and pave the way back to 0.9534. However, reversal from 1.0199 will argue that price actions from 1.1274 are merely a corrective pattern, and has already completed.
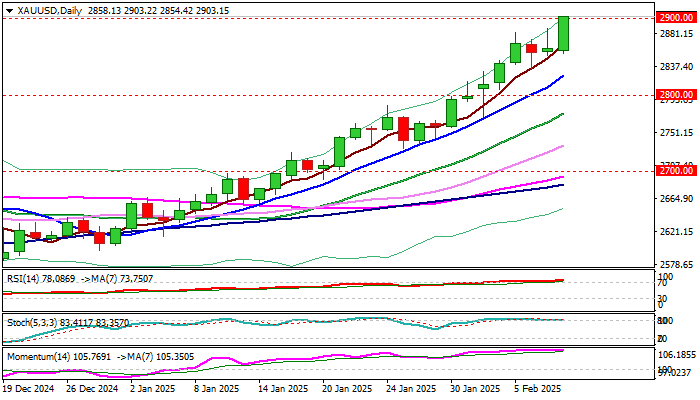
Gold: How Far Can the Bulls Go?
- Gold extends record bull run, touches $2,900 psychological level.
- Overbought signals are evident, but there is support at $2,850-$2,870.
Gold has been on a relentless bull run, posting only eleven days of minor losses since the ongoing upleg began in mid-December.
The price is currently testing the $2,900/ounce round level after opening the week with a bang, but the real challenge would be to maintain support above the channel’s upper band at $2,870 and the $2,850 base. If that proves to be the case and the bulls successfully claim the $2,900 ceiling too, the rally could continue towards the $2,950-$2,970 region where the 161.8% Fibonacci extension of the previous downfall and the resistance line, which joins the April and October 2024 highs, are sitting.
However, a warning note from the technical indicators should not be ignored. The RSI and stochastic indicators are both firmly in overbought territory, signaling that the road ahead could get choppy. Nevertheless, only a dive beneath $2,850-$2,870 could activate selling orders towards Thursday’s low near $2,830 or closer to the channel’s lower band currently seen near $2,813. Then, October’s peak of $2,790 and the 20-day simple moving average (SMA) near $2,770 could be the next destination. A break lower would neutralize the medium-term picture.
In summary, gold seems poised for another potential surge, but the key to a continuation higher lies in holding above $2,850-$2,870. If the bulls can maintain their grip here, a fresh wave towards higher levels could be on the cards.

XAU/USD: Gold Hits New Record High Above $2,900
Gold was top performer during early Monday trading after new tariff threats from President Trump fueled fears about global trade war and sparked fresh safe haven demand.
Bulls cracked psychological $2900 barrier and hit new record high, in 1.5% advance during Asian / early European trading.
Technical picture remains firmly bullish, although overbought conditions on daily chart warn that the price action may slow for consolidation.
Dips are likely to be shallow, as bullish sentiment remains strong.
Sustained break above $2900 to generate fresh signal and expose targets at $2946 and $2983 (Fibo projections), en route towards key barrier at $3000 (psychological).
Res: 2916; 2946; 2983; 3000.
Sup: 2886; 2865; 2850; 2825.
XBRUSD: Technical and Fundamental Outlook
Crude oil starts the week with moderate gains after three consecutive weeks of losses. Tensions in the Middle East have escalated after the U.S. imposed new sanctions on individuals and vessels involved in exporting Iranian crude to China, which could impact global supply. However, gains are limited by concerns that Trump’s tariffs on steel and aluminium may slow global economic growth and reduce energy demand. Additionally, a stronger U.S. dollar is adding downward pressure on the market.
Key factors to monitor this week:
- Sanctions on Iran: Increased pressure on Iranian exports could tighten global supply.
- U.S.-China trade tensions: New tariffs may impact economic growth and energy demand.
- Strength of the U.S. dollar: A stronger dollar makes crude more expensive for international buyers.
- Russia-Ukraine negotiations: Any progress in talks between the U.S. and Russia could influence the market.
Outlook: The market remains uncertain. A decisive move will depend on the evolution of sanctions and the real impact of trade tariffs on demand.
Technical Analysis
XBRUSD, H2
- Supply Zone (Sell): 76.00
- Demand Zones (Buy): 74.51 and 74.91
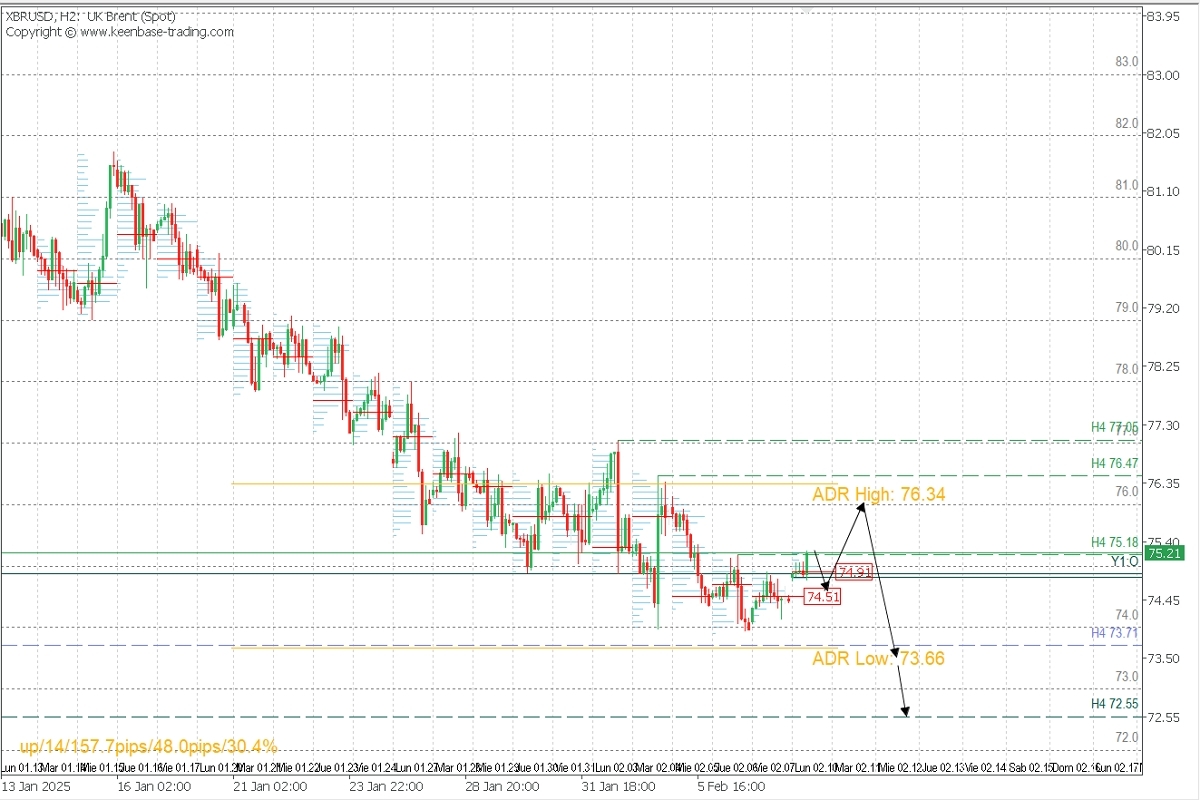
Last week, the price formed a double bottom around 74.00, with the most recent validated intraday resistance at 76.47. This suggests that the bearish bias remains intact unless this level is broken.
The recent upside followed a moderate bearish reaction from Thursday’s supply zone near 74.70, leading to a bullish gap at the open this week. This triggered a correction, leaving two local demand zones at 74.51 and 74.91. As long as the price stays above these levels, a rebound toward the volume node around 76.00 is likely.
Selling pressure may resume near 76.00, targeting intraday levels at 74.00 and 73.11, with potential for a broader decline toward 73.00 and 72.55 in a swing move.
Technical Summary:
- Corrective Bullish Scenario: Buying above 74.51 (waiting for the gap to be filled) with targets at 76.00.
- Bearish Continuation Scenario: Selling below 76.00 (waiting for a new rebound) with targets at 74.00, 73.71, 73.00, and 72.55.
Uncovered POC: POC = Point of Control: The level or zone where the highest volume concentration occurred. If a downward move followed this level, it is considered a selling zone and forms resistance. Conversely, if an upward move followed, it is a buying zone, usually located at lows and forming support areas.
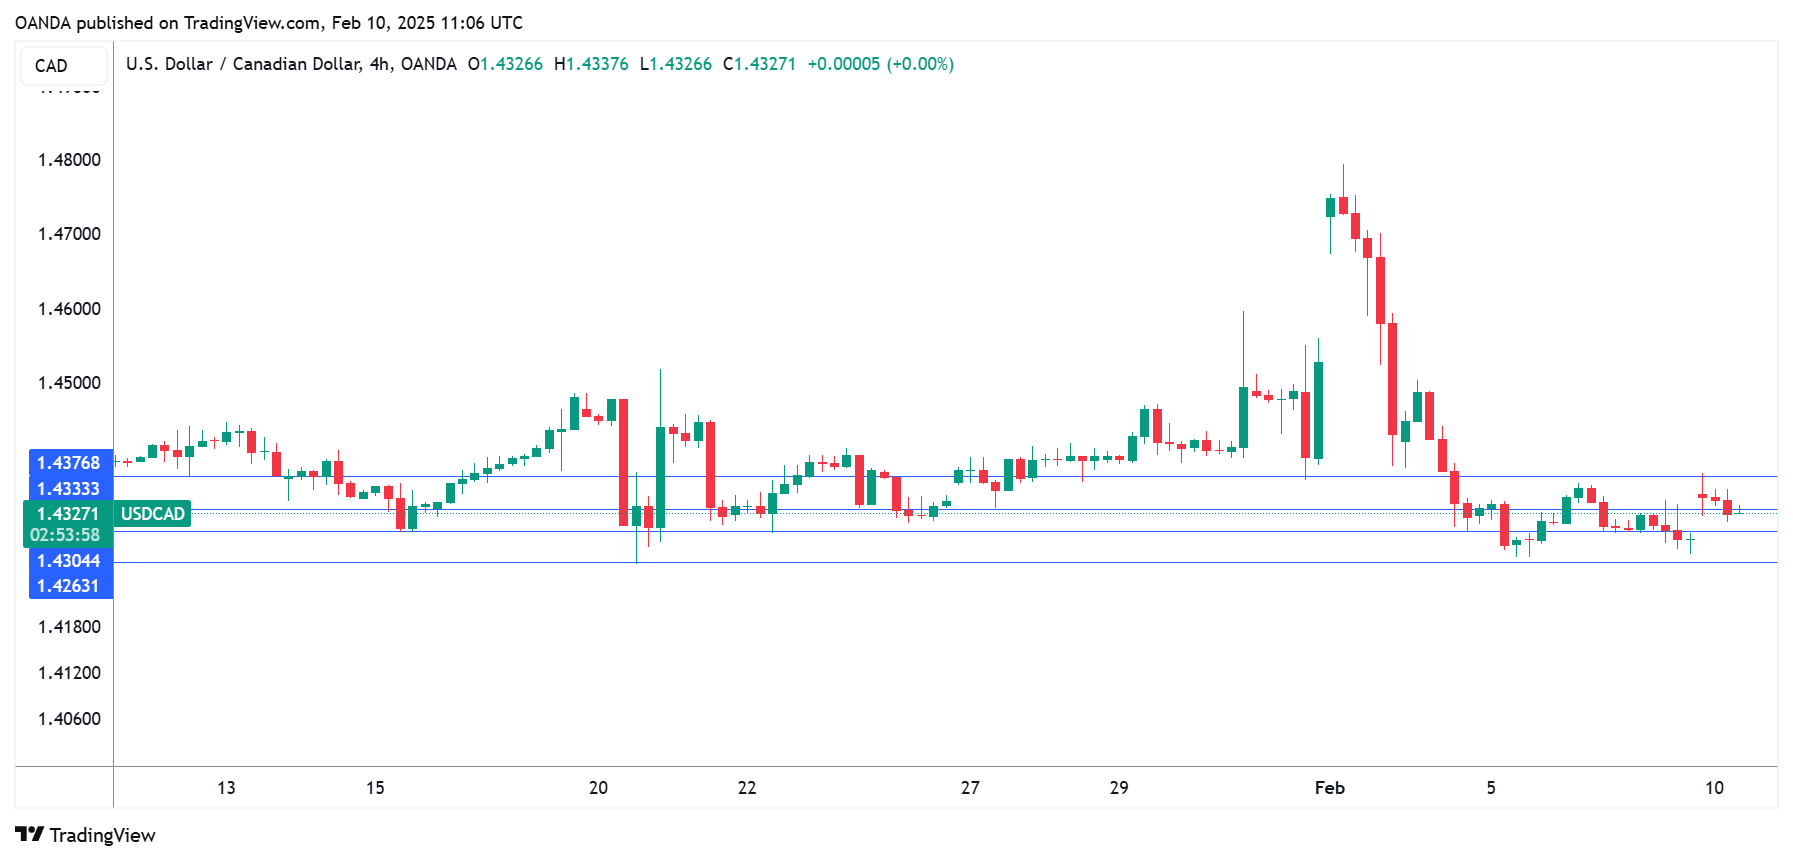
Can. Dollar Shrugs After Strong Can. Jobs Report
The Canadian dollar is drifting on Monday. In the European session, USD/CAD is trading at 1.4334, down 0.11% on the day.
Canada’s employment blows past market estimate
Canada posted stronger-than-expected growth on Friday, but the Canadian dollar showed little reaction. The economy created 76 thousand jobs in January, crushing the market estimate of 25 thousand and following a December gain of 90 thousand. This marked the sixth straight monthly increase as the labor market remains strong despite a weak ecconomy. The unemployment rate dipped to 6.6%, down from 6.8% and below the market estimate of 6.7%.
The jobs numbers were positive but hanging over the report is the risk of a trade war with the United States, which was narrowly avoided last week, when the US imposed and then suspended tariffs against Canada. President Trump suspended the tariffs for 30 days and the Bank of Canada’s next rate decision on March 12 will depend on economic data and whether the tariffs are reinstated.
US nonfarm payrolls miss estimate
US nonfarm payrolls eased to 143 thousand in January, shy of the market estimate of 175 thousand. Still, there weres signs of strength in the labor market – nonfarm payrolls were revised by 100 thousand in the previous two months and the unemployment rate ticked lower to 4% from 4.1%, below the market estimate of 4.1%. Average hourly earnings rose 0.5%, up from 0.3% in December and above the market estimate of 0.5%. Annually, average hourly earnings rose 4.1%, unchanged from the revised December reading and above the market estimate of 3.8%. The generally positive employment report supports the case for the Federal Reserve continuing to hold rates, possibly until the third quarter.
USD/CAD Technical
- USD/CAD is testing support at 1.4333. Below, there is support at 1.4304
- There is resistance at 1.4375 and 1.4404