
Sample Category Title
China’s CPI picks up to 0.5%, but factory prices remain stuck in deflation
China's consumer inflation accelerated at the start of 2025, with CPI rising from 0.1% yoy to 0.5% yoy in January, slightly exceeding market expectations of 0.4%. This marked the fastest annual increase in five months. On a monthly basis, CPI surged 0.7% mom, the strongest rise in over three years.
Core inflation, which strips out food and fuel prices, edged up from 0.4% yoy to 0.6% yoy, reflecting a modest pickup in underlying demand. Food prices climbed by 0.4% yoy, while non-food categories also posted a 0.5% yoy increase.
However, despite these gains, consumer inflation remains well below the government’s target, with full-year 2024 CPI growth coming in at just 0.2%, the lowest since 2009, and reinforcing the persistent weakness in domestic consumption.
Meanwhile, producer prices remained firmly in deflationary territory. PPI held steady at -2.3% yoy in January, missing expectations of a slight improvement to -2.2% yoy. This marks the 28th consecutive month of factory-gate deflation, highlighting ongoing struggles within the manufacturing sector and pricing pressures stemming from weak external demand and excess capacity.
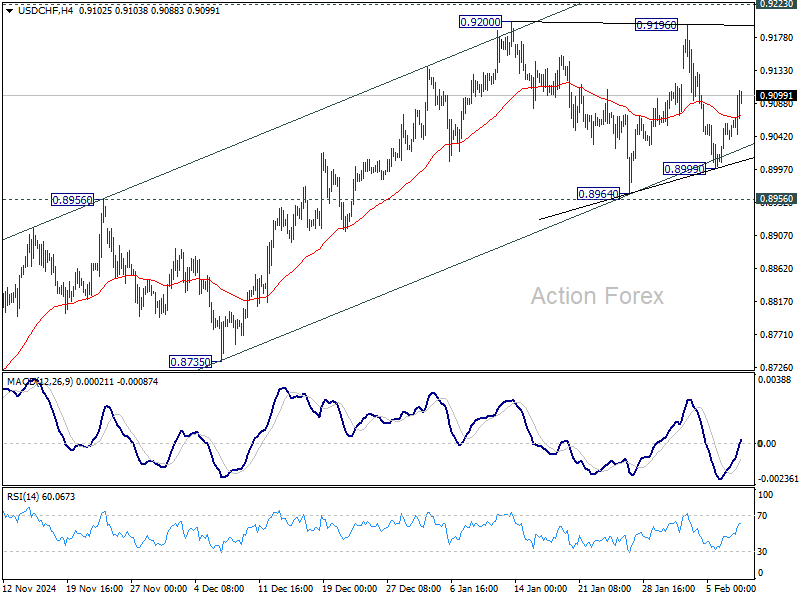
USDCHF Wave Analysis
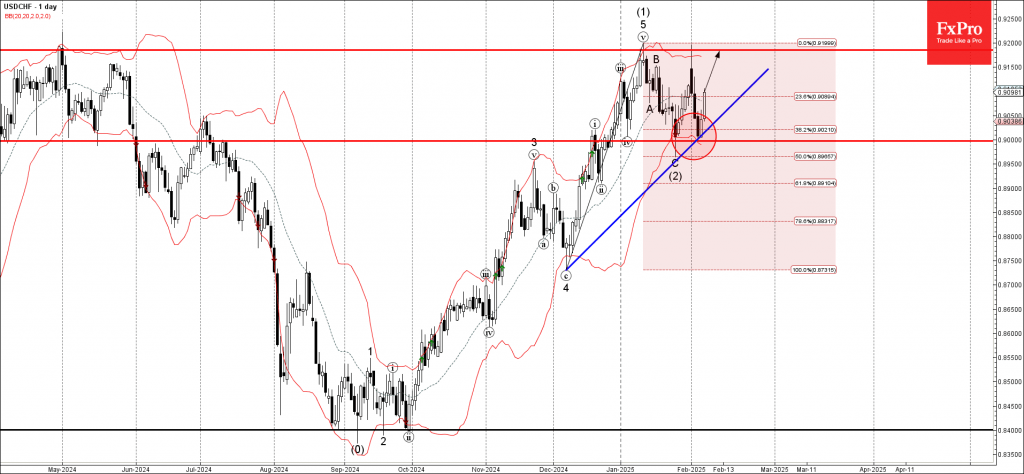
- USDCHF reversed from support zone
- Likely to rise to resistance level 0.9185
USDCHF currency pair recently reversed up from the support zone between the round support level 0.9000 (which also stopped the previous correction (2)), lower daily Bollinger Band and the support trendline from December.
The upward reversal from this support zone created the daily Japanese candlesticks reversal pattern Piercing Line.
Given the clear daily uptrend, USDCHF currency pair can be expected to rise to the next resistance level 0.9185 (which has been reversing the price from May of 2024, as can be seen below).
Dow Jones Wave Analysis
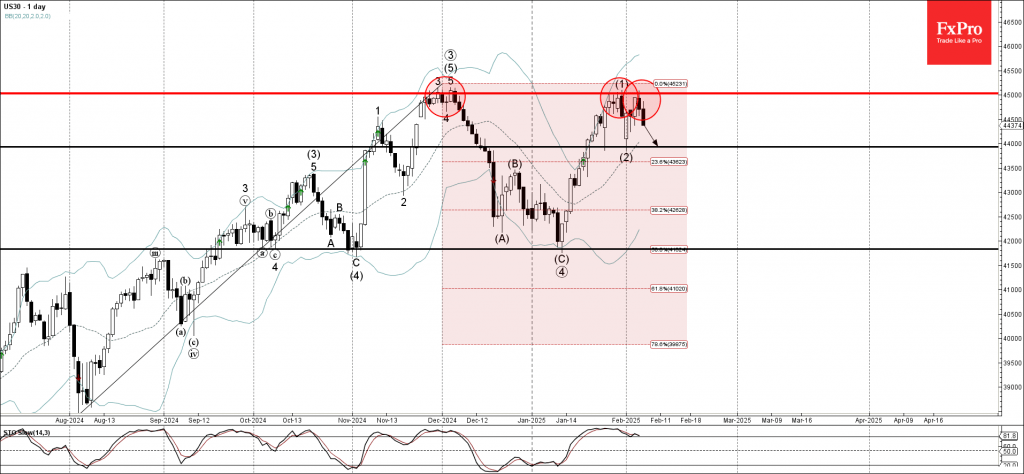
- Dow Jones reversed from the resistance level 45000.00
- Likely to fall to support level 44000.00
Dow Jones index recently reversed down from the strong resistance level 45000.00 (which has been reversing the price from November) coinciding with the upper daily Bollinger Band
The downward reversal from the resistance level 45000.00 created the daily Japanese candlesticks reversal pattern Dark Cloud Cover after the index created Bearish Engulfing at the end of January.
Given the strength of the resistance level 45000.00 and the overbought daily Stochastic, Dow Jones index can be expected to fall to the next support level 44000.00 (low of the previous correction (2)).
Dollar’s Wild Week Ends in Uncertainty, Awaits Next Tariff Cue
Dollar faced significant volatility last week as shifting trade policy signals from the White House left investors scrambling for clarity. Initially, tariffs on Canadian and Mexican imports were imposed, only to be quickly suspended for 30 days following new agreements on border security and fentanyl control. Now, the focus turns to “reciprocal tariffs,” a move that could see the US impose duties equivalent to those faced by American exports in key markets.
While traders hope for clarity once the reciprocal tariffs are officially announced, the risk of another abrupt reversal remains high. The unpredictability of the administration’s trade stance, particularly regarding its approach toward key partners like the European Union, suggests continued volatility in currency markets. Until the full scope of Trump’s trade strategy is revealed, market sentiment is likely to remain fragile, with investors hesitant to commit to a firm direction.
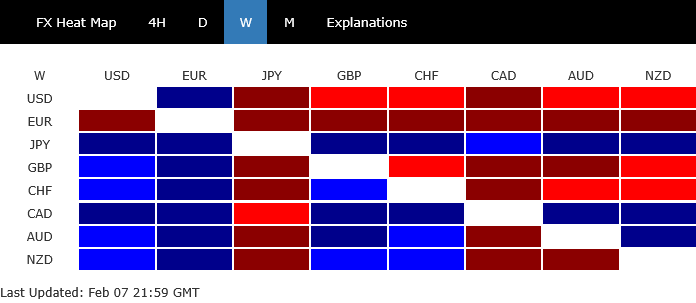
Amid these confusions, Yen stood out as the strongest performer, supported by positive economic data that reinforced expectations of further BoJ rate hikes. Canadian Dollar followed behind, benefiting from a temporary tariff reprieve and stronger-than-expected employment report. Meanwhile, Australian and New Zealand Dollars managed to recover some ground, but their gains were limited by the continued US tariffs on Chinese goods and the lack of any progress in US-China trade negotiations.
On the weaker side, Euro was the worst-performing currency, struggling under the weight of tariff threats. Despite its late-week bounce, Dollar ended the week near the bottom of the performance rankings. British Pound also weakened after the BoE delivered a surprisingly dovish rate cut, while the Swiss Franc was also soft.
Duel Uncertainty of Trade War and Hawkish Fed Outlook in the US
Investors in US financial markets are grappling with two major uncertainties—President Donald Trump’s evolving tariff strategy and Fed’s interest rate outlook. This dual uncertainty has led to volatile but indecisive trading in major equity indices and large price swings in Dollar, reflecting broader confusion in the markets.
Trump’s Tariff Play: Economic Policy or Political Leverage?
The core intention behind Trump’s tariff policies remains unclear. His administration initially imposed 25% tariffs on imports from Canada and Mexico, only to suspend them for 30 days following agreements with both nations on border security and fentanyl control measures. This move suggests that Trump may be using tariffs as a tool for securing non-trade-related concessions rather than purely as an economic strategy. The immediate delay in enforcement highlights that these tariffs could be more of a negotiation tactic than an outright protectionist measure.
However, fresh concerns emerged on Friday when Trump said that the US would announce, in the coming days, “reciprocal tariffs” on a range of trading partners to ensure American exports are treated “evenly.” This move, if implemented broadly, could have far-reaching economic consequences, particularly if the US targets major trade partners like the European Union. Unlike the previous round of tariffs during Trump’s first term, which were primarily aimed at China, this time the scope appears much wider, raising the specter of more extensive trade disruptions.
The biggest risk is that tariffs could become an ongoing feature of US trade policy rather than a temporary bargaining tool. With Trump also eyeing the EU as a target, the outlook for global trade is highly uncertain. For now, investors are clearly staying in wait-and-see mode, monitoring Trump’s next steps closely.
Strong US Job Market to Keep Fed on Hold, Inflation Risks Re-Emerging?
While trade concerns dominate the headlines, the strength of the US labor market has reinforced expectations that Fed will remain in a prolonged pause on rate cuts.
Dallas Fed President Lorie Logan articulated a noteworthy point last week. She argued falling inflation with robust labor market means interest rates are already near neutral. That would leave little room for further easing in the near term. Fed would then stay on hold until there is clear evidence of a labor market slowdown, not just declining inflation.
Friday’s non-farm payroll report added weight to this narrative. While job growth slowed to 143K, falling short of expectations, revisions to previous months were significant, with December’s figure being adjusted upward to 307K. Additionally, the unemployment rate unexpectedly declined from 4.1% to 4.0%, suggesting that the labor market remains resilient. Wage growth also accelerated, with average hourly earnings rising 0.5% mom —above expectations—bringing the annual increase to 4.1%.
Another concerning development in recent data was the sharp rise in consumer inflation expectations. University of Michigan’s Surveys of Consumers revealed that short-term inflation expectations jumped from 3.3% to 4.3%, the highest level since November 2023. Long-term inflation expectations also ticked higher, reaching 3.3%, marking the highest reading since June 2008.
If inflation expectations continue rising alongside strong wage growth, Fed could face renewed pressure to reconsider its monetary policy stance. A scenario where inflation remains stubbornly above target while employment stays strong could force Fed to maintain high rates longer than markets currently anticipate. In an extreme case, policymakers may even have to consider reintroducing rate hikes—an outcome that is not currently priced into the market but remains a potential risk, albeit minor.
S&P 500 Stuck in Range, Upside Appears Limited
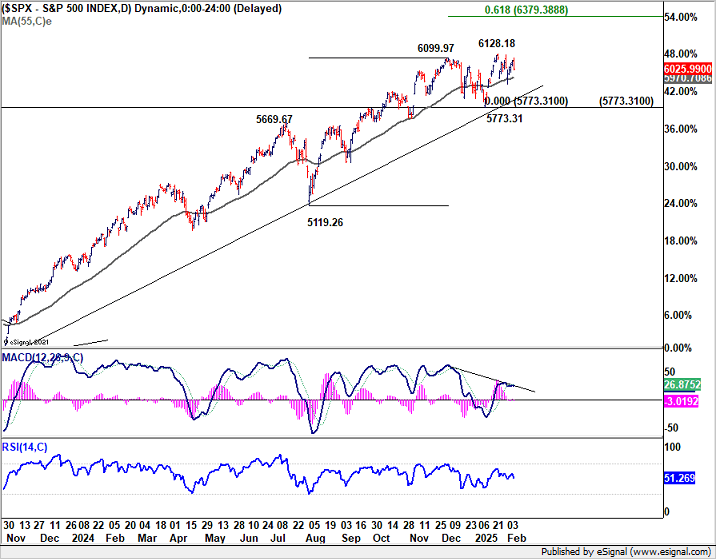
Technically, S&P 500's price actions from 6128.18 (Jan high) are still corrective looking, suggesting larger up trend remains intact. However, even in case of up trend resumption, loss of momentum as seen in D MACD could limit upside at 61.8% projection of 5119.26 to 6099.97 from 5773.31 at 6379.38.
On the other hand, strong break of 55 D EMA (now at 5970.70) would put 5773.31 structural support into focus. Firm break of 5773.31 will argue that a medium term top was already in place, and larger scale correction is underway.
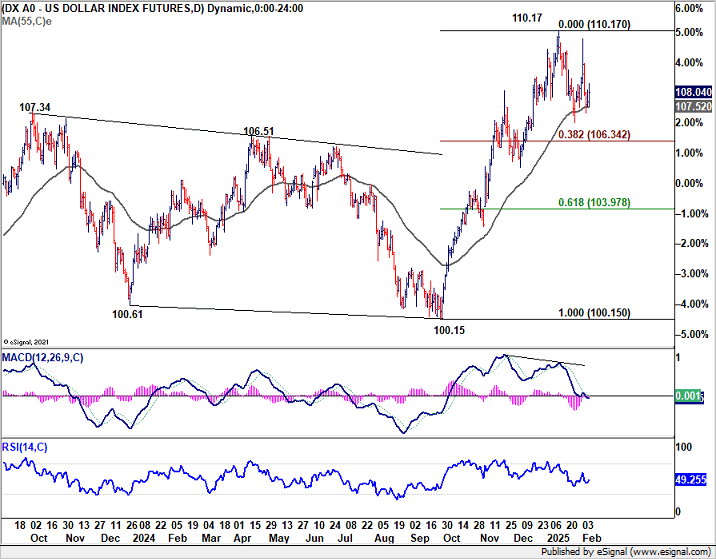
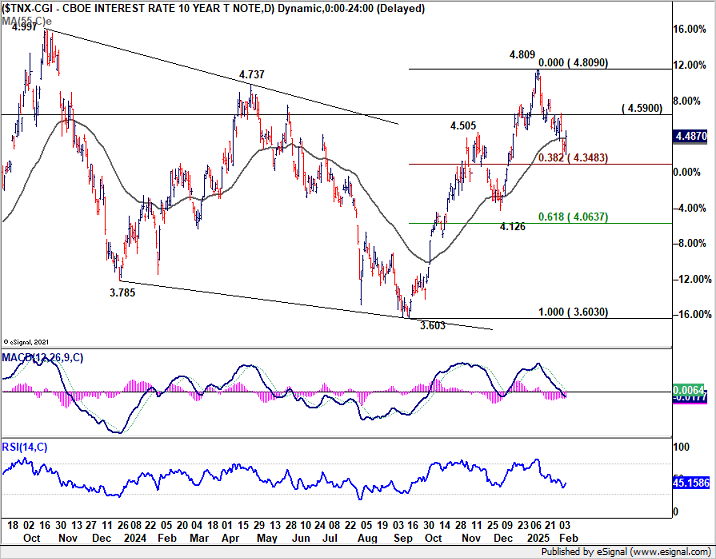
Sideway Trading to Continue in Dollar Index and 10-Year Yield
Dollar Index's initial spike was capped below 110.17 resistance, and followed by steep pull back. Overall outlook is unchanged that consolidation pattern from 110.17 is still extending. In case of another selloff, downside should be contained by 38.2% retracement of 100.15 to 110.17 at 106.34 to bring rebound. However, firm break of 110.17 is needed to confirm up trend resumption, which is unlikely for the near term. Hence, sideway trading is set to continue for a while.
10-year yield's fall from 4.809 extended lower last week but recovered notably on Friday to close at 4.487. As long as 38.2% retracement of 3.603 to 4.809 at 4.348 stays intact, price actions from 4.809 are viewed as a corrective pattern. Break of 4.590 will bring stronger rebound. But upside should be limited by 4.809, at least on first attempt. That is, similar to Dollar Index, range trading will likely continue for a while.
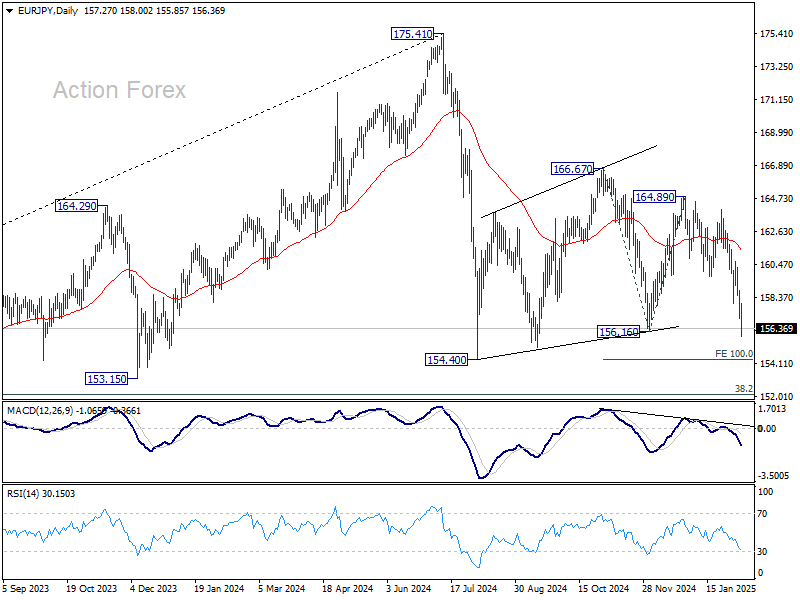
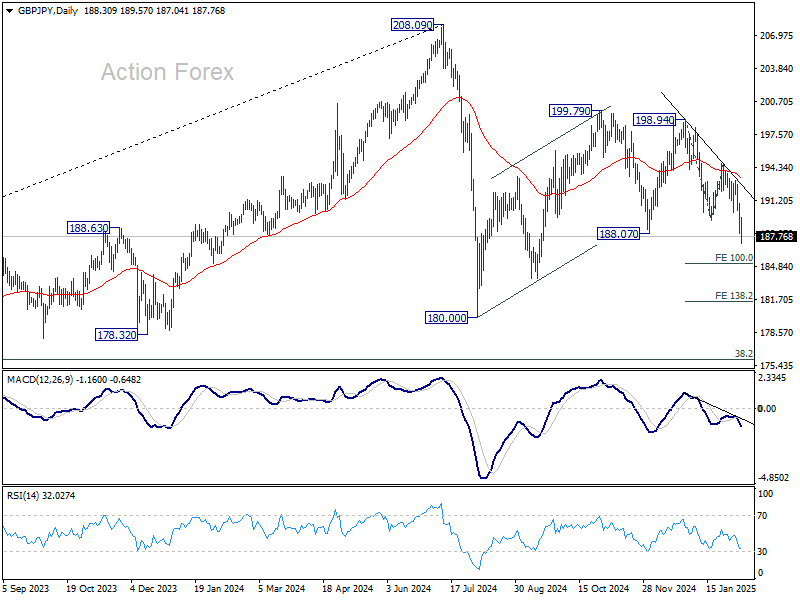
EUR/JPY and GBP/JPY Tumble as Yen Rides Rate Expectations and Trade Uncertainty
Yen emerged as a dominant force in the forex markets last week, with EUR/JPY and GBP/JPY among the biggest losers, down -2.7% and -2.3% respectively. The shift was driven by a combination of declining US and European benchmark yields, alongside increasing expectations of further BoJ rate hikes. These factors reinforced the Yen’s bullish momentum and kept both EUR/JPY and GBP/JPY under heavy selling pressure.
BoJ board member Naoki Tamura, the most hawkish voices within the central bank, continued to advocate his view that interest rates should rise to at least 1% by the end of fiscal 2025. His stance gained additional credibility after IMF also backed a gradual rate hike approach, recommending that the policy rate reach the midpoint of 1.5% within the 1-2% neutral range by the end of 2027.
The case for BoJ tightening has been reinforced by strong nominal wage growth, with real wages increasing for a second consecutive month. More importantly, the wage gains are feeding into stronger consumption, a critical factor in sustaining inflation at the central bank’s 2% target. If this trend continues, BoJ will have even more reason to proceed with further hikes.
Meanwhile, Euro came under additional pressure from Trump’s tariff threats. With a formal reciprocal tariff announcement expected soon, the EU is almost certain to be included, raising fears of another prolonged trade conflict. Given the region’s reliance on exports, such a development could have a significant negative impact on Eurozone already sluggish growth prospects, forcing ECB to take a more dovish stance than currently anticipated.
ECB Chief Economist Philip Lane has been advocating for a “middle path” in policy easing, balancing inflation risks with economic headwinds. However, should tariffs materialize, ECB might be forced to accelerate rate cuts to cushion the economy from external shocks
The UK has fared somewhat better as it is not a primary target of Trump’s trade measures. However, BOE’s unexpectedly dovish rate cut last week has left the Pound vulnerable too. Notably, hawkish policymaker Catherine Mann made a surprising U-turn, voting for a 50bps rate cut, a sharp departure from her previous stance. The base case still remains a quarterly 25bps cut throughout 2025 for BoE, but the risk is now tilted slightly toward a more aggressive easing cycle.
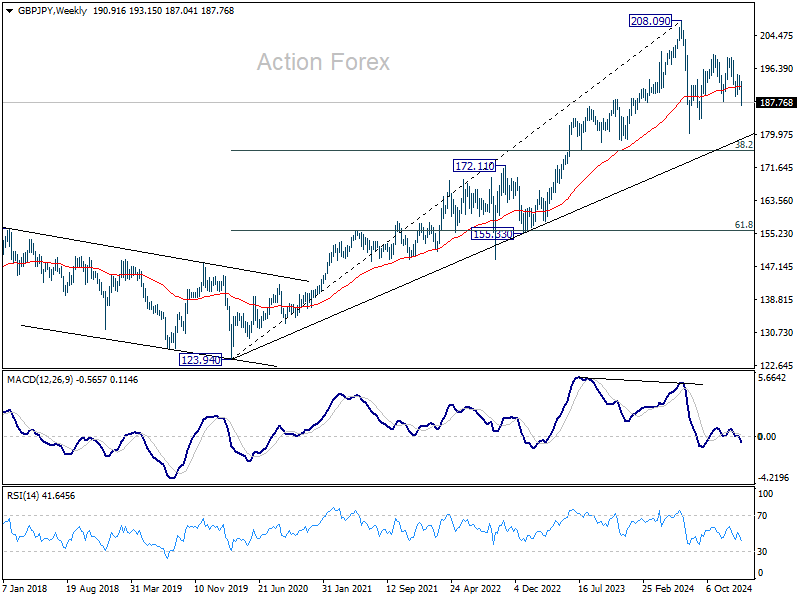
Technically, as selloff in EUR/JPY intensified, the development in the next few weeks would be crucial. Attention will be on 100% projection of 100% projection of 166.7 to 156.16 from 164.89 at 154.38, which is close to 154.40 key support.
Firm break there will resume whole pattern from 175.41 medium term top. More importantly, that would make 38.2% retracement of 114.42 to 175.41 at 152.11 key long term fibonacci level vulnerable.

For GBP/JPY, the focus will be on 100% projection of 198.94 to 189.31 from 194.73 at 185.10. Decisive break there could prompt downside acceleration through 180.00 low to resume whole decline from 208.09 medium term top. That would at least put 38.2% retracement of 123.94 to 208.09 at 175.94 as next target.
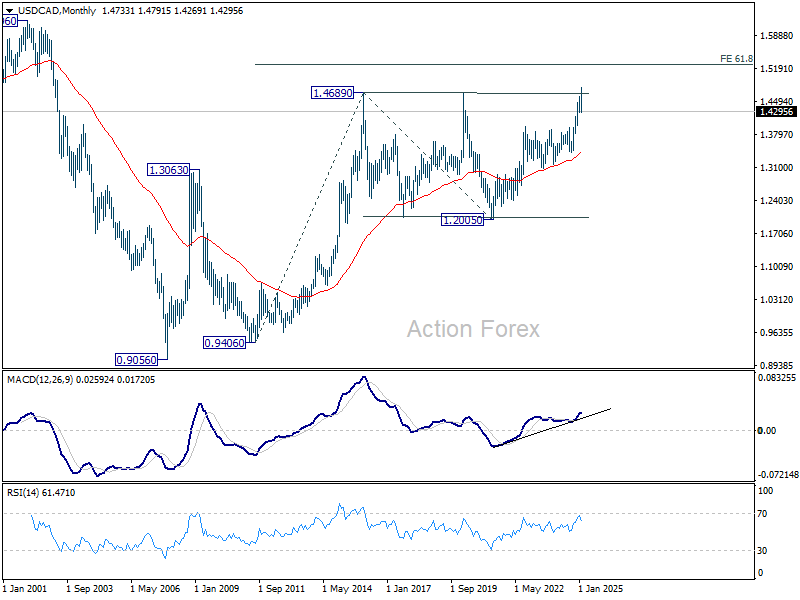
USD/CAD Weekly Outlook
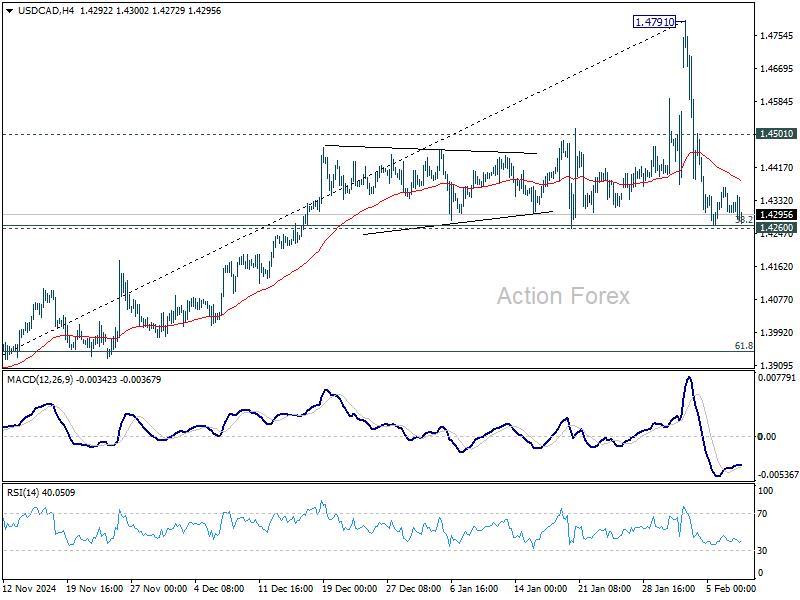
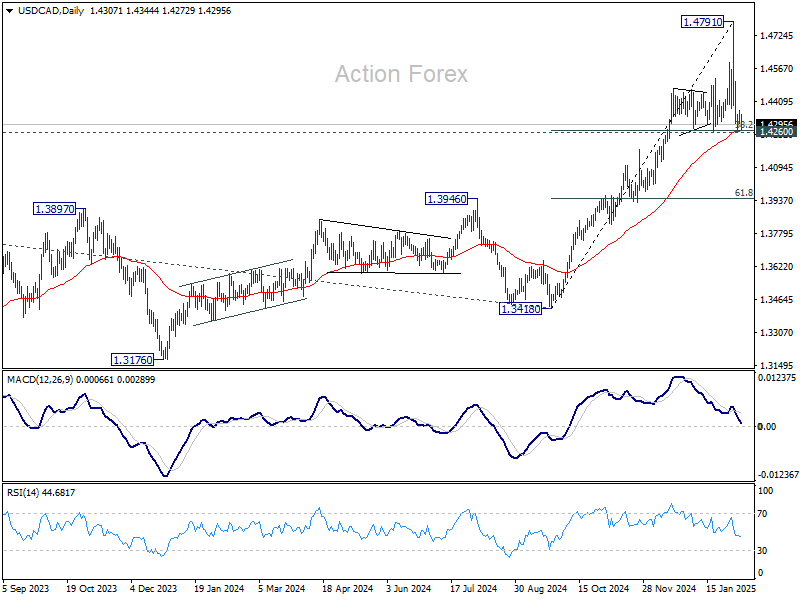
USD/CAD spiked higher to 1.4791 last week but reversed sharply from there. Nevertheless, downside is contained by 1.4260 cluster support (38.2% retracement of 1.3418 to 1.4791 at 1.4267), which is also close to 55 D EMA (now at 1.4264). There is no sign of reversal yet. Initial bias remains neutral this week first. On the upside, above 1.4501 minor resistance will turn bias back to the upside for stronger rebound. Larger up trend is expected to resume through 1.4791 at a later stage. However, firm break of 1.4260 will indicate that deeper correction is underway.
In the bigger picture, long term up trend is tentatively seen as resuming with breach of 1.4667/89 key resistance zone (2020/2015 highs). Next target is 100% projection of 1.2401 to 1.3976 from 1.3418 at 1.4993. This will remain the favored case as long as 1.3976 resistance turned holds (2022 high), even in case of deep pullback.
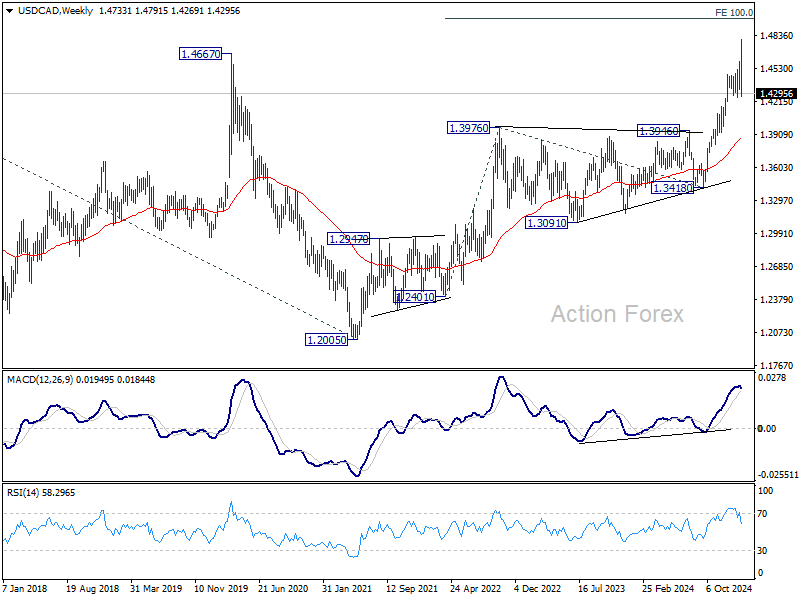
In the longer term picture, up trend from 0.9506 (2007 low) is in progress and possibly resuming. Next target is 61.8% projections of 0.9406 to 1.4689 from 1.2005 at 1.5270. While rejection by 1.4689 will delay the bullish case, further rally will remain in favor as long as 55 M EMA (1.3392) holds.
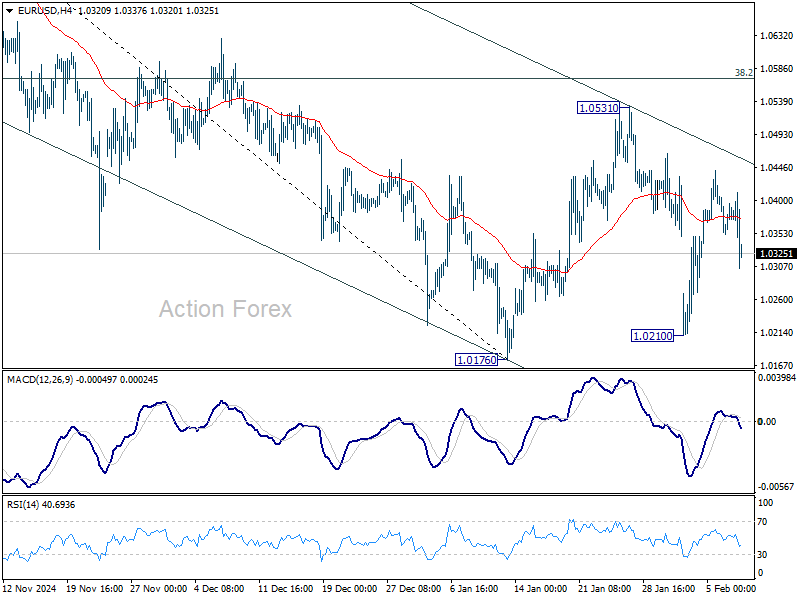
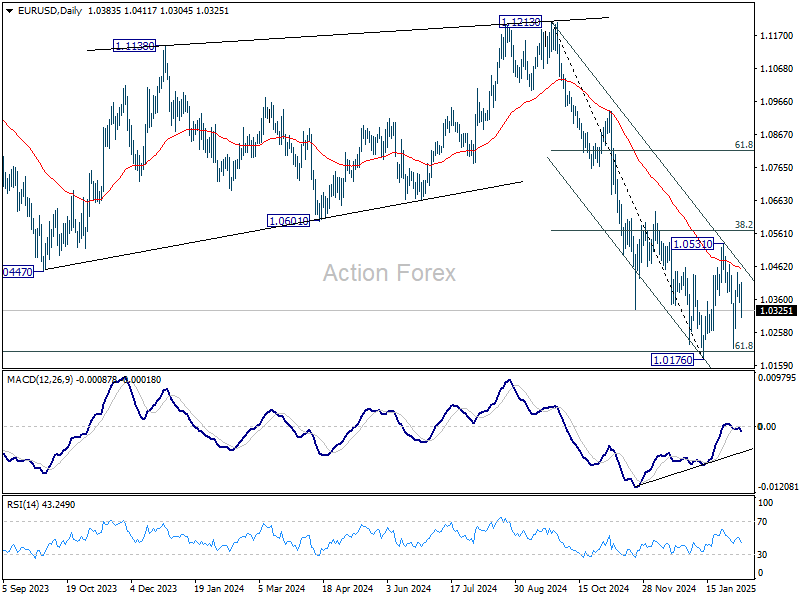
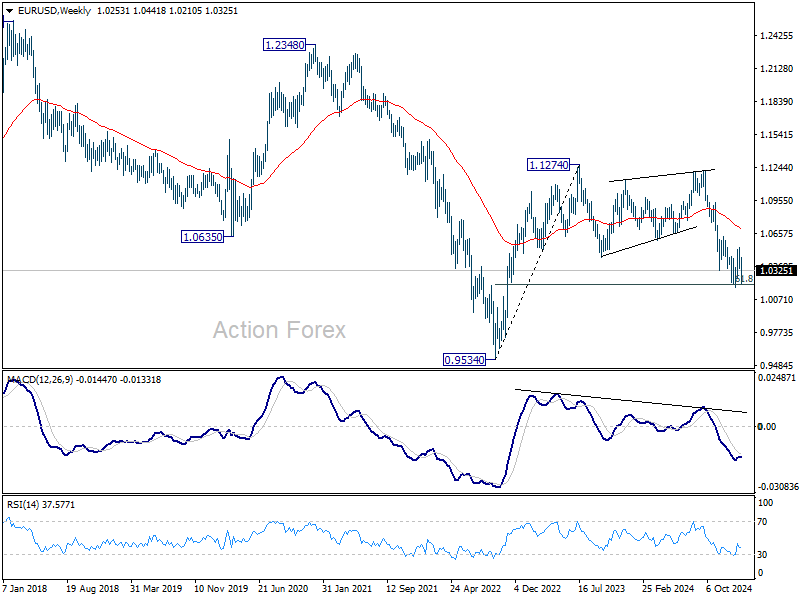
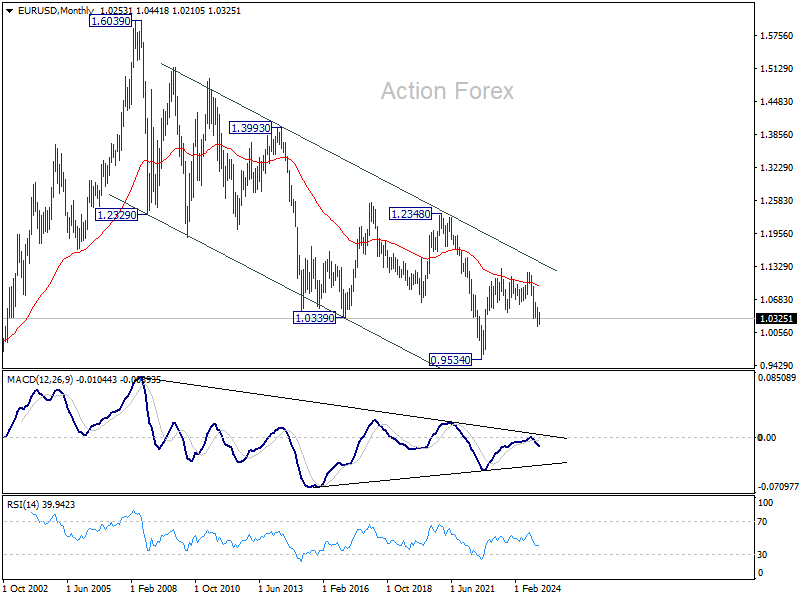
EUR/USD Weekly Outlook
Despite all the volatility last week, EUR/USD is still bounded in range above 1.0176. Initial bias remains neutral this week and further decline is expected. On the downside, firm break of 1.0176 will resume whole fall from 1.1213. However, firm break of 38.2% retracement of 1.1213 to 1.0176 at 1.0572 will raise the chance of reversal, and target 61.8% retracement at 1.0817.
In the bigger picture, immediate focus is on 61.8 retracement of 0.9534 (2022 low) to 1.1274 (2024 high) at 1.0199. Sustained break there will solidify the case of medium term bearish trend reversal, and pave the way back to 0.9534. However, reversal from 1.0199 will argue that price actions from 1.1274 are merely a corrective pattern, and has already completed.
In the long term picture, down trend from 1.6039 remains in force with EUR/USD staying well inside falling channel, and upside of rebound capped by 55 M EMA (now at 1.0929). Consolidation from 0.9534 could extend further and another rising leg might be seem. But as long as 1.1274 resistance holds, eventual downside breakout would be mildly in favor.
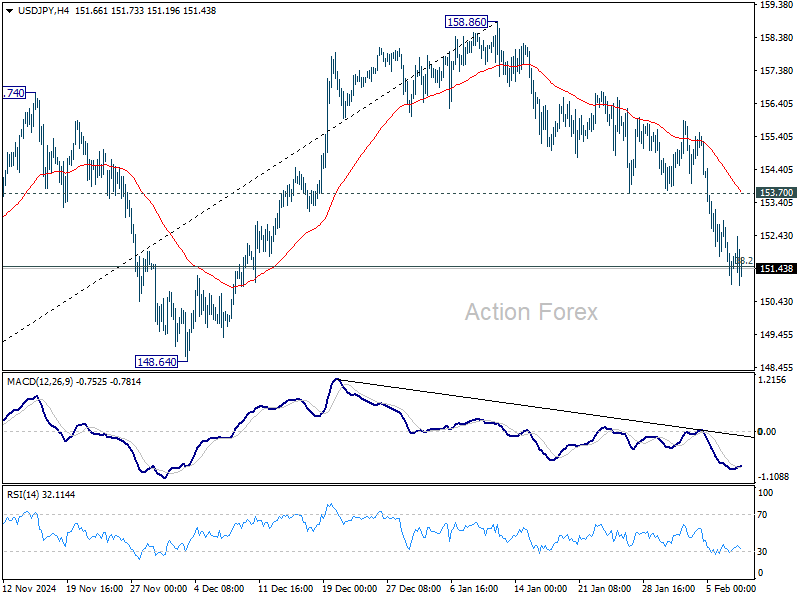
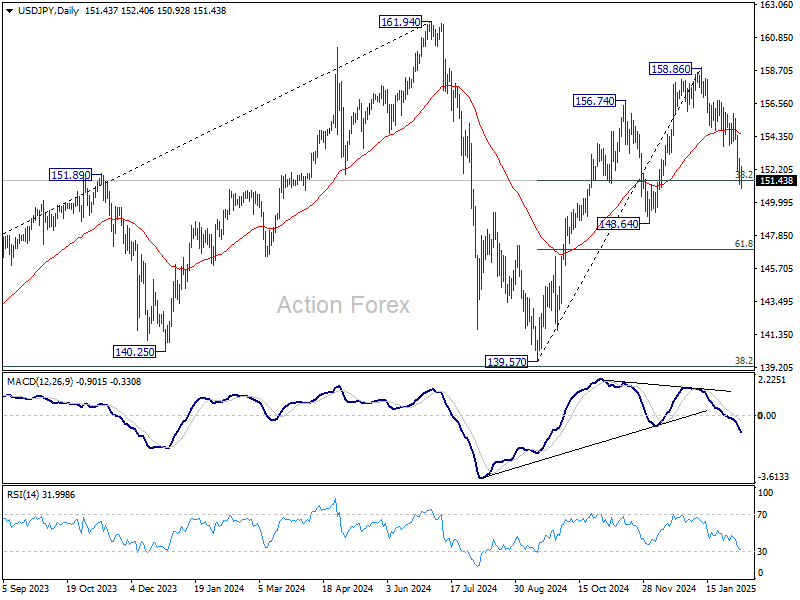
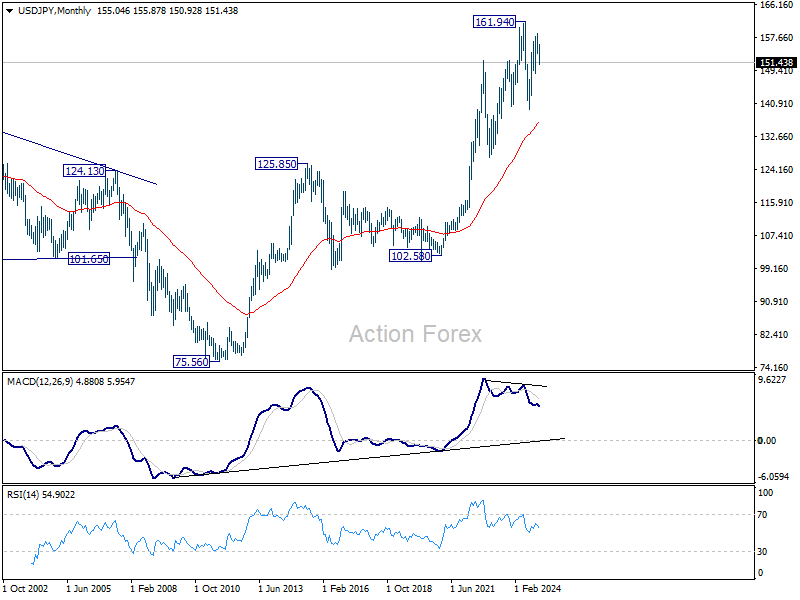
USD/JPY Weekly Outlook
USD/JPY's fall from 158.86 extended lower last week but lost momentum after hitting 38.2% retracement of 139.57 to 158.86 at 151.49. Initial bias stays neutral this week first. On the upside, firm break of 153.70 resistance will retain near term bullishness, and turn bas back to the upside for retesting 158.86. However, sustained trading below 151.49 will suggest that whole rise from 139.57 has completed, and bring deeper fall to 61.8% retracement at 146.32 next.
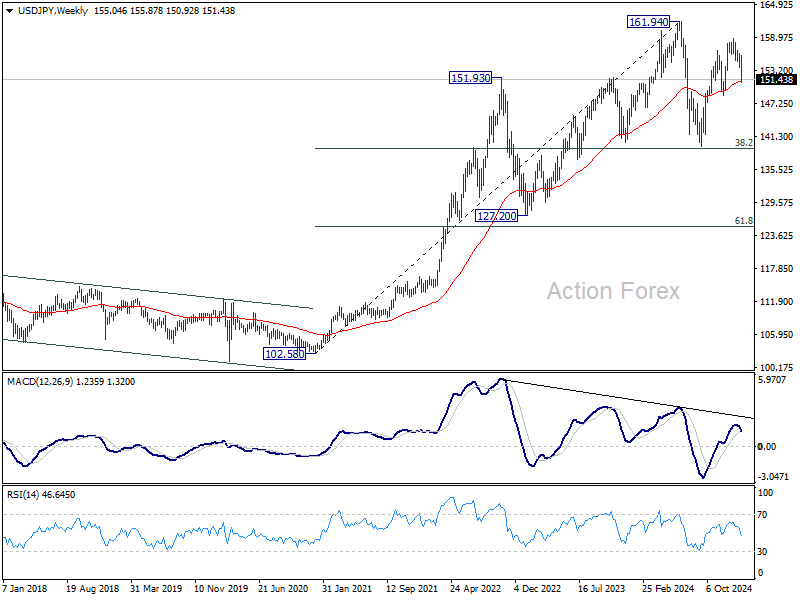
In the bigger picture, price actions from 161.94 are seen as a corrective pattern to rise from 102.58 (2021 low). In case of another fall, strong support should be seen from 38.2% retracement of 102.58 to 161.94 at 139.26 to bring rebound. However, sustained break of 139.26 would open up deeper medium term decline to 61.8% retracement at 125.25.
In the long term picture, it's still early to conclude that up trend from 75.56 (2011 low) has completed. A medium term corrective phase should have commenced, with risk of deep correction towards 55 M EMA (now at 136.50).
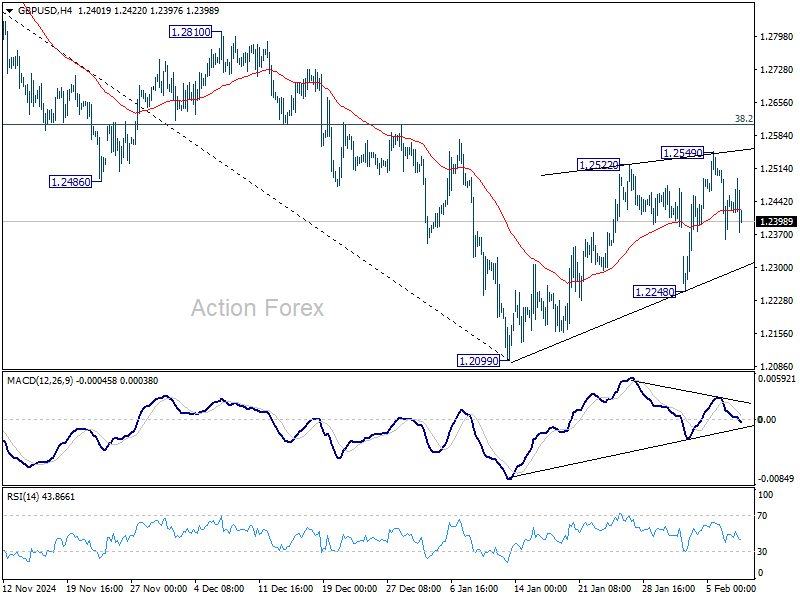
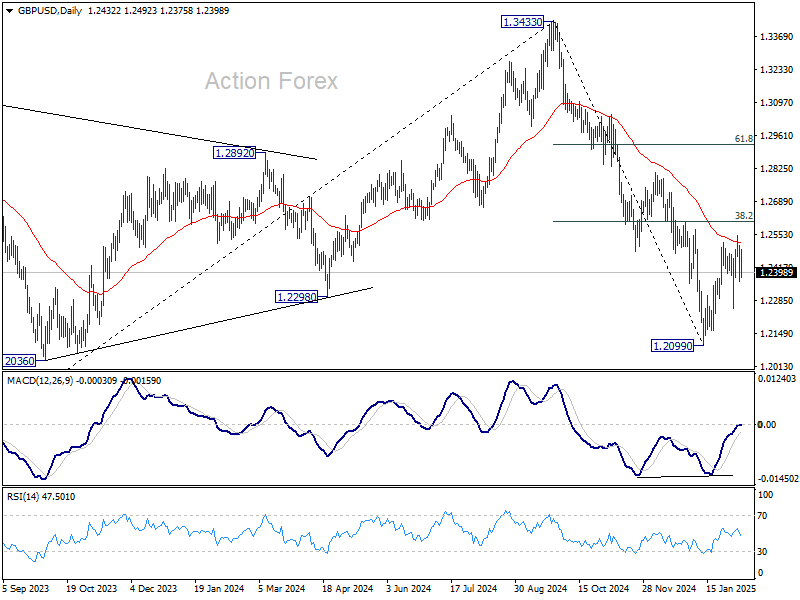
GBP/USD Weekly Outlook
GBP/USD edged higher to 1.2549 last week but lost momentum quickly. Initial bias stays neutral this week first. While corrective rebound from 1.2099 might still extend, upside should be limited by 38.2% retracement of 1.3433 to 1.2099 at 1.2609. On the downside, break of 1.2248 support will bring retest of 1.2099 low. Firm break there will resume whole fall from 1.3433. However, decisive break of 1.2609 will raise the chance of near term reversal, and target 61.8% retracement at 1.2923.
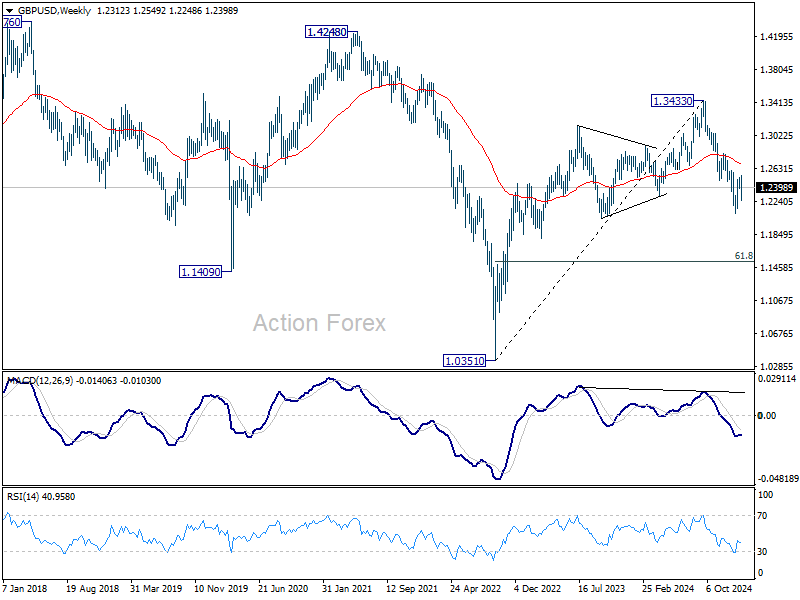
In the bigger picture, rise from 1.0351 (2022 low) should have already completed at 1.3433 (2024 high), and the trend has reversed. Further fall is now expected as long as 1.2810 resistance holds. Deeper decline should be seen to 61.8% retracement of 1.0351 to 1.3433 at 1.1528, even as a corrective move. However, firm break of 1.2810 will dampen this bearish view and bring retest of 1.3433 high instead.
In the long term picture, price actions from 1.0351 (2022 low) are seen as a corrective pattern to the long term down trend from 2.1161 (2007 high) only. Outlook will be neutral at best as long as 1.4248 structural resistance holds, even in case of strong rebound.
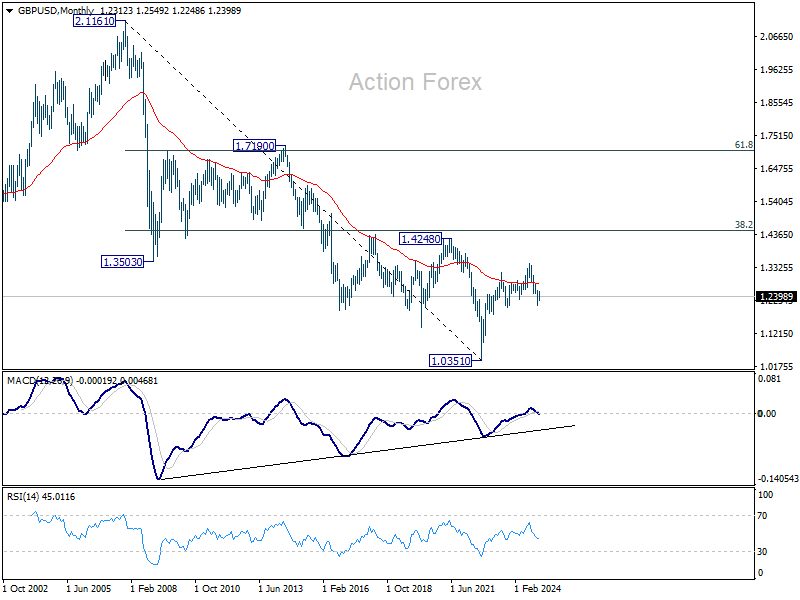
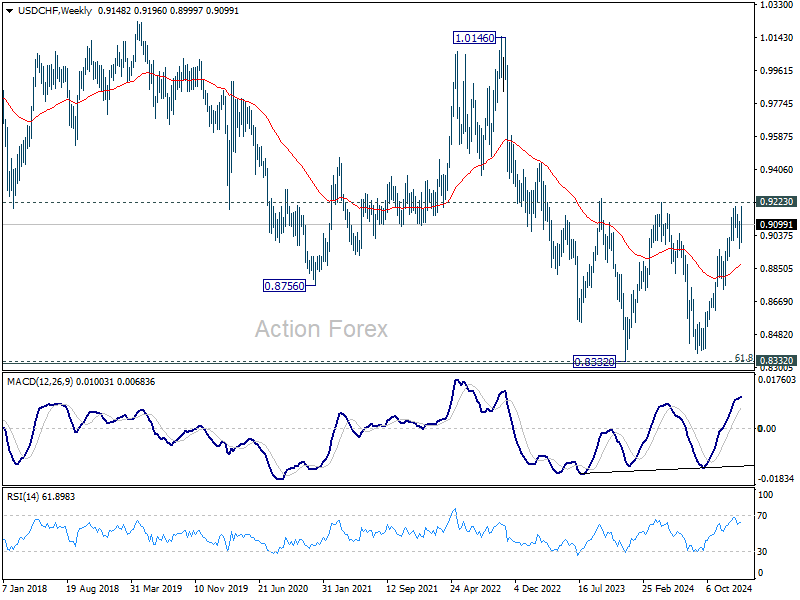
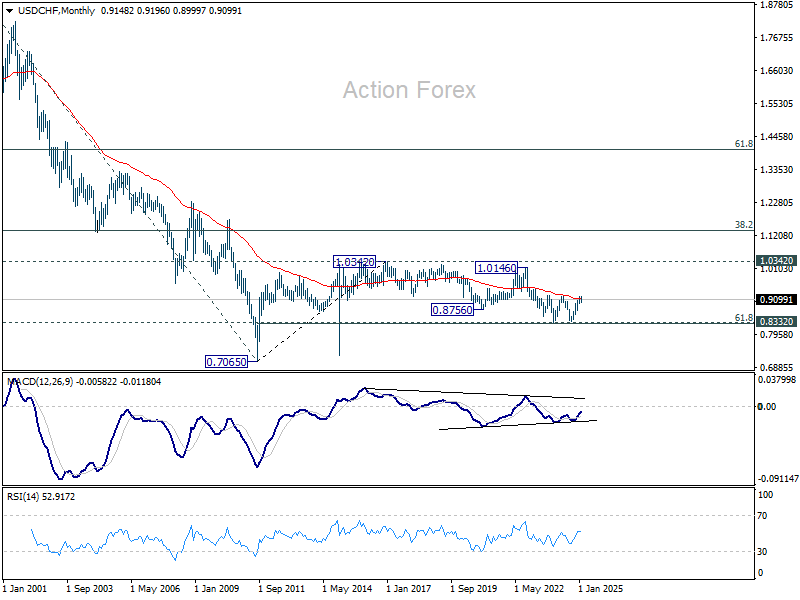
USD/CHF Weekly Outlook
Despite all the volatility last week, USD/CHF is still bounded in range trading below 0.9200. Initial bias stays neutral this week first. Further rally is expected with 0.8956 resistance turned support intact. Firm break of 0.9200/9223 will resume the whole rally from 0.8374 and carry larger bullish implication. However, sustained break of 0.8964 will complete a double top reversal pattern, and turn bias to the downside for deeper decline.
In the bigger picture, decisive break of 0.9223 resistance will argue that whole down trend from 1.0342 (2017 high) has completed with three waves down to 0.8332 (2023 low). Outlook will be turned bullish for 1.0146 resistance next. Nevertheless, rejection by 0.9223 will retain medium term bearishness for another decline through 0.8332 at a later stage.
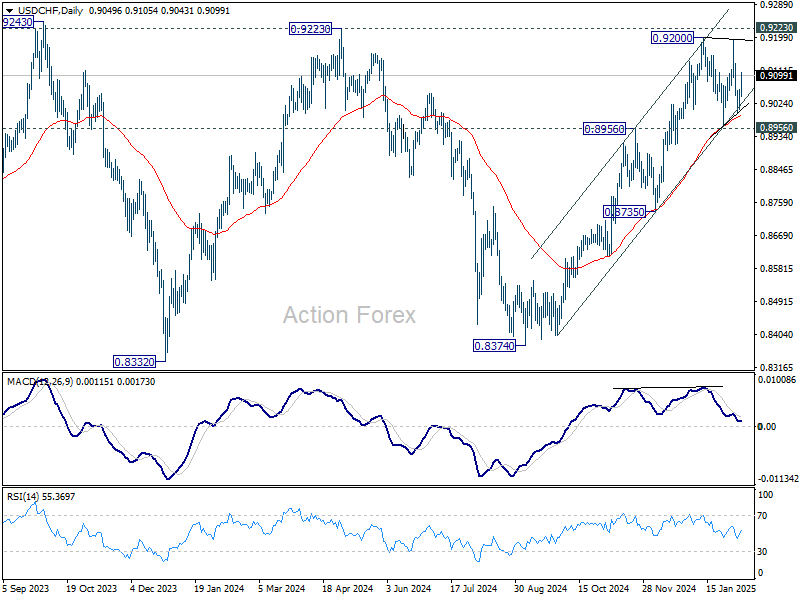
In the long term picture, price action from 0.7065 (2011 low ) are seen as a corrective pattern to the multi-decade down trend from 1.8305 (2000 high). Fall from 1.0342 (2016 high) is seen as the second leg. Sustained break of 55 M EMA (now at 0.9131) will indicate that the third leg has already started. However, rejection by 55 M EMA again, followed by break of 61.8% retracement of 0.7065 to 1.0342 at 0.8317, will pave the way back to 0.7065.
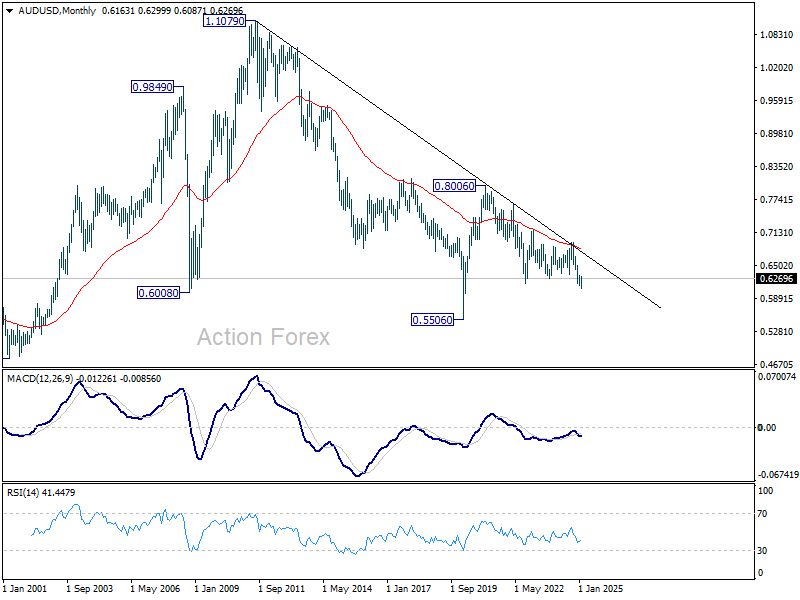
AUD/USD Weekly Report
AUD/USD spiked lower to 0.6087 last week but rebounded strongly since then. But with 0.6329 resistance intact, outlook will stay bearish. Initial bias remains neutral this week first. Below 0.6239 minor support will turn bias back to the downside for retesting 0.6087 low. However, firm break of 0.6329 will bring stronger rebound to 38.2% retracement of 0.6941 to 0.6087 at 0.6413, even just as a corrective move.
In the bigger picture, fall from 0.6941 (2024 high) is seen as part of the down trend from 0.8006 (2021 high). Next medium term target is 61.8% projection of 0.8006 to 0.6169 from 0.6941 at 0.5806. In any case, outlook will stay bearish as long as 55 W EMA (now at 0.6525) holds.
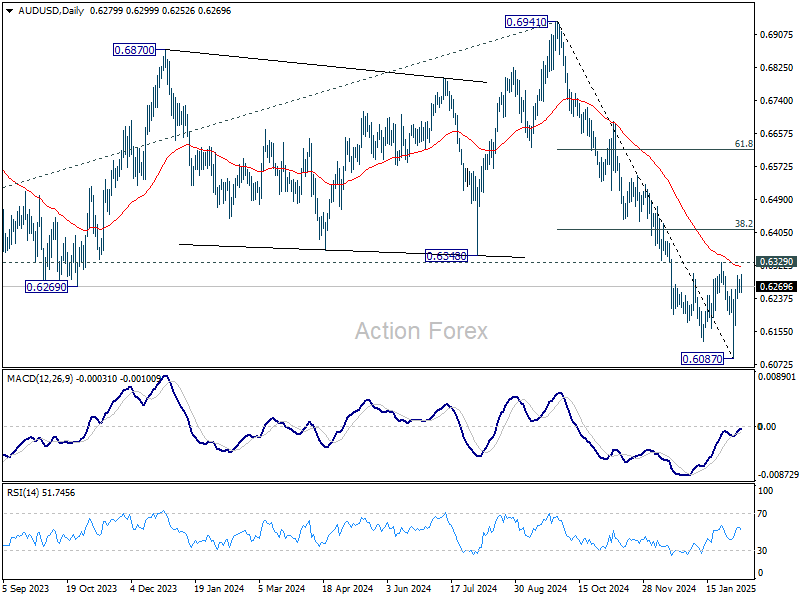
In the long term picture, prior rejection by 55 M EMA (now at 0.6846) is taken as a bearish signal. But for now, fall from 0.8006 is still seen as the second leg of the corrective pattern from 0.5506 long term bottom (2020 low). Hence, in case of deeper fall, strong support should emerge above 0.5506 to contain downside to bring reversal. However, this view is subject to adjustment if current decline accelerates further.
USD/CAD Weekly Outlook
USD/CAD spiked higher to 1.4791 last week but reversed sharply from there. Nevertheless, downside is contained by 1.4260 cluster support (38.2% retracement of 1.3418 to 1.4791 at 1.4267), which is also close to 55 D EMA (now at 1.4264). There is no sign of reversal yet. Initial bias remains neutral this week first. On the upside, above 1.4501 minor resistance will turn bias back to the upside for stronger rebound. Larger up trend is expected to resume through 1.4791 at a later stage. However, firm break of 1.4260 will indicate that deeper correction is underway.
In the bigger picture, long term up trend is tentatively seen as resuming with breach of 1.4667/89 key resistance zone (2020/2015 highs). Next target is 100% projection of 1.2401 to 1.3976 from 1.3418 at 1.4993. This will remain the favored case as long as 1.3976 resistance turned holds (2022 high), even in case of deep pullback.
In the longer term picture, up trend from 0.9506 (2007 low) is in progress and possibly resuming. Next target is 61.8% projections of 0.9406 to 1.4689 from 1.2005 at 1.5270. While rejection by 1.4689 will delay the bullish case, further rally will remain in favor as long as 55 M EMA (1.3392) holds.