Sample Category Title
USD/CHF Mid-Day Outlook
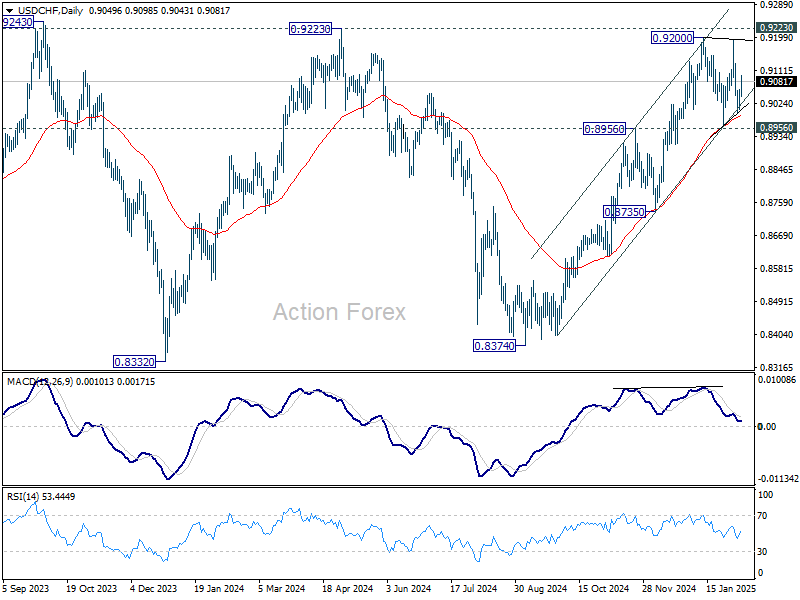
Daily Pivots: (S1) 0.9015; (P) 0.9038; (R1) 0.9074; More…
Intraday bias in USD/CHF stays neutral at this point. Consolidation from 0.9200 could extend further. Outlook will remain bullish as long as 0.8956/64 support holds. Firm break of 0.9200/9223 will resume the whole rally from 0.8374 and carry larger bullish implication. However, sustained break of 0.8964 will complete a double top reversal pattern, and turn bias to the downside for deeper decline.
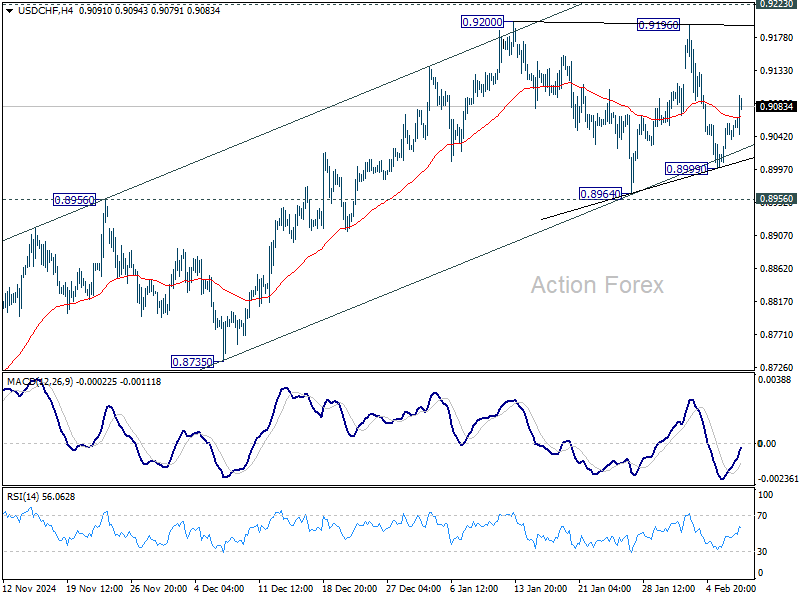
In the bigger picture, decisive break of 0.9223 resistance will argue that whole down trend from 1.0342 (2017 high) has completed with three waves down to 0.8332 (2023 low). Outlook will be turned bullish for 1.0146 resistance next. Nevertheless, rejection by 0.9223 will retain medium term bearishness for another decline through 0.8332 at a later stage.
GBP/USD Mid-Day Outlook
Daily Pivots: (S1) 1.2360; (P) 1.2437; (R1) 1.2511; More...
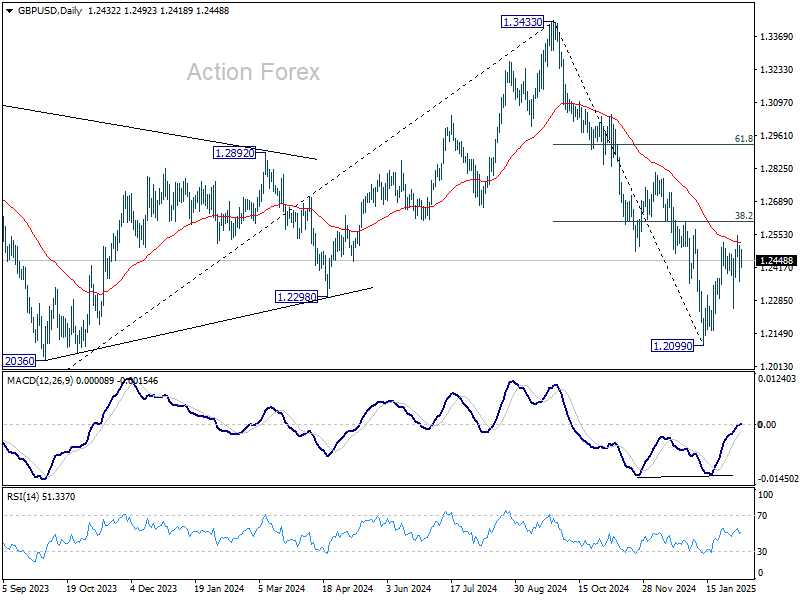
Intraday bias in GBP/USD stays neutral for the moment. While corrective rebound from 1.2099 could still extend, upside should be limited by 38.2% retracement of 1.3433 to 1.2099 at 1.2609. On the downside, break of 1.2248 support will bring retest of 1.2099 first. Firm break there will resume whole decline from 1.3433. However, decisive break of 1.2609 will raise the chance of near term reversal, and target 61.8% retracement at 1.2923.
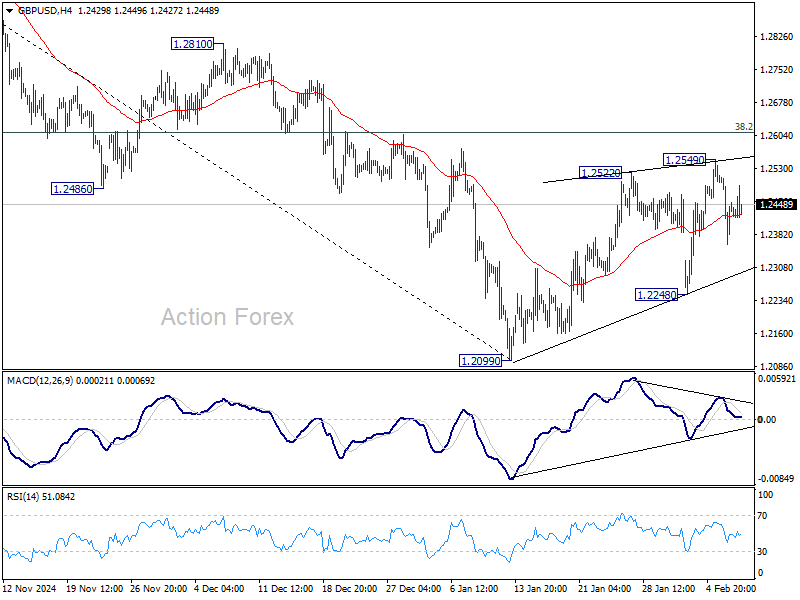
In the bigger picture, rise from 1.0351 (2022 low) should have already completed at 1.3433 (2024 high), and the trend has reversed. Further fall is now expected as long as 1.2810 resistance holds. Deeper decline should be seen to 61.8% retracement of 1.0351 to 1.3433 at 1.1528, even as a corrective move. However, firm break of 1.2810 will dampen this bearish view and bring retest of 1.3433 high instead.
EUR/USD Mid-Day Outlook
Daily Pivots: (S1) 1.0355; (P) 1.0381; (R1) 1.0410; More...
EUR/USD dips mildly but stays well inside range of 1.0176/0531. Intraday bias remains neutral and more consolidations could be seen. Strong resistance is expected from 1.0531 to limit upside. On the downside, break of 1.0176 will resume whole fall from 1.1213. However, sustained break of 1.0531 will rise the chance of bullish reversal and turn bias back to the upside for stronger rally.

In the bigger picture, immediate focus is back on 61.8 retracement of 0.9534 (2022 low) to 1.1274 (2024 high) at 1.0199. Sustained break there will solidify the case of medium term bearish trend reversal, and pave the way back to 0.9534. However, strong support from 1.0199 will argue that price actions from 1.1274 are merely a corrective pattern, and has already completed.

Dollar Gains Modestly on NFP, But Lacks Momentum
Dollar edged higher in early US session following the non-farm payrolls (NFP) report, but the overall momentum remains lackluster. Stock futures are flat, while 10-year Treasury yield is staging a slight recovery, suggesting a measured market response as traders hold back from aggressive positioning ahead of next week's key economic events including US CPI and Fed Chair Jerome Powell's testimony.
While headline NFP figure of 143k fell short of expectations, the dip in the unemployment rate to 4.0% and strong wage growth at 0.5% mom have reinforced the Fed’s cautious stance towards further policy easing. Markets now see over 90% chance that Fed will keep rates unchanged in March, while expectations for another hold in May stands at 70%.
Overall, despite today's recovery, Dollar is still trading as the worst performer for the week, followed by Euro, and then Swiss Franc. Yen continues to sit at the top of the ladder, followed by Canadian, and then Aussie. Kiwi and Sterling are mixed in the middle.
In Europe, at the time of writing, FTSE is down -0.18%. DAX is down -0.06%. CAC is down -0.02%. UK 10-year yield is down -0.0014 at 4.489. Germany 10-year yield s up 0.0149 at 2.395. Earlier in Asia, Nikkei fell -0.72%. Hong Kong HSI rose 1.16%. China Shanghai SSE rose 1.01%. Singapore Strait Times rose 0.81%. Japan 10-year JGB yield rose 0.0357 to 1.303.
US NFP grows 143k, wages growth strong
US non-farm payroll job growth fell short of expectations but wage growth exceeding forecasts. Employers added 143k jobs, missing the 169k estimate and coming in below the 2024 monthly average of 166k. However, the downward surprise was offset by a significant upward revision to December’s number, which was adjusted from 256k to 307k.
Unemployment rate unexpectedly dropped from 4.1% to 4.0%. At the same time, the labor force participation rate ticked slightly higher to 62.6%, reinforcing signs of a still-active workforce. While the decline in headline job creation might signal a cooling labor market, the improvement in unemployment suggests that the slowdown is not yet severe.
The standout data point in the report was wage growth, with average hourly earnings surging 0.5% mom, surpassing the expected 0.3% mom increase. On an annual basis, wages rose 4.1% yoy, a sign that businesses are still competing for workers despite moderation in hiring.
Canada's employment grows 76k, unemployment rate down to 6.6%
Canada’s labor market significantly outperformed expectations in January, with employment rising by 76.0k, far exceeding 26.5k forecast. The biggest job gains were seen in manufacturing (+33k, +1.8%) and professional, scientific, and technical services (+22k, +1.1%).
The unexpected strength in employment was further reinforced by decline in the unemployment rate from 6.7% to 6.6%, beating market expectations of a slight uptick to 6.8%.
Despite the surge in hiring, wage growth showed signs of moderation, with average hourly earnings rising 3.5% yoy, down from 4.0% yoy in December. Total actual hours worked rose 0.9% mom, with a 2.2% annual increase.
IMF backs BoJ’s gradual rate hikes, sees policy rate moving toward neutral by 2027
Nada Choueiri, deputy director of IMF’s Asia-Pacific Department and mission chief for Japan, stated that IMF remains “supportive” of BoJ’s current monetary policy course. She emphasized that rate hikes should be implemented in a gradual and flexible manner to ensure that domestic demand continues to recover.
Choueiri projected that BoJ’s policy rate could rise “beyond 0.5%” by the end of this year, with a longer-term path toward the “neutral level” by the end of 2027.
IMF estimates Japan’s neutral rate to be within a band of 1% to 2%, with a midpoint of 1.5%.
Also, IMF maintains an optimistic outlook for Japan’s economy, forecasting 1.1% GDP growth in 2025, supported by increasing wages and stronger consumer spending.
Given these projections, IMF expects BoJ to continue its tightening cycle in a controlled manner.
EUR/USD Mid-Day Outlook
Daily Pivots: (S1) 1.0355; (P) 1.0381; (R1) 1.0410; More...
EUR/USD dips mildly but stays well inside range of 1.0176/0531. Intraday bias remains neutral and more consolidations could be seen. Strong resistance is expected from 1.0531 to limit upside. On the downside, break of 1.0176 will resume whole fall from 1.1213. However, sustained break of 1.0531 will rise the chance of bullish reversal and turn bias back to the upside for stronger rally.
In the bigger picture, immediate focus is back on 61.8 retracement of 0.9534 (2022 low) to 1.1274 (2024 high) at 1.0199. Sustained break there will solidify the case of medium term bearish trend reversal, and pave the way back to 0.9534. However, strong support from 1.0199 will argue that price actions from 1.1274 are merely a corrective pattern, and has already completed.
Canada’s employment grows 76k, unemployment rate down to 6.6%
Canada’s labor market significantly outperformed expectations in January, with employment rising by 76.0k, far exceeding 26.5k forecast. The biggest job gains were seen in manufacturing (+33k, +1.8%) and professional, scientific, and technical services (+22k, +1.1%).
The unexpected strength in employment was further reinforced by decline in the unemployment rate from 6.7% to 6.6%, beating market expectations of a slight uptick to 6.8%.
Despite the surge in hiring, wage growth showed signs of moderation, with average hourly earnings rising 3.5% yoy, down from 4.0% yoy in December. Total actual hours worked rose 0.9% mom, with a 2.2% annual increase.
US NFP grows 143k, wages growth strong
US non-farm payroll job growth fell short of expectations but wage growth exceeding forecasts. Employers added 143k jobs, missing the 169k estimate and coming in below the 2024 monthly average of 166k. However, the downward surprise was offset by a significant upward revision to December’s number, which was adjusted from 256k to 307k.
Unemployment rate unexpectedly dropped from 4.1% to 4.0%. At the same time, the labor force participation rate ticked slightly higher to 62.6%, reinforcing signs of a still-active workforce. While the decline in headline job creation might signal a cooling labor market, the improvement in unemployment suggests that the slowdown is not yet severe.
The standout data point in the report was wage growth, with average hourly earnings surging 0.5% mom, surpassing the expected 0.3% mom increase. On an annual basis, wages rose 4.1% yoy, a sign that businesses are still competing for workers despite moderation in hiring.
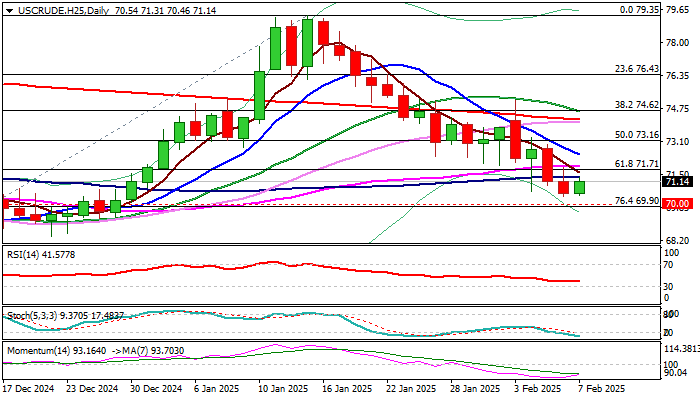
WTI Oil: Larger Bears Taking a Breather Ahead of Key $70.00 Support Zone
WTI oil price edged higher on Friday as larger bears are taking a breather after this week’s strong fall.
Fresh gains were sparked by new US sanctions on Iran’s crude exports, which partially countered strong pressure on oil price from growing fears about US-China trade war and its consequences on global economy.
Recovery was underpinned by rising thin daily cloud, but upticks were so far limited by broken 100DMA ($71.36).
Firmly bearish technical picture on daily chart contributes potential scenario of limited bounce rather to offer better selling opportunities than to mark a more significant correction.
The WTI contract is on track for the third consecutive strong weekly loss that weighs on near-term outlook.
Weekly close below broken Fibo support at $71.71 (61.8% of $66.98/$79.35 rally) to confirm that bears remain firmly in play for attack at next key supports at $70 zone (psychological / Fibo 76.4%), guarding $68.44 (Dec 20 low) and $66.98 (Dec 6 low).
Above 100DMA, significant barriers lay at $71.93 (55DMA) and $72.53 (falling 10DMA).
Res: 73.16; 73.63; 74.29; 74.52.
Sup: 72.01; 71.71; 71.18; 70.00.
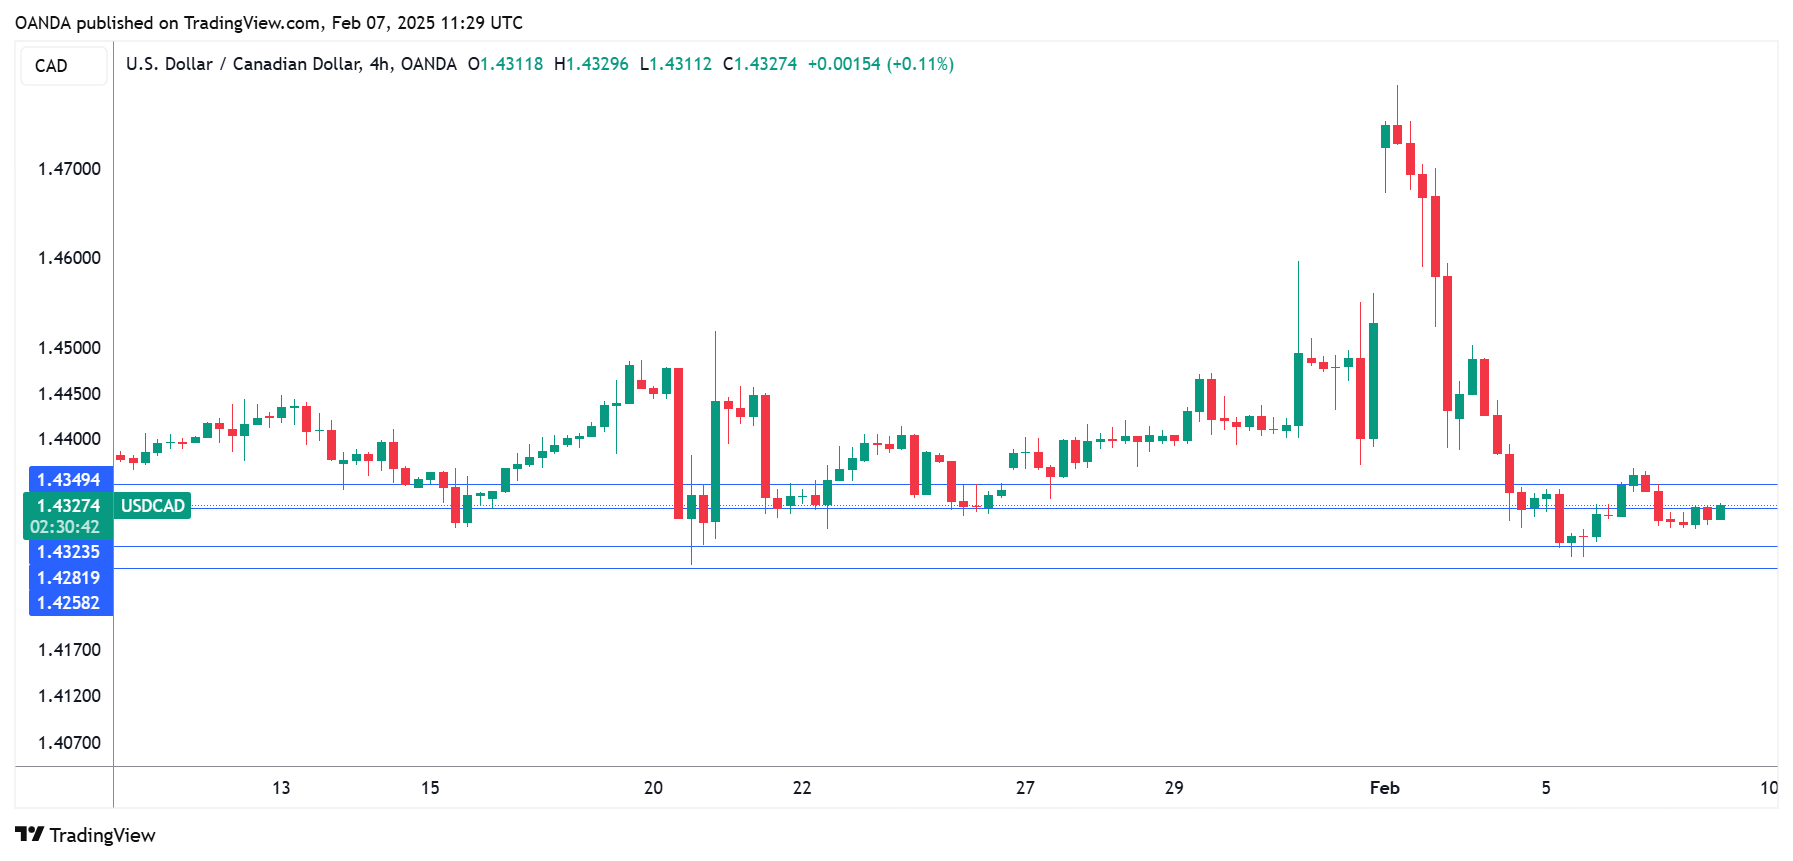
Can. Dollar Lower Ahead of US, Canada Jobs Data
The Canadian dollar is showing limited movement for third consecutive day. In the European session, USD/CAD is trading at 1.4328, up 0.14% on the day.
The week wraps up with January employment reports from both Canada and the US, which could mean USD/CAD will be active in the North American session. Canada and the US are coming off sparkling job growth numbers in December and it will be interesting to see how the market reacts to the January data, which is expected to be much lower.
Employment in Canada climbed 91 thousand in December, a blowout reading which was the largest gain since Jan. 2023. It was the fourth straight monthly increase and that trend is expected to continue, with a market estimate of 25 thousand for January. The unemployment rate is expected to rise to 6.9%, up from 6.7% in December. This would be the highest unemployment rate since Sep. 2021 and would support the case for further rate- cutting from the Bank of Canada.
US nonfarm payrolls expected to drop
The US wraps up the week with nonfarm payrolls, one of the most important economic events. The market estimate stands at 170 thousand for January, after a surprisingly strong gain of 256 thousand in December. If the January forecast is accurate, it would mark a sharp drop that would make headlines, but it would not be far off the past three-month average.
The Federal Reserve is unlikely to show much concern if job creation slows, as long as the labor market is cooling at a slow pace. The Fed is expected to cut rates only once or twice this year, but that could change if inflation or the labor market provide any surprises.
USD/CAD Technical
- USD/CAD is testing resistance at 1.4324. Above, there is resistance at 1.4348
- There is support at 1.4282 and 1.4258
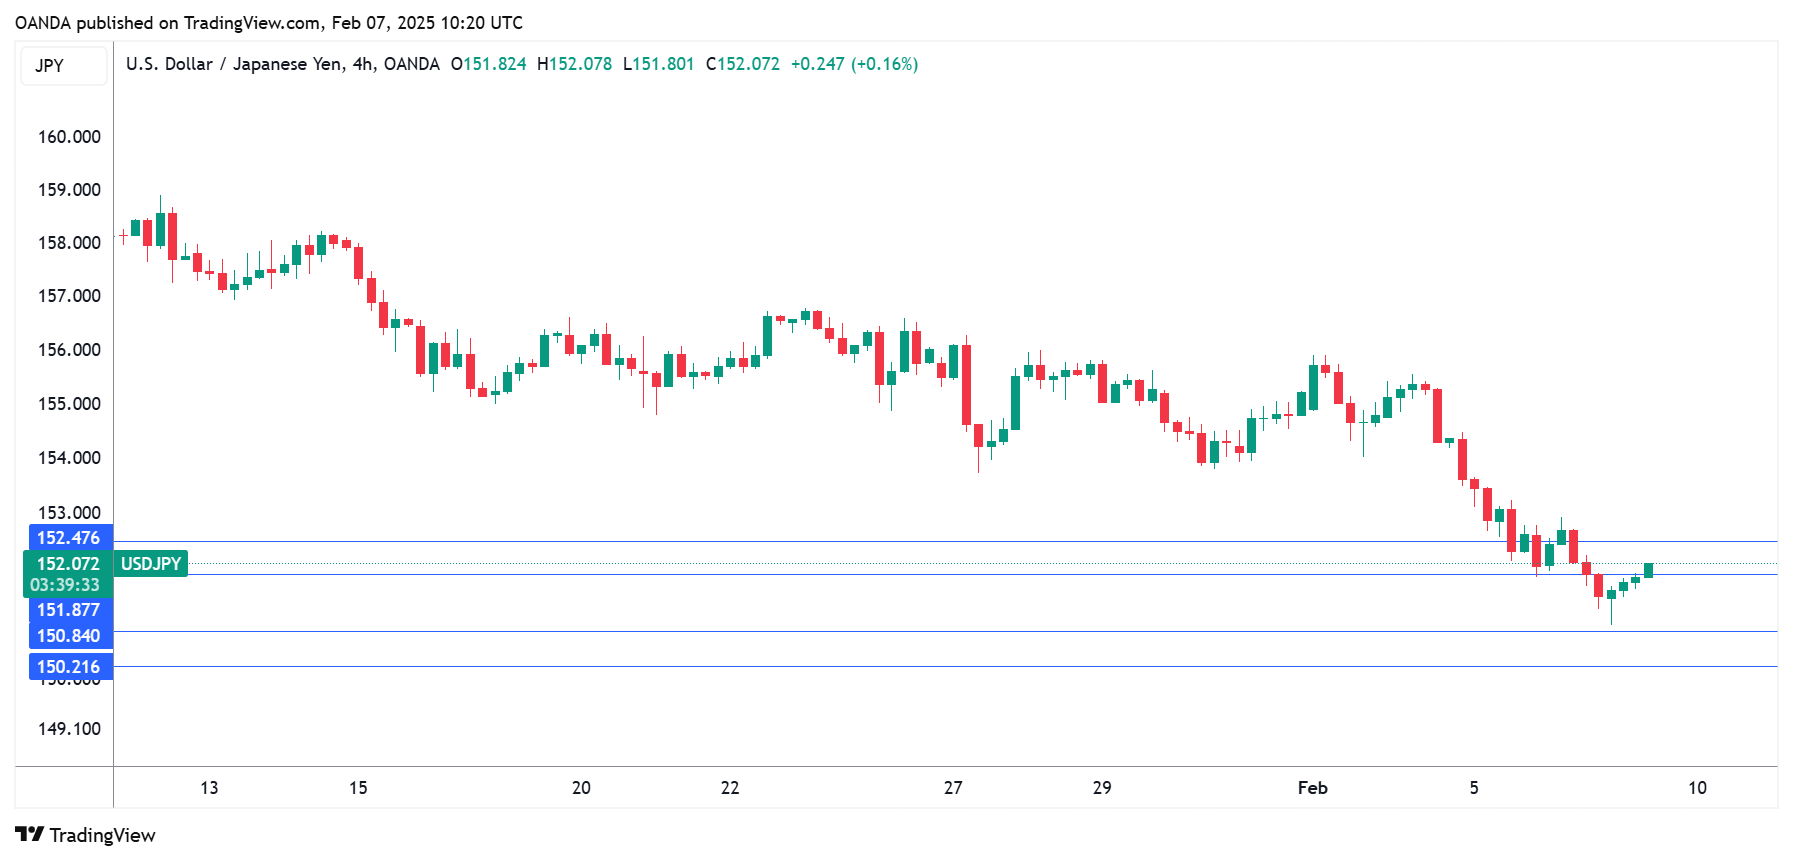
Yen Eyes US Payrolls, Japan Household Spending Jumps
The Japanese yen is in negative territory on Friday. This follows a two-day rally which saw the yen jump 1.9% and hit a three-month high. In the European session, USD/JPY is trading at 151.94, up 0.39% on the day. On the data front, Japan’s household spending was much stronger than expected and the US releases nonfarm payrolls.
Japan’s household spending hits 2.5-year high
Japan’s household spending has been struggling as inflation remains relatively high. This made the December report a pleasant surprise, as household spending was much higher than expected. Annually, household spending climbed 2.7%, crushing the market estimate of 0.2% and rebounding from -0.4% in November. The monthly gain of 2.3% followed the November reading of 0.4% and beat the market estimate of -0.5%.
Household spending was the strongest since Aug. 2022, driven by strong wage gains. However, it is questionable whether the impressive gain is a temporary blip, given that the December wage growth was largely driven by bonuses. Still, real wages (adjusted for inflation) rose for a second straight month in December, which supports the case for the Bank of Japan to continue raising interest rates. BoJ policy makers have been unusually candid about plans to raise rates, although the timing is uncertain, with May or August strong possibilities for the next rate hike.
US nonfarm payrolls expected to drop
The US wraps up the week with nonfarm payrolls, one of the most important economic events. The market estimate stands at 170 thousand for January, after a surprisingly strong gain of 256 thousand in December. If the January forecast is accurate, it would mark a sharp drop that would make headlines, but is close to the past three-month average.
The Federal Reserve won’t be worried if job creation slows, as long as the labor market is cooling at a slow pace. The Fed is expected to cut rates only once or twice this year, but that could change if inflation or the labor market provide any surprises.
USD/JPY Technical
- USD/JPY is testing resistance at 151.86. Next, there is resistance at 152.48
- 150.83 and 150.21 are the next support levels
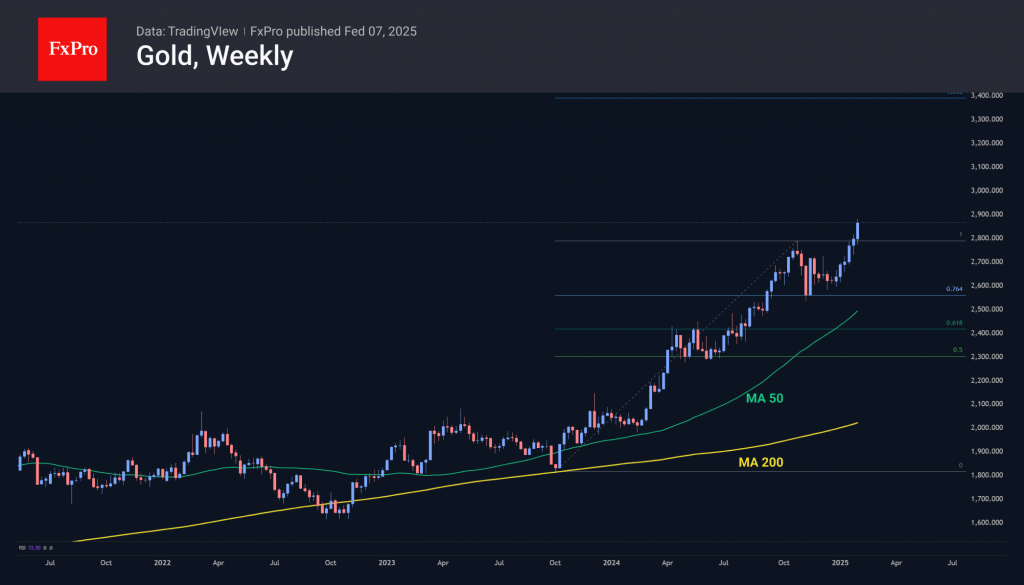
Gold’s Rise: A New Bull Market Dawns
Gold prices reached all-time highs at the end of last month and have continued to climb steadily into the first week of February. This marks the sixth consecutive bullish weekly candle, with a 2.5% gain over the past seven days. This performance is noteworthy, especially given the fluctuations in most other markets.
From a technical perspective, gold is starting a Fibonacci extension pattern. The global rally commenced in October 2023 following initial signals from the Federal Reserve indicating an easing of monetary policy and a subsequent slowdown in the pace of rate hikes. Between October and November 2024, after appreciating by 55% to reach the $2790 level, gold experienced significant profit-taking, resulting in a pullback to $2550, which represents 76.4% of the initial rally. This was followed by several weeks of intense trading between bullish and bearish market participants.
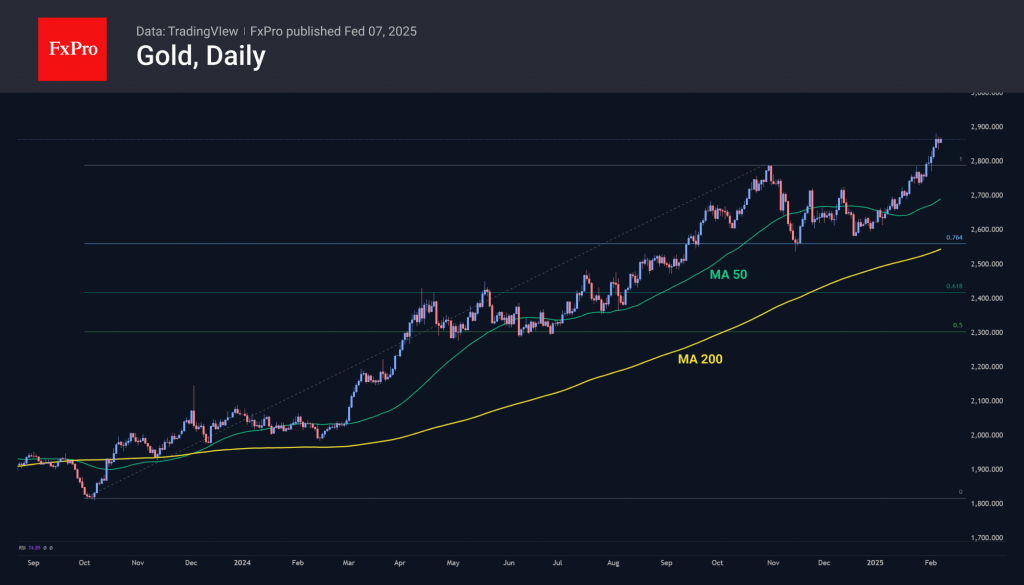
By the end of December, steady buying momentum had returned to the gold market. A move above $2800 in late January has led to discussions about the potential onset of a new global growth wave. If this trend continues, the price of gold may potentially reach the $3400 per troy ounce area between August and October of this year.
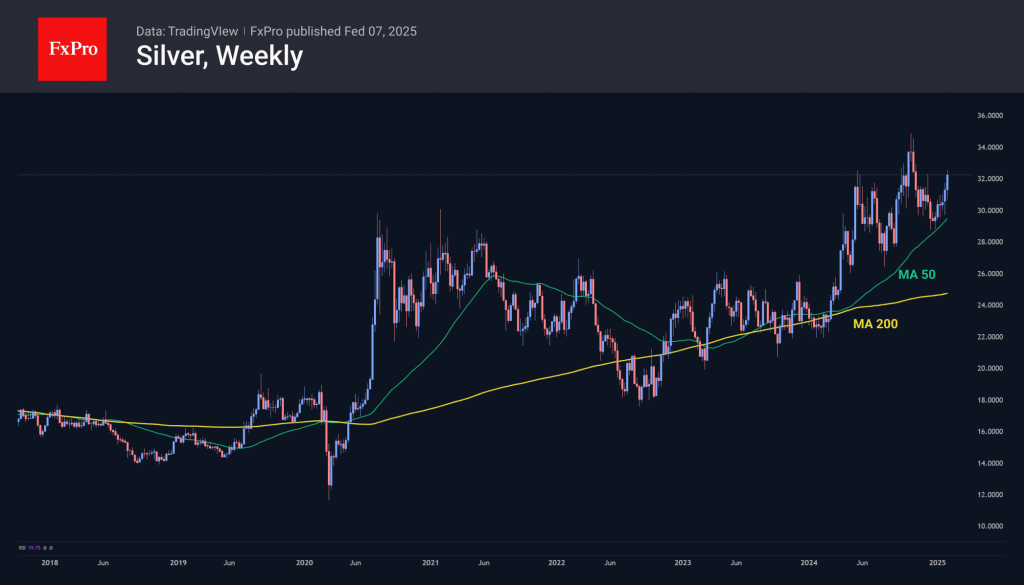
In contrast, silver remains more subdued, currently sitting 7% below its highs from October last year. However, it has shown strong performance over the past week. Should gold continue its upward trajectory, silver is expected to rise at a faster pace, thereby recovering lost ground.