
Sample Category Title
AUD/USD Daily Report
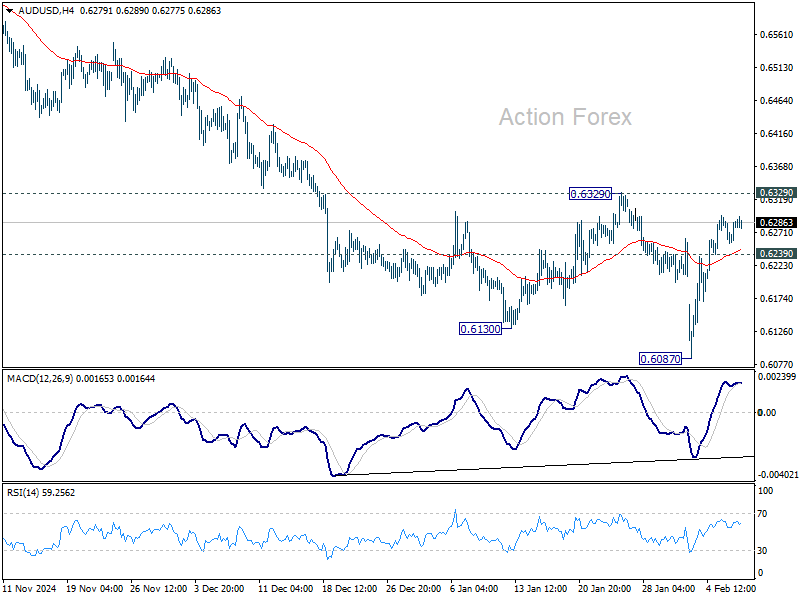
Daily Pivots: (S1) 0.6263; (P) 0.6276; (R1) 0.6296; More...
Intraday bias in AUD/USD remains neutral for the moment. Further decline is expected as long as 0.6329 resistance holds. Below 0.6239 minor support will bring retest of 0.6087 short term bottom first. Further break of 0.6087 will resume larger fall from 0.6941. However, firm break of 0.6329 will turn bias back to the upside for stronger rebound.
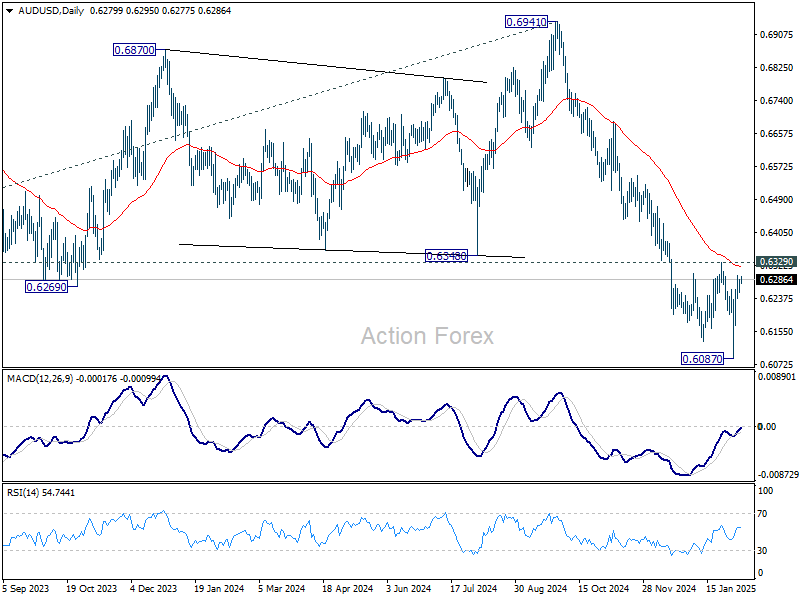
In the bigger picture, fall from 0.6941 (2024 high) is seen as part of the down trend from 0.8006 (2021 high). Next medium term target is 61.8% projection of 0.8006 to 0.6169 from 0.6941 at 0.5806. In any case, outlook will stay bearish as long as 55 W EMA (now at 0.6511) holds.
EUR/USD Daily Outlook
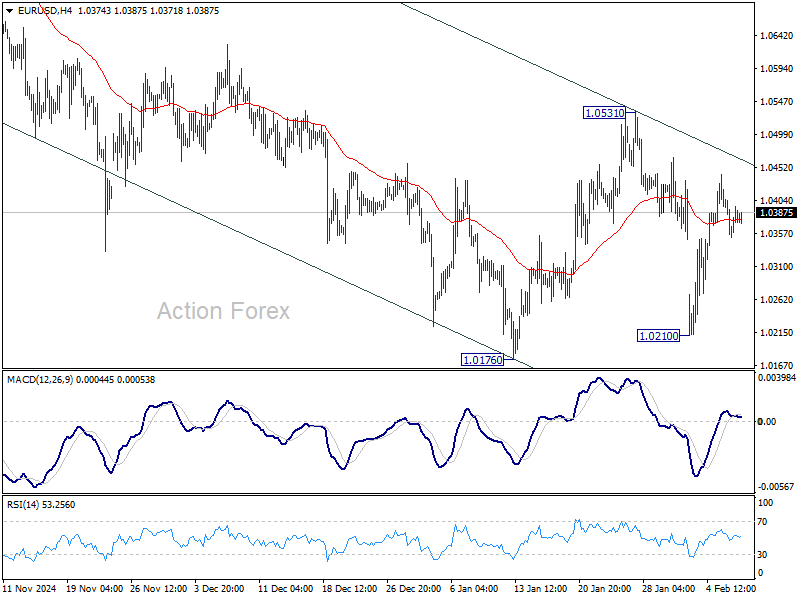
Daily Pivots: (S1) 1.0355; (P) 1.0381; (R1) 1.0410; More...
EUR/USD is staying in consolidation from 1.0176 and intraday bias remains neutral. Strong resistance is expected from 1.0531 to limit upside. On the downside, break of 1.0176 will resume whole fall from 1.1213. However, sustained break of 1.0531 will rise the chance of bullish reversal and turn bias back to the upside for stronger rally.
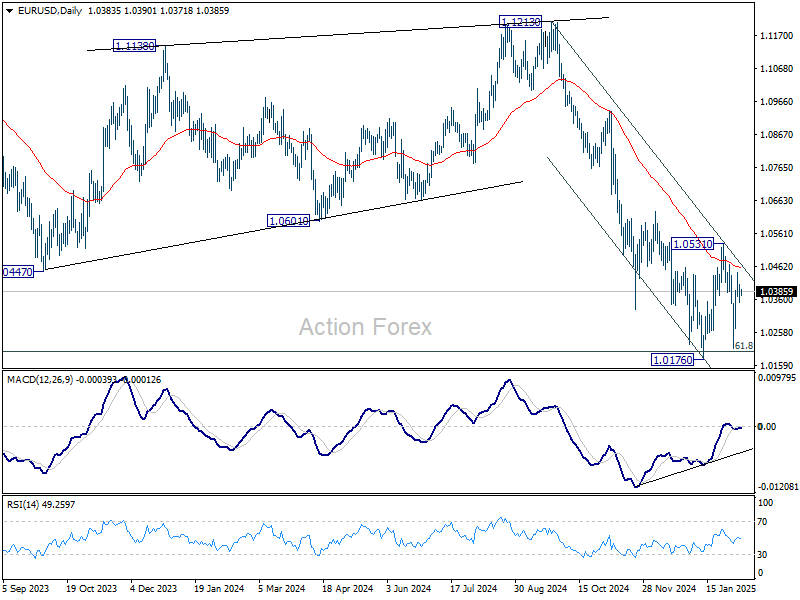
In the bigger picture, immediate focus is back on 61.8 retracement of 0.9534 (2022 low) to 1.1274 (2024 high) at 1.0199. Sustained break there will solidify the case of medium term bearish trend reversal, and pave the way back to 0.9534. However, strong support from 1.0199 will argue that price actions from 1.1274 are merely a corrective pattern, and has already completed.
GBP/USD Daily Outlook
Daily Pivots: (S1) 1.2360; (P) 1.2437; (R1) 1.2511; More...
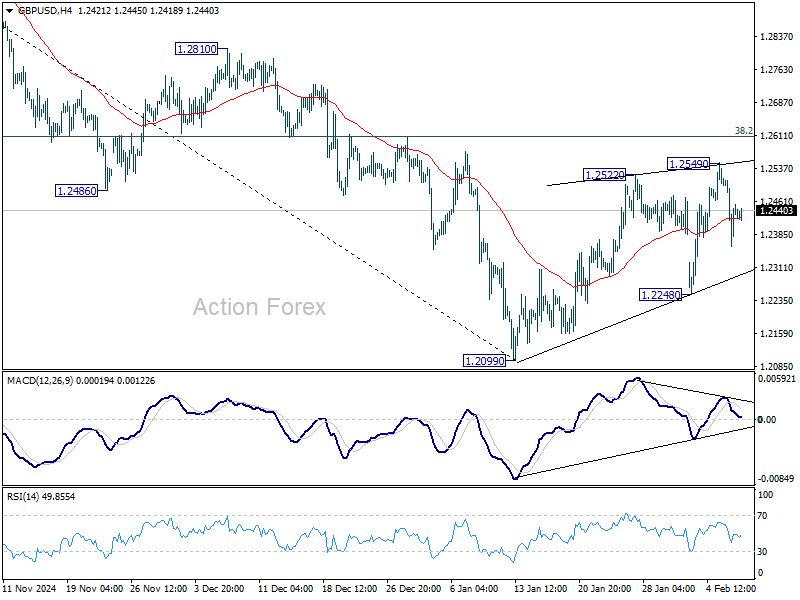
Intraday bias in GBP/USD remains neutral and outlook is unchanged. While corrective rebound from 1.2099 could still extend, upside should be limited by 38.2% retracement of 1.3433 to 1.2099 at 1.2609. On the downside, break of 1.2248 support will bring retest of 1.2099 first. Firm break there will resume whole decline from 1.3433. However, decisive break of 1.2609 will raise the chance of near term reversal, and target 61.8% retracement at 1.2923.
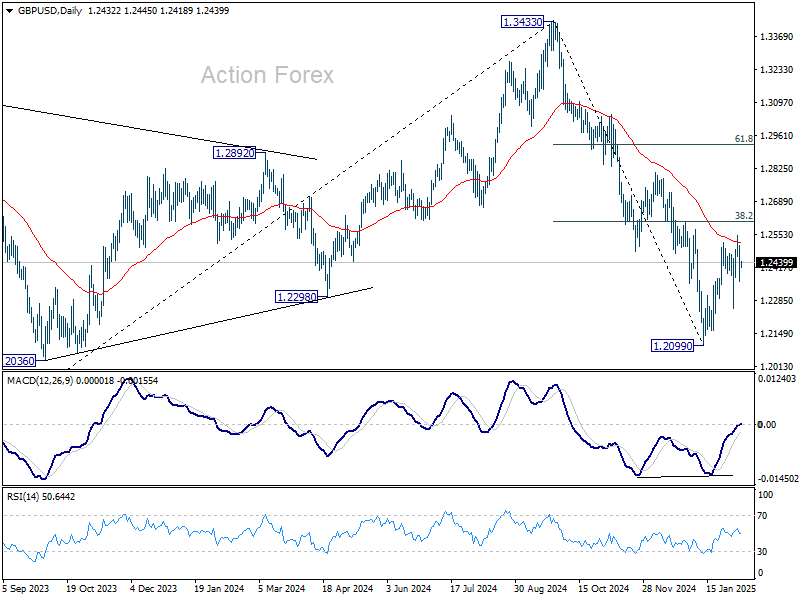
In the bigger picture, rise from 1.0351 (2022 low) should have already completed at 1.3433 (2024 high), and the trend has reversed. Further fall is now expected as long as 1.2810 resistance holds. Deeper decline should be seen to 61.8% retracement of 1.0351 to 1.3433 at 1.1528, even as a corrective move. However, firm break of 1.2810 will dampen this bearish view and bring retest of 1.3433 high instead.
USD/CHF Daily Outlook
Daily Pivots: (S1) 0.9015; (P) 0.9038; (R1) 0.9074; More…
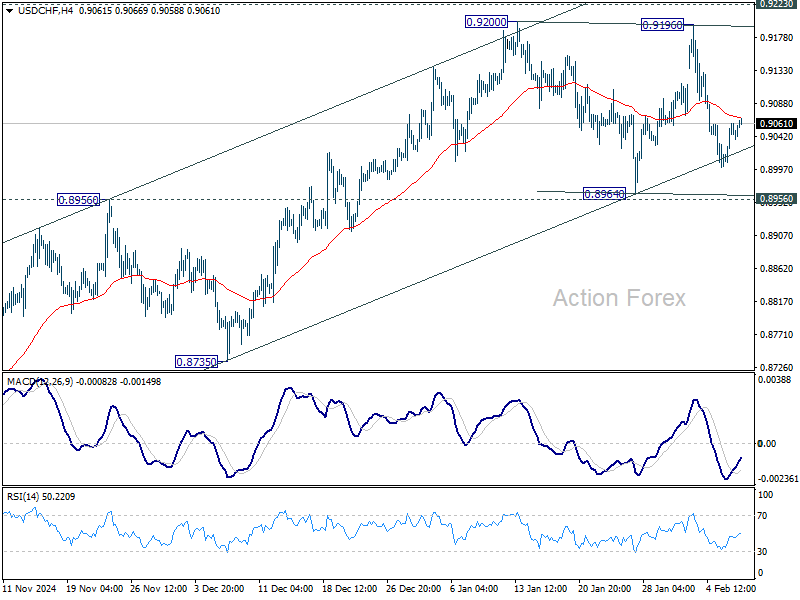
Intraday bias in USD/CHF remains neutral for the moment as consolidations from 0.9200 continues. Outlook will remain bullish as long as 0.8956/64 support holds. Firm break of 0.9200/9223 will resume the whole rally from 0.8374 and carry larger bullish implication. However, sustained break of 0.8964 will complete a double top reversal pattern, and turn bias to the downside for deeper decline.
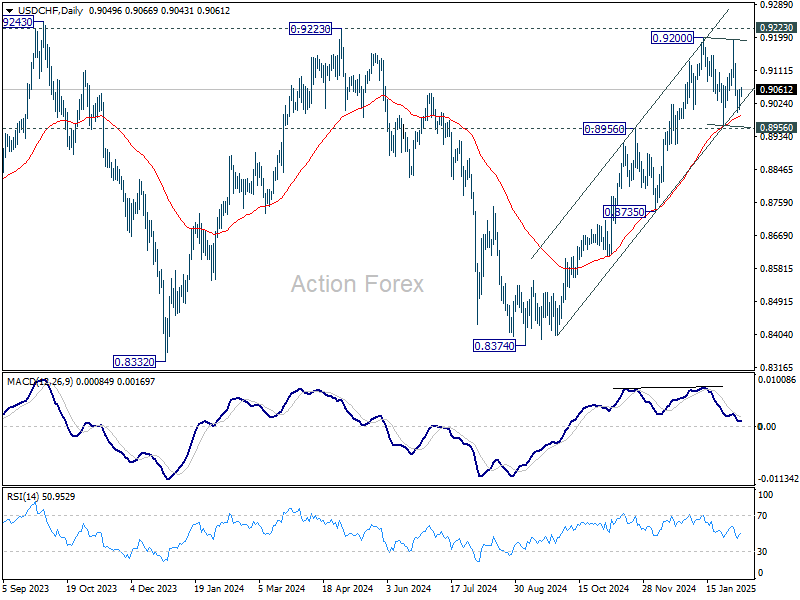
In the bigger picture, decisive break of 0.9223 resistance will argue that whole down trend from 1.0342 (2017 high) has completed with three waves down to 0.8332 (2023 low). Outlook will be turned bullish for 1.0146 resistance next. Nevertheless, rejection by 0.9223 will retain medium term bearishness for another decline through 0.8332 at a later stage.
US Payrolls Today’s Economic Highlight
Markets
The BoE cut its policy rate yesterday by 25 bps to 4.5% in a 7-2 vote (2 members in favour of 50 bps rate cut). BoE governor Bailey later warned not to read too much into this vote split as it is not a communication tool and as strategic considerations came into play for some members. New GDP and CPI forecasts point at a stagflation scenario with growth being significantly downwardly revised for this year (0.75% from 1.5%) while inflation is expected to peak again at higher levels (3.7% in Q3 2025). It prompted the BoE to take a “careful” (new addition) approach to further rate cuts. The prospect of more/longer interest rate support couldn’t help sterling given the bleak outlook. EUR/GBP extended this week’s rebound to close at 0.8351 from a start at 0.8318 with the downside in the pair looking (2024 low at 0.8223) ever more better protected.
US payrolls are today’s economic highlight. We assumed that data would lose some market moving potential after Fed members firmly played the extended rate pause card. This week’s outperformance of US Treasuries nevertheless shows that markets start contemplating (downside) risks to the US economy coming from president Trump’s trade/tariff politics. Especially given that the reaction function of the US’s trading partners clearly shifted compared with Trump’s previous term (retaliation, boycott,…). It suggests some asymmetric risks with markets more inclined to react to negative than positive surprises. US data released earlier this week (higher employment components ISM’s, strong ADP report, low jobless claims) don’t point in that direction though. Positive (European) risk sentiment yesterday failed to lift the euro’s spirits with EUR/USD ending close to unchanged below 1.04. The ECB releases a staff paper on the neutral rate estimate, upping the bottom from the current 1.75%-2.5%, which offers a new chance for the single currency to move somewhat higher. The Japanese yen’s outperformance is remarkable in this setting. USD/JPY fell from 152.61 to 151.41, extending Wednesday’s move on the back of higher earnings. They suggest more (and faster) policy normalization to come from the BoJ.
News & Views
The Reserve Bank of India (RBI) pivoted towards rate cuts this morning. After keeping rates steady for two years under former RBI governor Das, successor Malhotra delivered a first reduction from 6.5% to 6.25%. The unanimous decision was widely expected. The statement noted that “the existing growth-inflation dynamics, the MPC, while continuing with the neutral stance, felt that a less restrictive monetary policy is more appropriate at the current juncture.” First estimates showed that Indian economic growth slowed to a four-year low of 6.4% in the running fiscal year ending March 2025. Activity is expected to pick up to 6.7% in FY 2026 on household consumption and buoyancy in services export. Inflation eased from 5.5% to 5.2% in December, above the RBI 4% target. Annual inflation in current FY 2025 is seen at 4.8% before easing to 4.2% in the next. Risks to both growth and inflation are evenly balanced, the policy statement notes. The RBI offered itself all flexibility in terms of setting rates, saying it “will take a decision in each of its future meetings based on a fresh assessment of the economic outlook.” The Indian rupee trades a tad stronger against the US dollar around USD/INR 87.48 but remains near the all-time-lows.
The Czech National Bank (CNB) delivered a hawkish cut yesterday. Lowering the policy rate from 4% to 3.75% means it is approaching the 3.5% neutral rate fast. As restriction eases and some longer-term inflationary risks persist, the central bank will approach further monetary easing “with great caution”. The statement noted that policy could remain slightly restrictive for longer than expected in the baseline scenario – which assumes a further decline in interest rates through mid-2025 before stabilizing afterwards. New inflation forecasts show 2.4% for this year and 2.1% for 2026. The CNB noted, however, that yesterday’s higher-than-expected January flash CPI release already implies upside risks to this year’s forecast. Other risks include food and services (due to elevated wage growth) price inertia & higher public spending. The CNB has not offered a clear view on the impact of the new US administration though, saying only that it represents a source of uncertainty. Growth forecasts were lowered from 2.4% to 2% this year and kept unchanged at 2.4% for 2026. The Czech crown strengthened to EUR/CZK 25.08 yesterday. The currency remains trapped within a narrow sideways trading range which the CNB does not expect to change materially anytime soon: EUR/CZK is seen at 25.2 and 25.4 on average for this year and the next.
European Stocks at Record High, US Jobs in Focus
Monday’s trade tensions have been gradually waning, last week’s DeepSeek shocker is also digested among global tech investors. Earnings continue to flow in, on the other hand, and reinforce the narrative – or the fear – of rising AI spending and slowing growth. In this context, Amazon – that reported its latest quarter results yesterday after the bell – was the latest to post better-than-expected earnings and revenue but a slower growth of its cloud division. The company warned that the current quarter profit will miss expectations due to rising AI spending. Investors sent Amazon shares 4% lower in the afterhours trading despite a 75% increase in the EPS since last year. As a result, Amazon won’t print a post-earnings record high when the US markets open today, but the rally in Amazon’s share price has been accelerating lately, and the company is still a bright spot for AI investors, given that the AI and robotics could lead to important productivity gains and cost savings across their business units and give a sustainable boost to their future profits.
Overall, 6 of the Magnificent 7 companies have reported earnings so far, and they collectively reported a revenue growth of approximately 10% year-over-year for the fourth quarter of 2024. The combined net income for these six companies increased by about 15% compared to the same period last year. They gave cautious outlook for the coming quarters but said that they will increase spending on AI to make sure to lead the dance. Among the 6, Meta has been the brightest spot as the company is about to launch its own AI and Zuckerberg wants 1bn users globally to join in. While Tesla has been the least convincing, provided that the rising global dislike for Elon Musk starts taking a toll on company’s sales.
Zooming out, the S&P 500 and Nasdaq 100 are surviving the less-than-wow Big Tech earnings. Both indices hang on near their ATH levels. The easing US yields certainly give a hand to valuations despite uncertainties regarding what the Federal Reserve (Fed) should do next. This week’s US jobs data has so far given mixed signals with lower job openings in December, lower job cuts during the course of last year but a jump in terminations in January, weaker labour productivity, a weaker-than-expected jump in labour costs, and a stronger-than-expected ADP employment figures. Today, the official US jobs data is expected to print 169’000 new nonfarm jobs added last month, with a slightly slower wages growth and a stable unemployment rate near the 4.1%. But investors will also focus on the annual revisions to the jobs figures. Note that, the early estimates in August hinted that the US jobs numbers could see a downward revision of more than 800’000 jobs. Economists expect that the downward revision will rather be around 600-700’000 jobs. If that’s the case, the week will end with the narrative that the US jobs market is healthily slowing – a scenario that would allow the Fed to continue cutting the rates but not hurriedly, and keep the market sentiment at a sweet spot. A weaker-than-expected NFP figure, and/or rising wages would weigh on sentiment, while a stronger-than-expected NFP – if combined to softening wages would reinforce the goldilocks scenario. The US dollar – which has been supported by safe haven flows due to Trump trade worries – has reversed course since Monday’s jump. A set of data in line with expectations should lead to a further pullback of the US dollar against most majors. Yet the dollar’s depreciation is expected to remain limited against European currencies given the relatively more dovish outlook from the European central banks.
And indeed, the Bank of England (BoE) announced a 25bp cut yesterday, and two members wanted to cut by 50bp! When asked for Rachel Reeves’ growth plans, the BoE members said that ‘this is the right thing to do’. BUT the BoE lowered its growth forecasts while lifting its inflation forecast. That’s exactly the opposite of what you would call a successful outcome for Rachel Reeves’ policies. As a result, the pound came under a renewed selling pressure against the greenback and weakened against the euro, the FTSE 100 advanced to a fresh ATH as miners that are less exposed to the domestic growth concerns led the rally. Across the Channel, the Stoxx 600 hit a fresh ATH level reflecting strong earnings in healthcare and prospects of supportive European Central Bank (ECB) policy.
In energy, US crude extended losses toward the $70pb. There is strong dip buying near this level this morning but the Trump trade policies hammer global growth prospects and will probably support a deeper retreat in crude prices. A further fall toward the $65/68pb range now looks plausible. It’s good news for global inflation. Yet in Europe, the European nat gas prices keep climbing on the back of rapidly falling European nat gas stockpiles. The idea that the big storage sites are tempted to replenish their reserves at high prices instead of waiting for the prices to fall supports the positive trend, and raises questions among the ECB doves on whether the ECB could keep inflation under control when energy price outlook looks... somehow unideal.
US Nonfarm Payrolls Awaited Amid Productivity Weakening
In focus today
Today, the key US data release is the January Jobs Report. Due to seasonal adjustments, we expect nonfarm payrolls growth to slow down to +150k (prior: +256k), with average hourly earnings rising by 0.3% m/m SA, and unemployment rate remaining at 4.1%. Additionally, the University of Michigan's preliminary February consumer sentiment survey will be released, with recent volatility likely due to differing views between optimistic Republican and bearish Democratic respondents.
In the euro area, the ECB will publish an analysis of the neutral interest rate, which is the rate that is compatible with stable price and wage growth when the economy is at its structural level. The ECB, markets, and analysts agree that ECB policy rates should continue to decline. Previously, the ECB estimated the neutral policy rate to be between 1-5% and 2.0%, but sources suggest the new estimate might be revised upward to 1.75% and 2.25%.
In Germany, industrial production data for December will be released. It will be interesting to see if the downward trend eases like the PMIs suggested.
In Sweden, The Swedish National Debt Office (SNDO) will release the January 2025 central government payments outcome. The November and December results were significantly weaker than expected, leading to a larger than anticipated borrowing requirement of SEK 26bn since the report from last November. Svensk mäklarstatistik will publish January's house price statistics.
Economic and market news
What happened yesterday
In the US, Q4 non-farm productivity growth weakened coming in at 1.2% (cons: 1.4%, prior: 2.3%). While the data tends to be volatile, current pace is now close to the pre-pandemic trend (1%-ish). This indicates a slowdown in structural growth, with firms likely to pass wage hikes onto prices or absorb them into margins. Unit labour cost growth accelerated to 3.0% q/q AR. Weekly jobless claims landed close to expectations. These releases are not expected to have a significant short-term market impact.
In the UK, the BoE cut the Bank Rate by 25bp to 4.50%, as widely expected. The vote was split 7-2 with most members voting for a 25bp cut, while Dhingra and Mann voted for a larger 50bp cut. This marks a significant shift as Mann, previously the most hawkish member of the MPC, had consistently voted for an unchanged decision in recent meetings. See more in our Bank of England Review, 6 February.
In Sweden, the preliminary January inflation figure excluding energy was significantly higher than anticipated, reaching 2.7% y/y (prior: 2.0%, cons: 2.1%). This exceeded both our and the market's expectations, as well as the Riksbank's forecast. Detailed composition data will be published next week with the final figures and this print will be important for future policy considerations from the Riksbank.
In the euro area, December retail sales declined more than expected by 0.2% m/m (cons: -0.1%, prior: 0.1%). However, retail sales saw a 1.9% y/y increase compared to December 2023. This is significant for the growth outlook for 2025, as consumption is expected to drive GDP. The latest data on retail sales raise questions about the extent to which consumption will enhance growth in the euro area.
In the Czech Republic, as expected, CNB cut rate by 25bp to 3.75%. Earlier yesterday inflation data exceeded expectations, leading to some last-minute speculation that the CNB might refrain from cutting rates. That said, the CNB indeed opted for a cut regardless.
Equities: Global equities were higher yesterday, sending the MSCI World Index to a new all-time high. While earnings are a significant factor for the relative sector movements we see during the reporting season, we must also consider changes in risk sentiment. Yesterday, cyclicals massively outperformed defensives, with banks leading the performance tables in both the US and Europe. This was not just an earnings-driven outcome but also a result of investors getting more optimistic and vol coming lower. VIX back down at 15.5 yesterday. Regionally, the strong performance continued in Europe, with the German DAX index surpassing a 10% performance year-to-date and being higher in 15 out of the last 18 trading days. This serves as a good reminder that one should be careful in linking politics with equity market performance. In the US yesterday, the Dow was down by 0.3%, the S&P 500 rose by 0.4%, the Nasdaq increased by 0.5%, and the Russell 2000 fell by 0.4%. Asia presents a mixed bag this morning, with China leading the advances. US and European futures are lower this morning.
FI: In an uneventful trading session, European rates traded sideways, while waiting for today's NFP report. The BoE's decision to cut by 25bp with a dovish surprise did not leave a mark on other jurisdictions. Bailey later soothed the dovish surprise with more modest guidance.
FX: Today, the FX market will take direction from the US NFP. EUR/USD remains close to 1.04 and USD/JPY continues its decline below 152 ahead of the US numbers. GBP/USD dropped below 1.24 immediately after BoE's dovish cut, but the sell-off proved temporary and was soon more than fully retraced. In Sweden, the core inflation print took markets by surprise, which bolstered the already ongoing SEK rebound alongside a significant repricing of the Riksbank. EUR/SEK fell from 11.35 to 11.31.EUR/NOK fell from 11.70 to 11.64, which at the end of a volatile day, left NOK/SEK unchanged around 0.9720.
USD/JPY Daily Outlook
Daily Pivots: (S1) 150.83; (P) 151.86; (R1) 152.48; More...
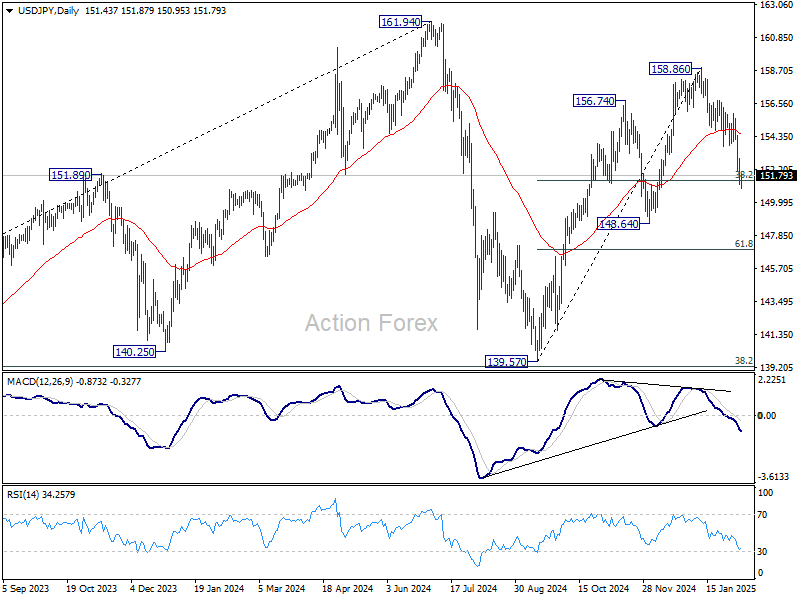
USD/JPY is now pressing 38.2% retracement of 139.57 to 158.86 at 151.49 as fall from 158.86 extended. Strong bounce from current level will keep this decline as a correction, and retain near term bullishness. Firm break of 153.70 support turned resistance will turn bias back to the upside for stronger rebound. However, sustained break of 151.49 will raise the chance of bearish reversal, and target 61.8% retracement at 146.32 next.
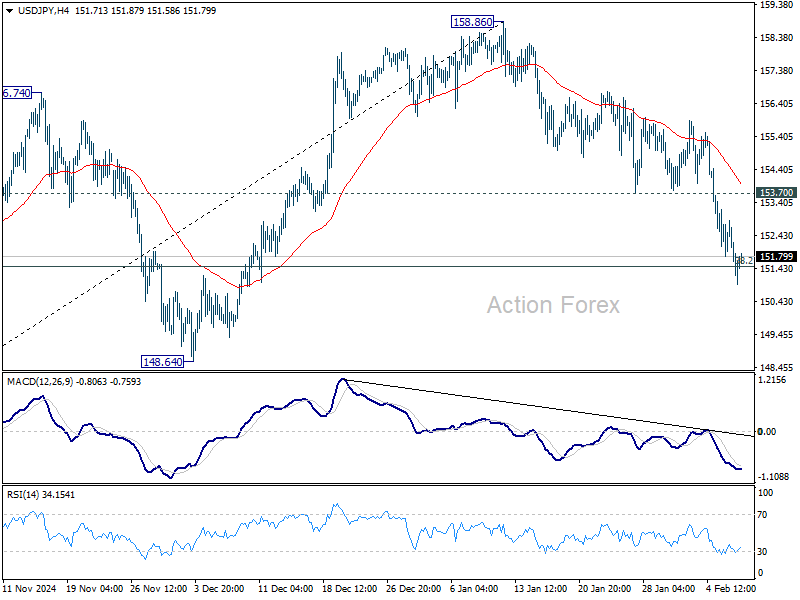
In the bigger picture, price actions from 161.94 are seen as a corrective pattern to rise from 102.58 (2021 low). The range of medium term consolidation should be set between 38.2% retracement of 102.58 to 161.94 at 139.26 and 161.94. Nevertheless, sustained break of 139.26 would open up deeper medium term decline to 61.8% retracement at 125.25.
Yen Rises Further as IMF Backs Gradual BoJ Tightening; Dollar Awaits NFP Impact
The forex market was relatively subdued during Asian session, with one clear exception: Japanese Yen continues to outperform. Fresh data from Japan showed a 2.7% yoy increase in household spending, not only marking the first rise in five months, but also the fastest pace since August 2022. Paired with this week’s solid wage growth figures, the numbers suggest real wage gains are driving consumption—a development that could reinforce BoJ's push toward gradual policy normalization.
Additionally, IMF offered further support for Yen by endorsing a gradual rise in BoJ rates to a neutral range of 1-2% by the end of 2027. Although this view appears somewhat conservative compared to hawkish BoJ board member Naoki Tamura’s call for a 1% rate by the second half of fiscal 2025, the gap isn’t significant. If Japan’s inflation and wage growth hold up, it’s feasible that interest rates could reach the midpoint of 1.5% within a few quarters from Tamura's target.
Attention now shifts to the US non-farm payroll report, with prospects of upside surprise. Dallas Fed President Lorie Logan raised an interesting argument that Fed may not ease policy further unless the labor market noticeably softens, even if inflation trends lower. A strong NFP reading would bolster expectations for an extended Fed pause. However, it may not be enough to spark an upside breakout in the Dollar from recent ranges, given ongoing uncertainties tied to US trade policies.
Overall for the week so far, Dollar is currently the worst performer, followed by Euro, and then Sterling. Yen is the best, followed by Loonie, and then Aussie. Swiss Franc and Kiwi are positioning in the middle.
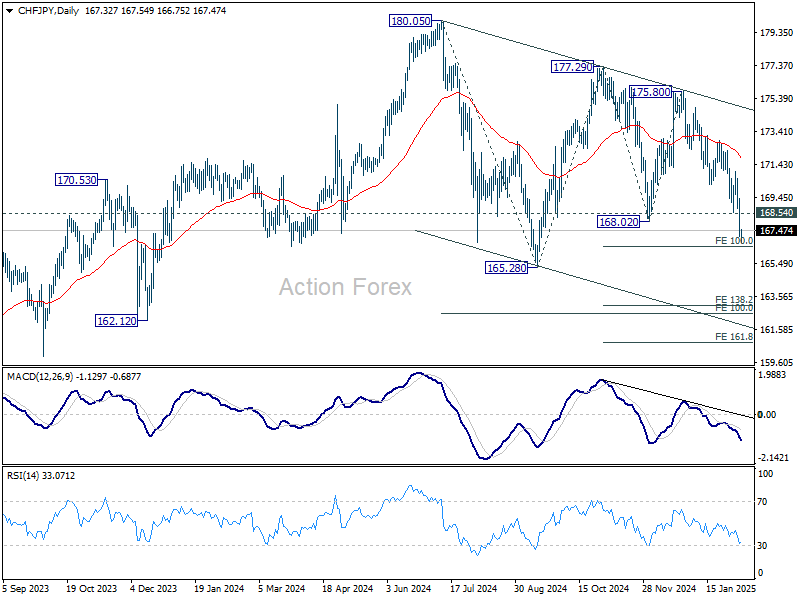
Technically, CHF/JPY's break of 168.02 support confirms resumption of fall from 177.29. This decline is seen as the third leg of the corrective pattern from 180.05 high. Further fall is expected as long as 168.54 support turned resistance holds. Firm break of 100% projection of 177.29 to 168.02 from 175.80 at 166.53 should bring deeper fall through 165.28 support to 138.2% projection at 162.98.
In Asia, at the time of writing, Nikkei is down -0.72%. Hong Kong HSI is up 1.05%. China Shanghai SSE is up 1.02%. Singapore Strait Times is up 0.83%. Japan 10-year JGB yield is up 0.0339 at 1.301. Overnght, DOW fell -0.28%. S&P 500 rose 0.36%. NASDAQ rose 0.51%. 10-year yeld rose 0.018 to 4.440.
NFP may beat expectations, but unlikely to trigger Dollar range breakout
Today’s US Non-Farm Payroll report is the focal point for market participants, with consensus estimates pointing to 169k new jobs in January and an unemployment rate holding steady at 4.1%. Average hourly earnings growth is expected at 0.3% month-over-month, maintaining the robust wage gains of recent months.
There are indications the data could surprise to the upside. Latest ISM surveys showed employment components improving, with manufacturing’s gauge jumping from 45.4 back into expansion at 50.3, and services employment rising to 52.3 from 51.3. ADP private payrolls number also showed a solid 183k increase, little changed from December’s 176k. Meanwhile, initial jobless claims remain near historical lows, with the four-week moving average inching up only slightly from 213k to 217k.
If today’s jobs report beats expectations, the case for Fed to maintain its pause on easing for longer would strengthen. However, persistent uncertainties—especially US trade policies—may limit the Dollar’s ability to rally significantly. While a strong labor market may keep rate cuts at bay, investors will weigh other geopolitical and economic factors before pushing the greenback through key near term resistance levels.
Technically, Dollar Index is currently extending the consolidation pattern from 110.17 short term top. In case of deeper pull back, downside should be contained by 38.2% retracement of 110.15 to 110.17 at 106.34 to bring rebound. On the upside, firm break of 110.17 is needed to confirm resumption of recent up trend. Otherwise, outlook would remains neutral for more sideway trading.
Fed’s Logan sees rates on hold “for quite some time” even if inflation drops
Dallas Fed President Lorie Logan suggested at a BIS conference overnight that interest rates may remain on hold for "quite some time," even if inflation continues to move closer to the 2% target. She emphasized that a decline in inflation alone would not be a sufficient trigger for policy easing, as long as labor market conditions remain strong.
She argued that such a scenario would "strongly suggest that" interest rate is already pretty close to neutral, "without much near-term room for further cuts".
Instead, Logan highlighted that signs of a weakening labor market or a slowdown in demand would be more relevant factors in determining when easing should begin.
BoC’s Macklem warns tariff threats already weighing on confidence
Speaking at a conference in Mexico City, BoC Governor Tiff Macklem raised concerns over the economic uncertainty stemming from U.S. President Donald Trump’s tariff threats. He noted that "threats of new tariffs are already affecting business and household confidence, particularly in Canada and Mexico."
"The longer this uncertainty persists, the more it will weigh on economic activity in our countries," he warned.
Macklem stressed that central banks face a challenging task in managing the economic fallout. He explained that policymakers cannot counteract both "weaker output" and "higher inflation" simultaneously.
The challenge will be to assess the downward pressure on inflation from reduced economic activity while balancing it against the upward pressure from higher input costs and supply chain disruptions caused by tariffs.
IMF backs BoJ’s gradual rate hikes, sees policy rate moving toward neutral by 2027
Nada Choueiri, deputy director of IMF’s Asia-Pacific Department and mission chief for Japan, stated that IMF remains “supportive” of BoJ’s current monetary policy course. She emphasized that rate hikes should be implemented in a gradual and flexible manner to ensure that domestic demand continues to recover.
Choueiri projected that BoJ’s policy rate could rise “beyond 0.5%” by the end of this year, with a longer-term path toward the “neutral level” by the end of 2027.
IMF estimates Japan’s neutral rate to be within a band of 1% to 2%, with a midpoint of 1.5%.
Also, IMF maintains an optimistic outlook for Japan’s economy, forecasting 1.1% GDP growth in 2025, supported by increasing wages and stronger consumer spending.
Given these projections, IMF expects BoJ to continue its tightening cycle in a controlled manner.
USD/JPY Daily Outlook
Daily Pivots: (S1) 150.83; (P) 151.86; (R1) 152.48; More...
USD/JPY is now pressing 38.2% retracement of 139.57 to 158.86 at 151.49 as fall from 158.86 extended. Strong bounce from current level will keep this decline as a correction, and retain near term bullishness. Firm break of 153.70 support turned resistance will turn bias back to the upside for stronger rebound. However, sustained break of 151.49 will raise the chance of bearish reversal, and target 61.8% retracement at 146.32 next.
In the bigger picture, price actions from 161.94 are seen as a corrective pattern to rise from 102.58 (2021 low). The range of medium term consolidation should be set between 38.2% retracement of 102.58 to 161.94 at 139.26 and 161.94. Nevertheless, sustained break of 139.26 would open up deeper medium term decline to 61.8% retracement at 125.25.
NFP may beat expectations, but unlikely to trigger Dollar range breakout
Today’s US Non-Farm Payroll report is the focal point for market participants, with consensus estimates pointing to 169k new jobs in January and an unemployment rate holding steady at 4.1%. Average hourly earnings growth is expected at 0.3% month-over-month, maintaining the robust wage gains of recent months.
There are indications the data could surprise to the upside. Latest ISM surveys showed employment components improving, with manufacturing’s gauge jumping from 45.4 back into expansion at 50.3, and services employment rising to 52.3 from 51.3. ADP private payrolls number also showed a solid 183k increase, little changed from December’s 176k. Meanwhile, initial jobless claims remain near historical lows, with the four-week moving average inching up only slightly from 213k to 217k.
If today’s jobs report beats expectations, the case for Fed to maintain its pause on easing for longer would strengthen. However, persistent uncertainties—especially US trade policies—may limit the Dollar’s ability to rally significantly. While a strong labor market may keep rate cuts at bay, investors will weigh other geopolitical and economic factors before pushing the greenback through key near term resistance levels.
Technically, Dollar Index is currently extending the consolidation pattern from 110.17 short term top. In case of deeper pull back, downside should be contained by 38.2% retracement of 110.15 to 110.17 at 106.34 to bring rebound. On the upside, firm break of 110.17 is needed to confirm resumption of recent up trend. Otherwise, outlook would remains neutral for more sideway trading.