
Sample Category Title
AUDJPY Technical Analysis
The USDJPY pair is edging closer to 152.00 in Tuesday’s European session but remains within Monday’s price range, indicating a sideways movement. Traders are holding back as they wait for Federal Reserve (Fed) Chair Jerome Powell’s testimony before Congress at 15:00 GMT, hoping for insights into the Fed’s future policies.
Investors want to know how long the Fed will keep interest rates between 4.25%-4.50%. Powell is unlikely to give a clear timeline on when the Fed might start cutting rates again, as he previously stated that rate changes would depend on inflation cooling or the job market weakening.
Market watchers also want to hear Powell’s thoughts on the potential impact of Trump’s 25% tariffs on steel and aluminum imports, which take effect on 12th Mar. Many believe these tariffs could push inflation higher in the US.
Meanwhile, the Japanese Yen’s strong rally in January has stalled. Investors had been buying the Yen, expecting that the Bank of Japan (BoJ) would raise interest rates to narrow the gap with other central banks. BoJ officials have hinted at another possible rate hike if the economy and inflation continue to meet their forecasts.
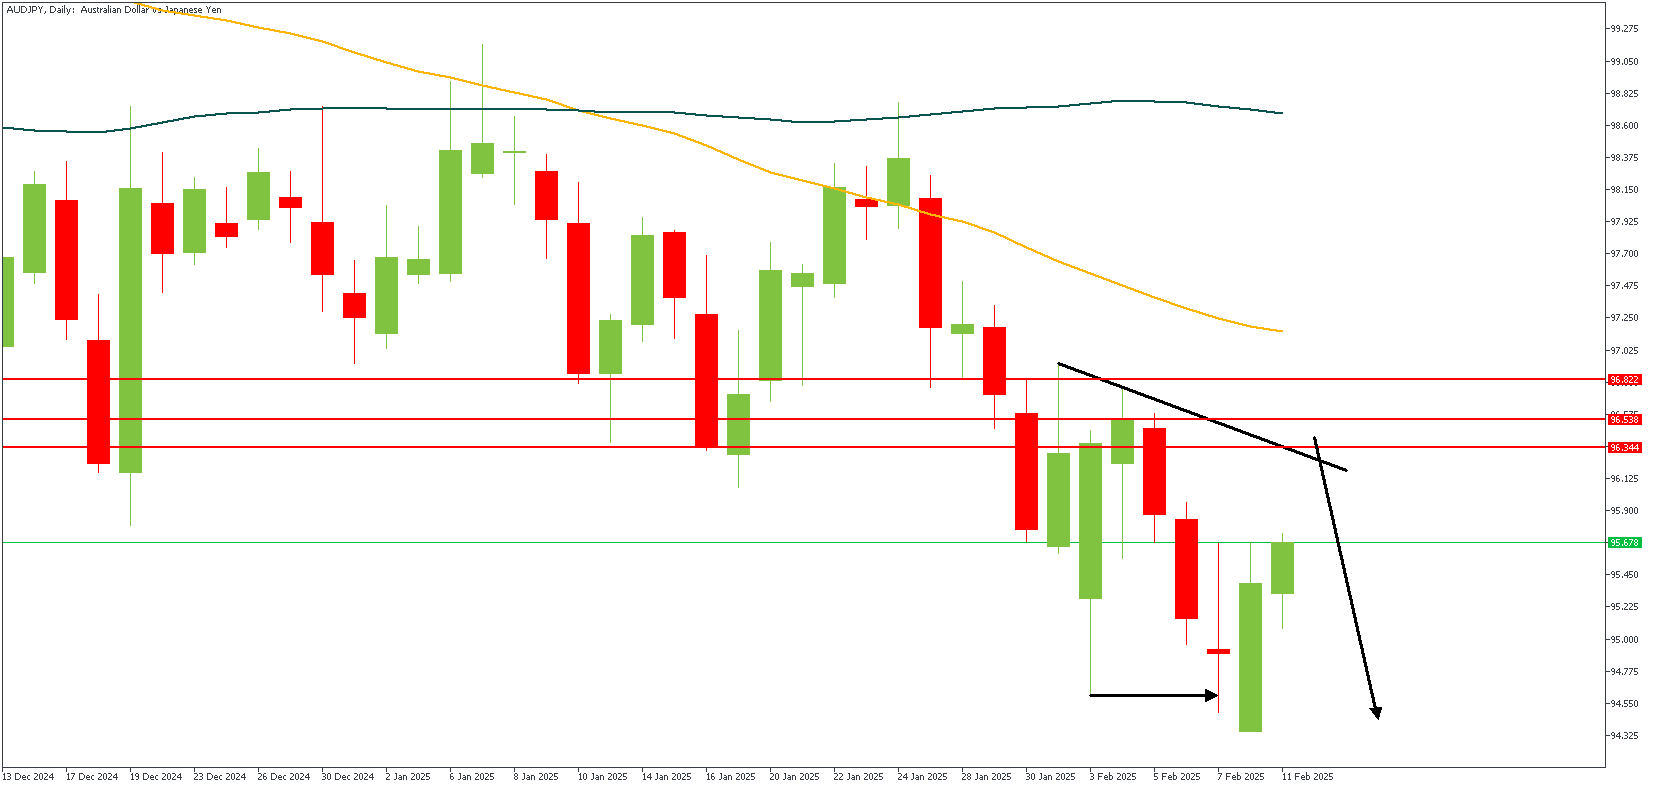
AUDJPY – D1 Timeframe
The price action on the daily timeframe chart of AUDJPY is approaching the resistance trendline, and the moving averages are currently in a bearish array. The recent low created a structure break, indicating the current trend is bearish. The bearish sentiment is the safer option, considering the additional confluence from the pivot zone.
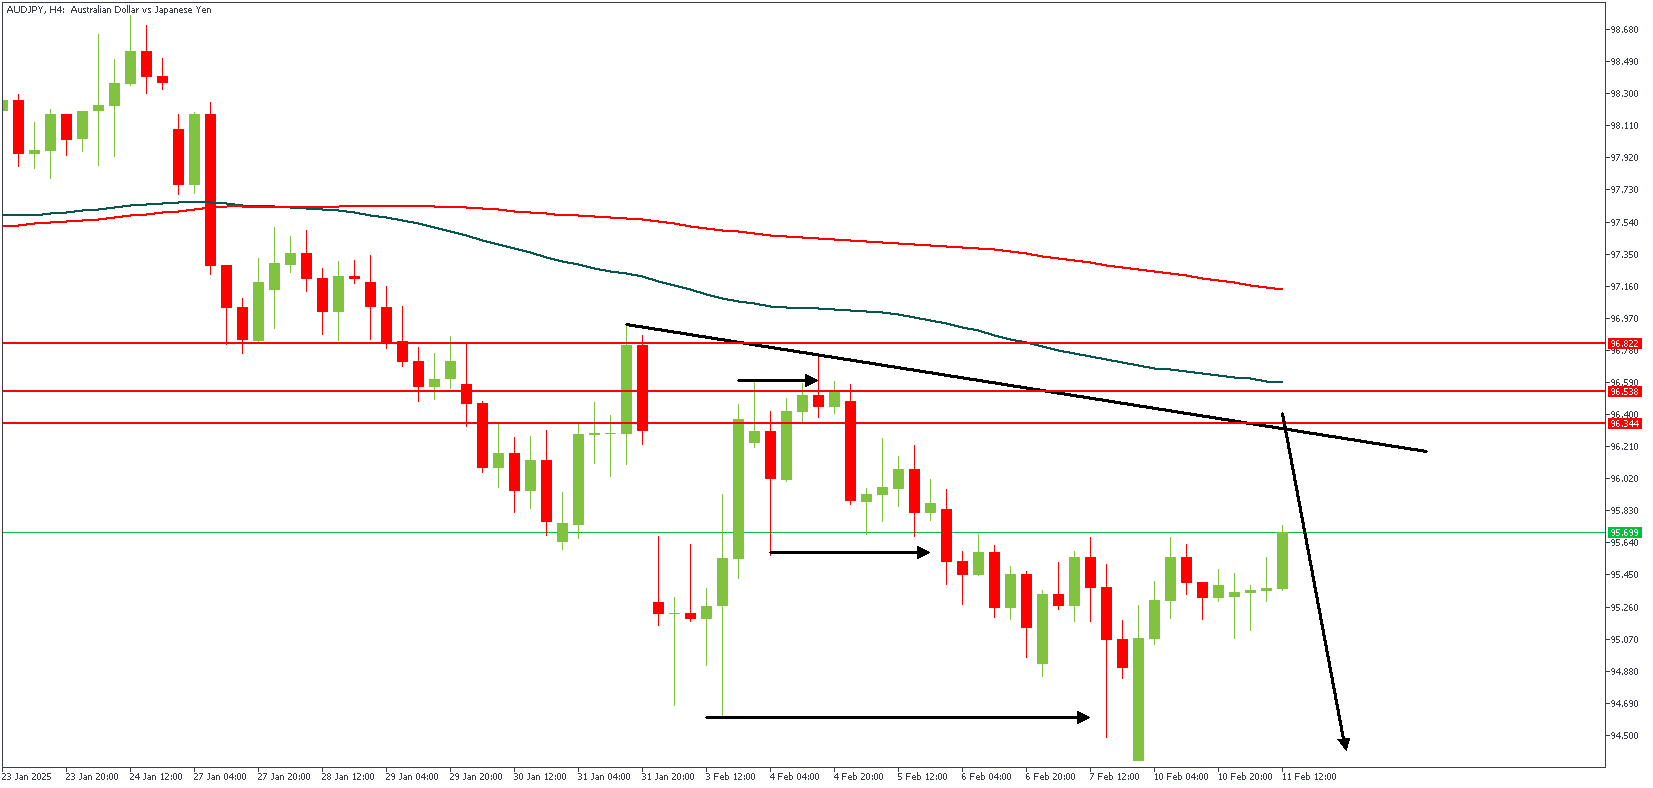
AUDJPY – H4 Timeframe
The 4-hour timeframe chart of AUDJPY breaks down the daily timeframe sentiment to reveal the supply zone of the SBR (sweep-break-retest) pattern buried within the daily timeframe pivot region. Further confirming the bearish sentiment.
Analyst’s Expectations:
- Direction: Bearish
- Target: 94.5
- Invalidation: 97.206
AUDCHF Technical Analysis
The AUDUSD pair is holding steady, with key support at 0.6087—its lowest level this year. If it drops below this, it could fall further to 0.6000, while resistance is around 0.6330 and 0.6549. The Relative Strength Index (RSI) suggests some buying interest, but the Average Directional Index (ADX) signals that the current trend may weaken. The Australian Dollar has gained ground as the US Dollar weakens, despite ongoing trade tensions between the US and China, which could impact Australia’s exports. For further economic clues, traders will watch Australia’s upcoming home loan data (12th Feb.) and inflation expectations (14th Feb.).
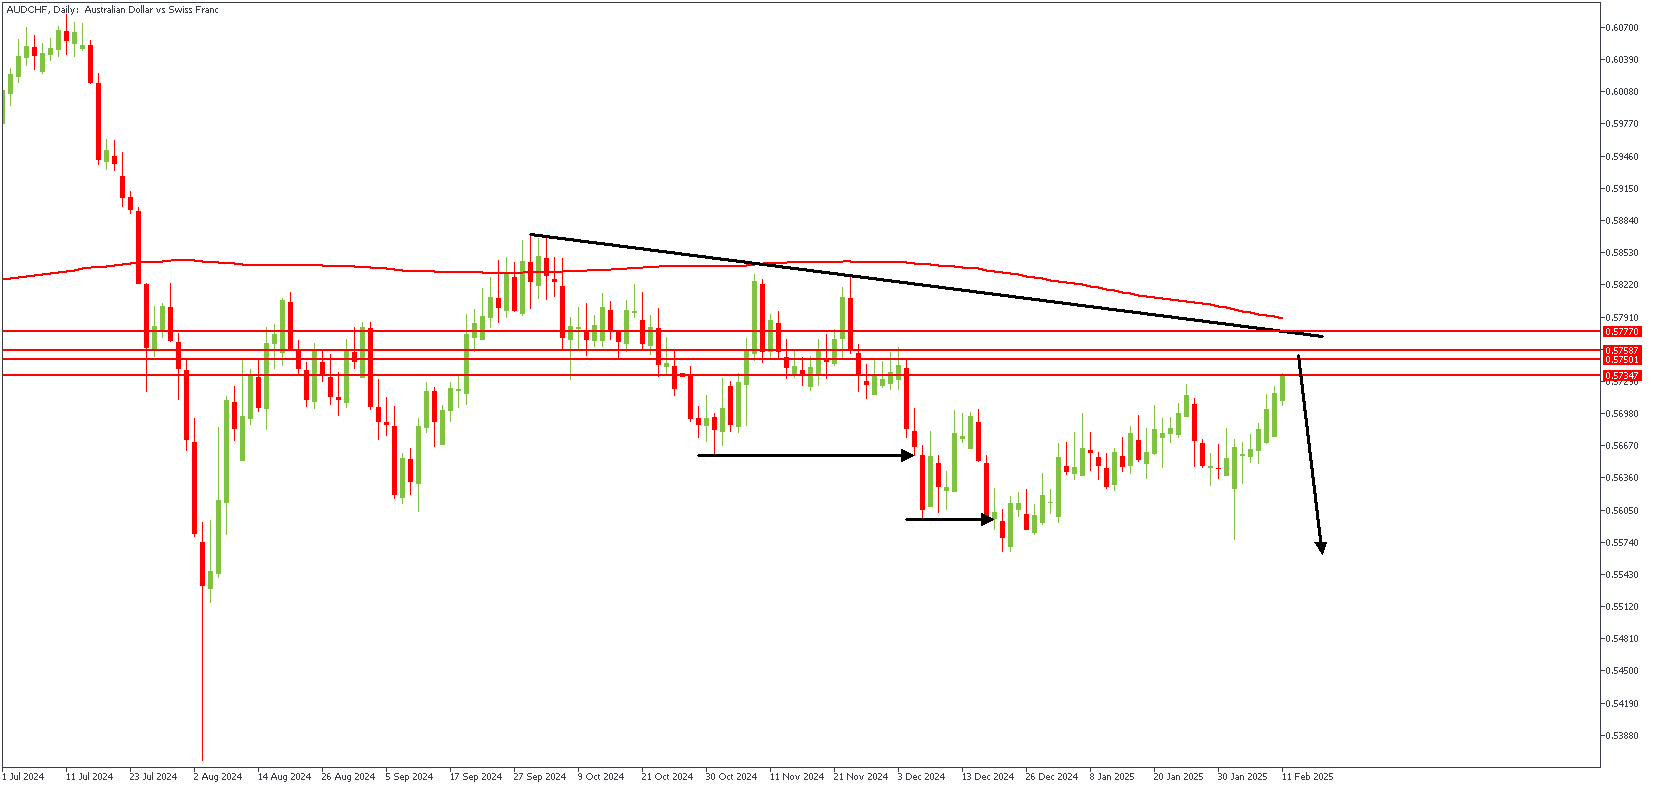
AUDCHF – D1 Timeframe
On the daily timeframe chart of AUDCHF, we see price currently approaching the trendline resistance and the pivot region. Interestingly, the supply region is nearby, thus increasing the likelihood of a bearish reaction from the highlighted zone.
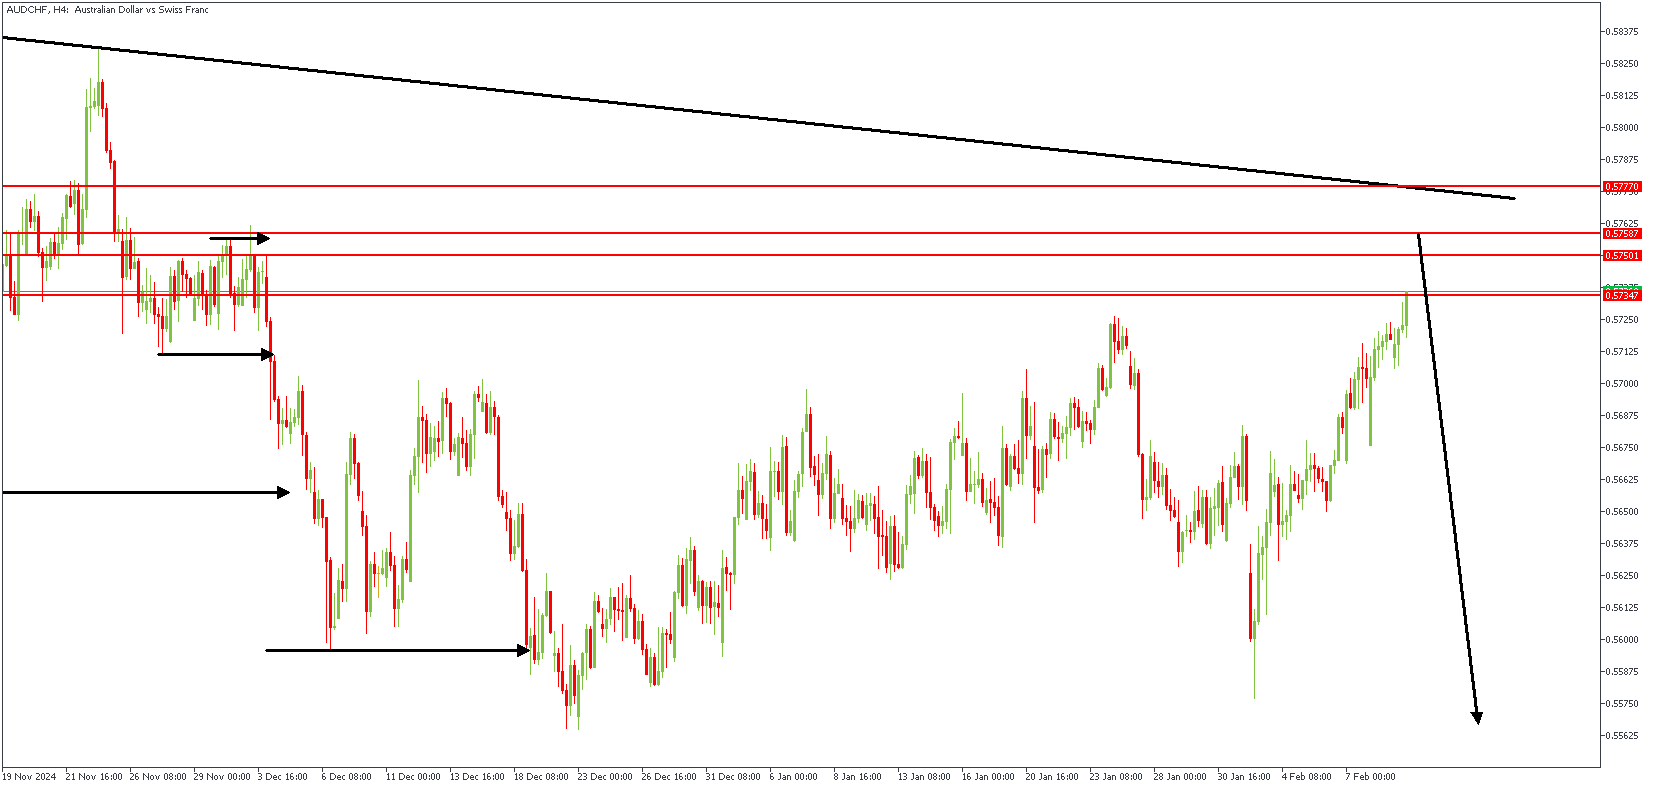
AUDCHF – H4 Timeframe
The 4-hour timeframe chart shows the supply zone more evident, with expectations of a sweep of liquidity and a Fair Value Gap entry. With these confluences aligning with the daily timeframe sentiment, there’s sufficient argument for a bearish outcome.
Analyst’s Expectations:
- Direction: Bearish
- Target: 0.55875
- Invalidation: 0.57841
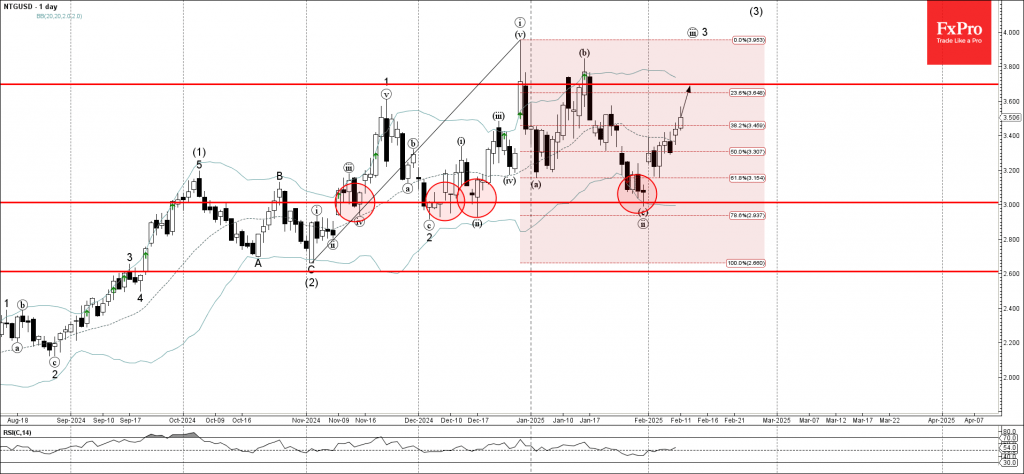
Natural Gas Wave Analysis
- Natural gas reversed from the support area
- Likely to rise to the resistance level 3.67
Natural gas continues to rise strongly inside the short-term upward impulse wave iii, which started earlier from the support area located between the round support level 3.0000 (which has been steadily reversing the price from November) and the lower daily Bollinger Band.
The upward reversal from this support area created the daily upward gap – which signals the strength of this support area.
Given the clear daily uptrend, Natural gas can be expected to rise to the next resistance level 3.67 (which has been reversing the price from December).
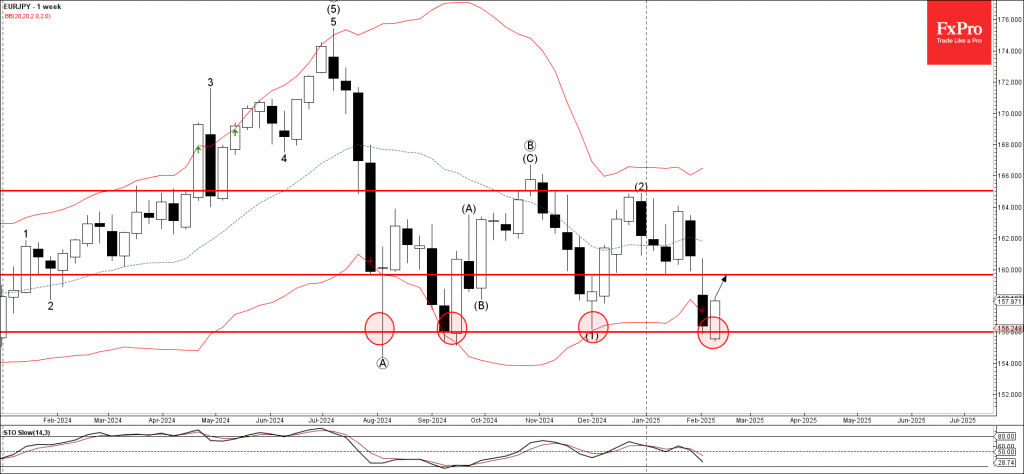
EURJPY Wave Analysis
- EURJPY reversed from the support area
- Likely to rise to the resistance level 159.65
EURJPY currency pair recently reversed up from the support area located between the key support level 156.000 (which has been steadily reversing the price from August of 2024 as can be seen below) and the lower weekly Bollinger Band.
The upward reversal from the support area stopped the previous weekly downward impulse wave (3) from last year.
Given the strength of the support level 156.000, EURJPY currency pair can be expected to rise to the next resistance level 159.65 (the former weekly low from January).
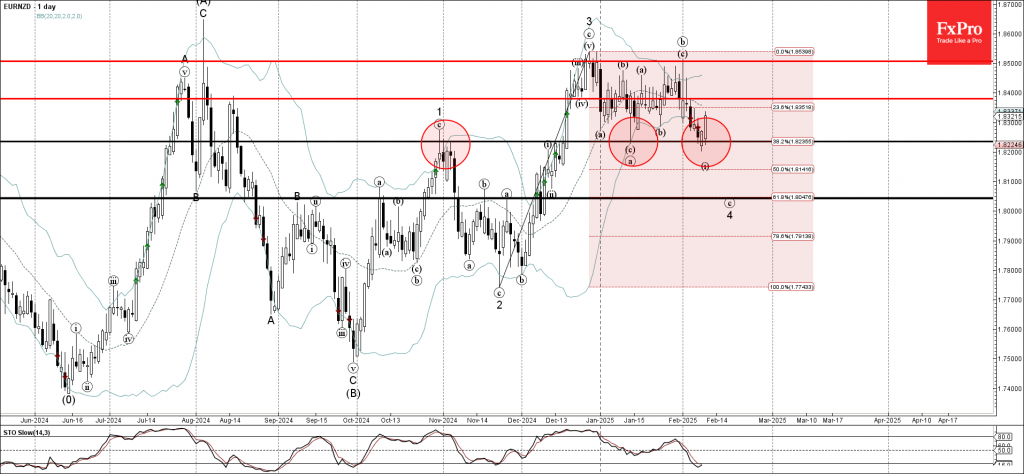
EURNZD Wave Analysis
- EURNZD currency pair reversed from the support area
- Likely to rise to the resistance 1.8380
EURNZD currency pair recently reversed up from the support area located between the pivotal support level 1.8235 (former monthly low from January), lower daily Bollinger Band and the 38.2% Fibonacci correction of the upward impulse from November
The upward reversal from this support area created the daily Japanese candlesticks reversal pattern Morning Star.
Given the multi-month uptrend and the oversold daily Stochastic, EURNZD currency pair can be expected to rise to the next resistance 1.8380.
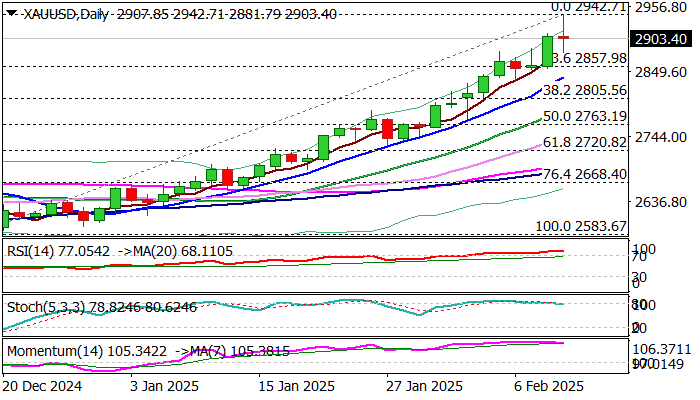
Gold Price Eases from New Record High, Supportive Fundamentals Suggest Dips Likely Limited
Gold price dipped on Tuesday on partial profit taking, as traders reacted on overbought daily studies, against very supportive fundamentals.
The price spiked to new record high ($2942) earlier today as the latest set of tariffs on steel and aluminium imports in the US raised concerns of escalation of trade war, which could cause a massive negative impact on global economy.
On the other hand, today’s comments from Fed Chair Powell that the central bank is not in hurry to cut interest rates, as the economy remains in good shape and current monetary policy is adequate to stand further economic growth and potential rise in inflation may provide headwinds to metal’s price.
Wednesday’s release of US January CPI will be closely watched.
Today’s dip was so far limited with daily action shaped in Doji candle which signals indecision and suggests that more evidence will be needed to have clearer near term direction signal.
This also warns traders of extra caution while trading in this zone.
Initial support lays at $2880 zone (session low / 5DMA) followed by ascending daily Tenkan-sen ($2850) and $2805 (Fibo 38.2% of $2582/$2942 upleg).
On the flip side, projections at $2946/83 mark next targets ahead of key $3000 barriers.
Res: 2942; 2946; 2983; 3000
Sup: 2880; 2850; 2834; 2805
Sunset Market Commentary
Markets
Bear steepening of yield curves is the main – and only -expression of the new step-up in trade threats. US President Trump is preparing universal (except for Australia) 25% tariffs on steel and aluminum imports by March 12. EC President von der Leyen already responded saying that “unjustified tariffs on the EU will not go unanswered”. They earmarked a list of €4.8bn of US imports with trade ministers tomorrow meeting to discuss potential next steps. Von der Leyen will tomorrow also meet US vice-president Vance in Paris to discuss the issue. EU swap rates add 3.8 bps (2-yr) to 6.8 bps (30-yr) today with US yields adding 1.5 bps (2-yr) to 4.6 bps (30-yr). Markets clearly fear the inflationary impact which might mean restrictive monetary policies for longer. The trade narrative had little impact on EUR/USD (1.0320) with European stock markets currently even looking at 0.5% gains after an hesitant start. The eco calendar was empty apart from a larger-than-expected setback in NFIB small business optimism for the month of January (102.8 from a 6-yr high of 105.1 vs 104.7 expected). Details showed a strong rise in the uncertainty indicator suggesting investments could slow. The title of Cleveland Fed Hammock’s speech – “Show me the low inflation” – spoke for itself while markets counted down to US Fed Chair Powell’s testimony before Congress. The Fed chair reiterated that there’s no hurry to adjust policy rates. Conditions in the labour market are broadly balanced with the Fed being attentive to risks on both side of its mandate. The comments broadly reflected the mood set out at the January FOMC meeting, with markets shrugging them off.
Bank of England Mann elaborated further on her call to cut the central bank’s policy rate by 50 bps instead of 25 bps last week. The move came as a surprise as Mann dissented back in November in favour of stable rates instead of a 25 bps rate cut. Mann thinks that the downturn in the jobs market will make the inflation hump this year short-lived. She wanted to send a strong signal about the BoE’s intentions, but that doesn’t mean that she sees a need for fresh cuts in the immediate future: “a larger move is a superior communication device” but interest rates are still expected to settle at a higher level as structural impediments keep inflation at 2%. UK money markets only attach a 25% probability to a follow-up move in March which we don’t think will happen. Sterling is slightly stronger against the euro (EUR/GBP 0.8325) but the intraday move isn’t related to the BoE comments.
News & Views
Hungarian prices in January rose a consensus-beating 1.5% m/m. The 5.5% y/y reading was the highest in over a year. They also represented a significant quickening from December’s 0.5% and 4.6% thanks to food (1.9% m/m), services prices (2.2%), energy (1.7%) as well as alcoholic beverages and tobacco (1.5%), the Hungarian Central Statistical Office said. The flavour of the core gauges constructed by the central bank (MNB) were similar with all three of them varying between 5.4% and 5.6%, up from the 4.7%-5.4% range in December. The MNB targets an inflation rate of 3% and allows a 1 ppt deviation on either side. It held within the upper bound of the tolerance range for most of 2024 before breaking out again since December. The Hungarian forint has had a good run over the last couple of weeks and is extending gains today to EUR/HUF 403.8. But regardless of the decent HUF performance, which is a key variable watched by the MNB, today’s numbers clearly question the remaining (if any) room to cut rates further from the current 6.5%. Hungarian swap rates surge up to 20 bps at the front end of the curve. FRA pricing no longer suggest any rate cut over the next 12 months.
Poland’s Climate Minister Hennig-Kloska said the government may need to extend the power price cap again after it expires in Q3 of this year. Electricity prices are currently around PLN 600/MWh and Hennig-Kloska said that the motions to be prepared in April by utility companies for the new tariffs probably won’t go as low as the current price cap of PLN 500/MWh. “Intervention” of freezing prices will thus still be needed, she said. The price cap is one of the key reasons why the Polish central bank (NBP) is refraining from cutting rates, citing the upward impact on inflation when the cap gets lifted eventually. By extending the cap, inflation remains (artificially) lower but from the central bank’s point of view it’s probably just kicking the can further down the road. The Polish zloty remains very well bid, banking on the hawkish monetary policy stance. EUR/PLN is testing the 2025 low around 4.175, in turn the strongest PLN level since 2018.
Powell reaffirms Fed’s patience, signals no urgency for rate cuts
Fed Chair Jerome Powell reiterated in the Semiannual Monetary Policy Report to Congress that Fed is not in a hurry to cut interest rates.
A prolonged policy hold remains on the table if inflation does not continue its downward trend. However, he also acknowledged that if the labor market weakens or disinflation accelerates, Fed could respond with further easing.
Powell noted that if inflation fails to make sustained progress toward the 2% target, Fed can "maintain policy restraint for longer." On the flip side, if the labor market weakens unexpectedly or inflation declines more rapidly than forecast, Fed "can ease policy accordingly."
Fed’s Hammack supports prolonged policy pause
Cleveland Fed President Beth Hammack reinforced the case for a prolonged pause in rate cuts, emphasizing that it will likely be "appropriate to hold the funds rate steady for some time."
She highlighted the need for a patient approach, allowing Fed to assess the labor market, inflation trends, and overall economic performance under the current policy stance.
Hammack noted that inflation risks remain "skewed to the upside," with possibility of delaying the return to 2% target. The "recent history" of elevated inflation adds complexity to the outlook, raising concerns about entrenched pricing pressures.
She also pointed to "considerable uncertainty" surrounding government policies, particularly with regard to the "ultimate effects" of recent tariff measures.