
Sample Category Title
USD/JPY Mid-Day Outlook
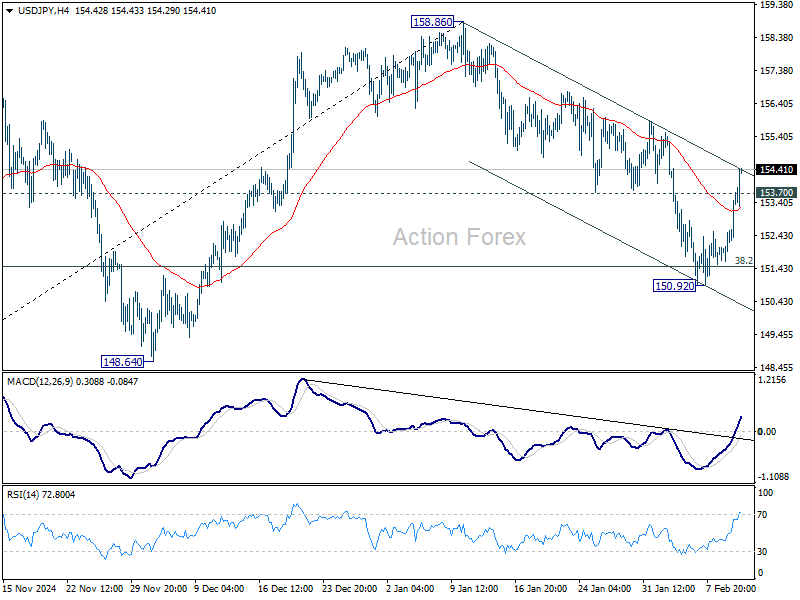
Daily Pivots: (S1) 151.90; (P) 152.25; (R1) 152.86; More...
USD/JPY's strong break of 153.70 support turned resistance should confirm that corrective pull back from 158.86 has completed at 150.92. That came after drawing support from 38.2% retracement of 139.57 to 158.86 at 151.49. Intraday bias is back on the upside for retesting 158.86. Firm break there will resume whole rally from 139.57 to retest 161.94 high. For now, risk will stay on the upside as long as 150.92 support holds, in case of retreat.
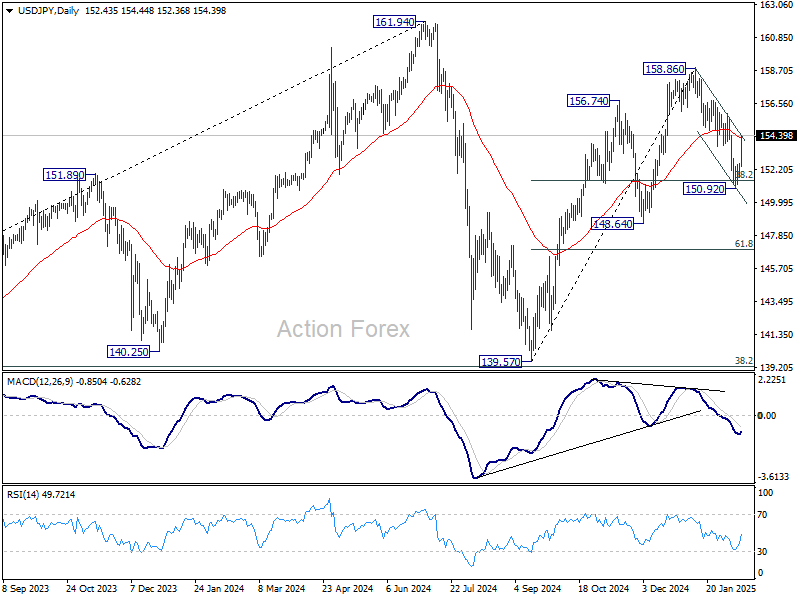
In the bigger picture, price actions from 161.94 are seen as a corrective pattern to rise from 102.58 (2021 low). In case of another fall, strong support should be seen from 38.2% retracement of 102.58 to 161.94 at 139.26 to bring rebound. However, sustained break of 139.26 would open up deeper medium term decline to 61.8% retracement at 125.25.
Dollar Surges as Hot Inflation Data Solidifies Prolonged Fed Pause, Yields Surge
Dollar rallied sharply in early US trading after inflation data came in hotter than expected, reinforcing expectations that Fed will maintain its restrictive policy stance for longer than previously anticipated. 10-year Treasury yield surged past 4.6%, extending its strong rebound from earlier in the week. US equity futures plunged, with DOW futures down around -1% as traders reassessed the likelihood of near-term rate cuts. The report shattered market hopes that the Fed might move forward with another rate cut by mid-year, instead strengthening the case for a prolonged pause.
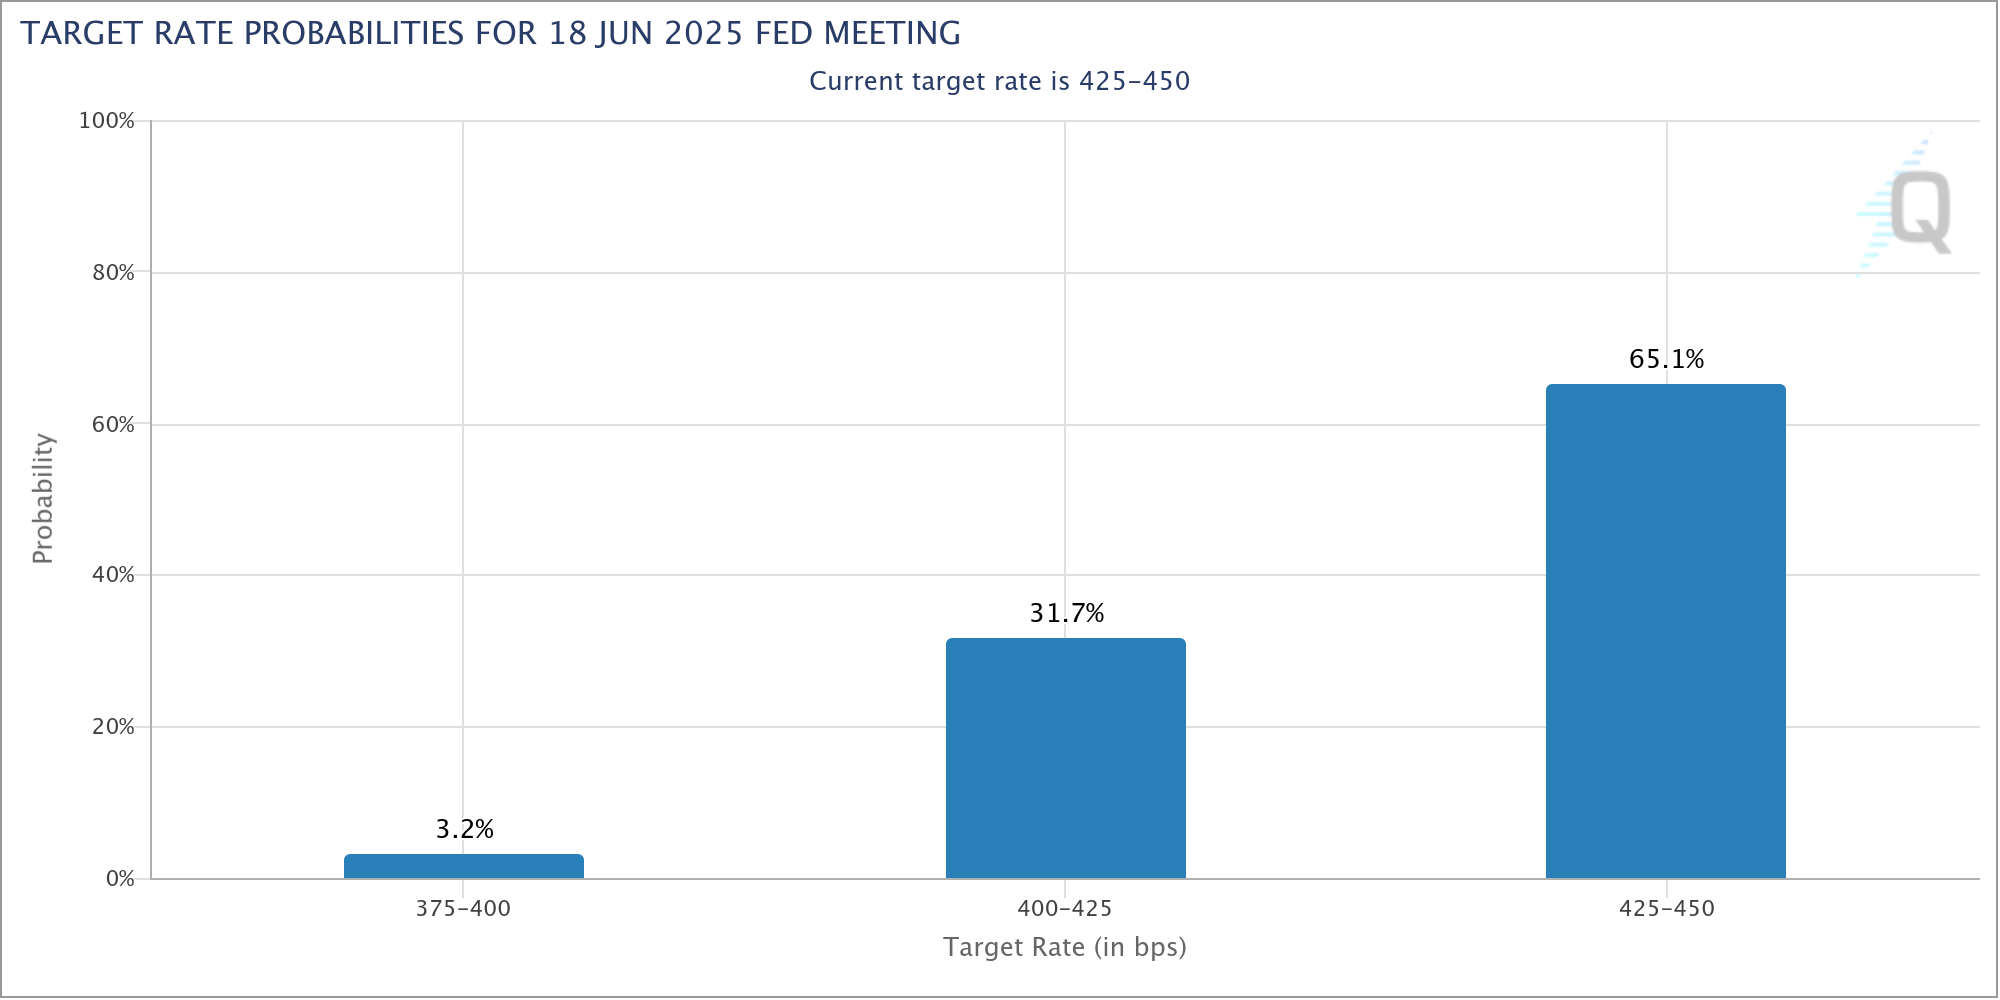
Both headline and core CPI surpassed forecasts, rising more than expected on both a monthly and annual basis. This marks a clear warning sign that inflation pressures remain persistent. Fed fund futures now imply a nearly 65% probability that Fed will keep rates unchanged through June, a notable increase from 50% just a day earlier. While it is still premature, it couldn't be totally ruled out that another rate hike could be back on the table if inflationary pressures intensifies further.
US trade policy is another key wildcard for future price pressures. President Donald Trump’s tariff war is still in its early stages. Reports indicated that his administration is finalizing details for reciprocal tariffs. Trade analysts suggest that structuring these tariffs might be more challenging than anticipated, potentially delaying their rollout. However, if implemented aggressively, these tariffs could drive further price increases, creating additional inflationary risks that Fed would have to contend with.
The currency markets reacted decisively, with Dollar emerging as the strongest performer for the day, followed by Swiss Franc and Euro. Yen, however, is the worst performer, struggling under the weight of rising US yields. Australian and New Zealand Dollars also faced significant pressure, caught in the wave of risk aversion triggered by inflation fears and concerns over global trade tensions. Meanwhile, Canadian Dollar and British Pound traded with a more neutral stance, positioning in the middle of the performance spectrum.
In Europe, at the time of writing, FTSE flat. DAX is up 0.06%. CAC is down -0.18%. UK 10-year yield is up 0.071 at 4.583. Germany 10-year yield is up 0.043 at 2.477. Earlier in Asia, Nikkei rose 0.42%. Hong Kong HSI rose 2.64%. China Shanghai SSE rose 0.85%. Singapore Strait Times rose 0.36%. Japan 10-year JGB yield rose 0.0406 to 1.347.
US CPI rises to 3% in Jan, core CPI up to 3.3%
US headline CPI rose 0.5% mom in January, exceeding expectations of 0.3% mom and marking the fastest monthly pace since August 2023. Core CPI, which strips out food and energy prices, also outpaced forecasts (0.3% mom) at 0.4% mom, the highest since March 2024.
Key inflation drivers for the month included a 0.4% mom increase in shelter costs, a 1.1% mom jump in energy prices, and a 0.4% mom rise in food prices.
On an annual basis, CPI accelerated from 2.9% yoy to 3.0% yoy, beating expectations of 2.9% yoy and extending its upward streak for the fourth consecutive month.
Core CPI also climbed, rising from 3.2% yoy to 3.3% yoy, surpassing the projected 3.1% yoy. Energy prices rose 1.0% yoy, while food costs were up 2.5% yoy.
ECB’s Villeroy warns of negative impact from US tariffs
French ECB Governing Council member Francois Villeroy de Galhau cautioned that US President Donald Trump’s tariffs will "very likely" have a "negative effect" on the economy.
Speaking on France Culture radio, Villeroy criticized "protectionism is a seductive short-term policy, but in the long term it is a losing strategy."
Despite trade tensions, Villeroy maintained an optimistic view on France’s economic resilience. He reaffirmed that the country is likely to avoid a recession in 2025.
Bank of France indicated on Tuesday that French GDP is on track to expand by 0.1% to 0.2% in the first quarter.
ECB’s Holzmann: Inflation risks rising, rate cuts require patience
Austrian ECB Governing Council member Robert Holzmann emphasized caution regarding rate cuts, citing renewed inflation risks from tariffs.
Speaking to CNBC, Holzmann noted that while inflation pressures had previously "somewhat dissipated," the latest developments, particularly increased trade frictions, pose fresh threats to price stability. As a result, policymakers must be careful in their approach on policy easing.
Holzmann explained that while increased trade barriers may reduce economic growth, they also contribute to inflationary pressures. "We will have to be more patient," he stated.
Addressing speculation about a larger 50 basis point rate cut, Holzmann dismissed the idea, arguing that ECB’s mandate is to manage inflation, not stimulate growth.
"Using the interest rate in order to initiate a higher growth is not the way how we should work," he stated.
USD/JPY Mid-Day Outlook
Daily Pivots: (S1) 151.90; (P) 152.25; (R1) 152.86; More...
USD/JPY's strong break of 153.70 support turned resistance should confirm that corrective pull back from 158.86 has completed at 150.92. That came after drawing support from 38.2% retracement of 139.57 to 158.86 at 151.49. Intraday bias is back on the upside for retesting 158.86. Firm break there will resume whole rally from 139.57 to retest 161.94 high. For now, risk will stay on the upside as long as 150.92 support holds, in case of retreat.
In the bigger picture, price actions from 161.94 are seen as a corrective pattern to rise from 102.58 (2021 low). In case of another fall, strong support should be seen from 38.2% retracement of 102.58 to 161.94 at 139.26 to bring rebound. However, sustained break of 139.26 would open up deeper medium term decline to 61.8% retracement at 125.25.
US CPI rises to 3% in Jan, core CPI up to 3.3%
US headline CPI rose 0.5% mom in January, exceeding expectations of 0.3% mom and marking the fastest monthly pace since August 2023. Core CPI, which strips out food and energy prices, also outpaced forecasts (0.3% mom) at 0.4% mom, the highest since March 2024.
Key inflation drivers for the month included a 0.4% mom increase in shelter costs, a 1.1% mom jump in energy prices, and a 0.4% mom rise in food prices.
On an annual basis, CPI accelerated from 2.9% yoy to 3.0% yoy, beating expectations of 2.9% yoy and extending its upward streak for the fourth consecutive month.
Core CPI also climbed, rising from 3.2% yoy to 3.3% yoy, surpassing the projected 3.1% yoy. Energy prices rose 1.0% yoy, while food costs were up 2.5% yoy.
ECB’s Holzmann: Inflation risks rising, rate cuts require patience
Austrian ECB Governing Council member Robert Holzmann emphasized caution regarding rate cuts, citing renewed inflation risks from tariffs.
Speaking to CNBC, Holzmann noted that while inflation pressures had previously "somewhat dissipated," the latest developments, particularly increased trade frictions, pose fresh threats to price stability. As a result, policymakers must be careful in their approach on policy easing.
Holzmann explained that while increased trade barriers may reduce economic growth, they also contribute to inflationary pressures. "We will have to be more patient," he stated.
Addressing speculation about a larger 50 basis point rate cut, Holzmann dismissed the idea, arguing that ECB’s mandate is to manage inflation, not stimulate growth.
"Using the interest rate in order to initiate a higher growth is not the way how we should work," he stated.
US CPI Release Today: What to Expect and Market Reactions
- US CPI inflation data for February 2025 is being released today, and markets are closely watching due to recent increases in inflation expectations.
- Economists expect headline inflation to rise by 0.3% for the month, keeping the yearly rate at 2.9%.
- The article provides a table outlining potential market impacts based on different CPI scenarios on the US Dollar.
US CPI inflation data will be released today at 13h30 GMT time. Markets are paying close attention to today’s release following a significant uptick in inflation expectations revealed in last week’s Michigan Sentiment Index.
The incoming US administration of Donald Trump and his tariff and economic policies have made stoked inflation fears. I still think this inflation print will be too early to see any effects from President Trump’s tariff policies.
Having said that, any significant uptick in inflation could definitely add to market concerns around the trajectory of inflation moving forward, especially when the impact of tariffs begin to have an effect.
What is the Expected CPI Print?
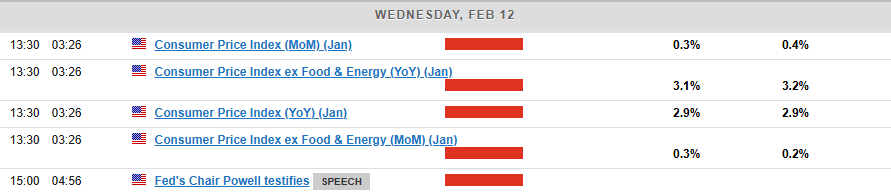
Inflation continues to be a concern, even though the U.S. economy is still strong. In December 2024, prices went up by 0.4% compared to the previous month, leading to an annual inflation rate of 2.9%. Core inflation, which leaves out food and energy prices, increased by 0.2% in December and reached 3.2% over the year.
These numbers show how difficult it is to lower inflation to the Federal Reserve’s target of 2%. Fed Chair Jerome Powell reiterated yesterday that there is no rush for further rate cuts as the Fed will wait and see the impacts of President Trump policies.
Economists predict that headline inflation for January will go up by 0.3% compared to the previous month, keeping the yearly rate at 2.9%. Core inflation, which leaves out food and energy, is also expected to rise by 0.3% for the month, with the yearly rate easing slightly to 3.1% from December’s 3.2%.
This would show a continued gradual slowdown since inflation peaked in 2022.
The January inflation increase is expected to be driven by higher auto insurance rates and consistent rises in housing-related costs, which have been big drivers of core inflation. However, slightly lower energy prices, especially gasoline, may help balance out some of the increase. While housing expenses are still rising, they might start to show slower growth, following the broader pattern of easing price pressures in the rental market.
Potential Market Impact
Looking at the potential scenarios from today’s CPI release, I have created a table that may help. Now this of course is no guarantee as to how the market may react but rather my take on the potential movements that could materialize.
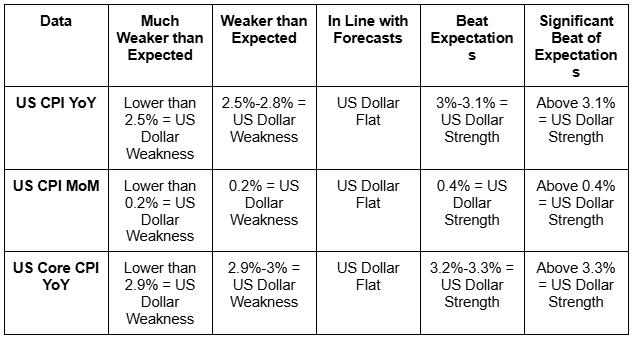
Source: Table created by Zain Vawda, Data from LSEG, TradingEconomics
The above table provides an insight into what I expect will happen depending on the CPI prints released later in the day.
My personal expectations are that the data will land quite close to expectations which could lead to some short-term volatility and whipsaw price action before markets settle down.
Technical Analysis
From a technical standpoint, the dollar has enjoyed a positive start to the week but struggled to continue its bullish momentum yesterday.
The 108.49 resistance level continues to hold firm for now and CPI is unlikely to change this unless we have a significant beat or miss of the forecasts.
Immediate support rests at 107.50 and 107.00. Resistance on the other hand rests at 108.49, 109.52 before the psychological 110.00 handle comes into focus.
I do not see today’s data providing any impetus for a break of the recent trading range between the 107.00 and 108.49 handles.
US Dollar Index (DXY) Daily Chart, February 12, 2025
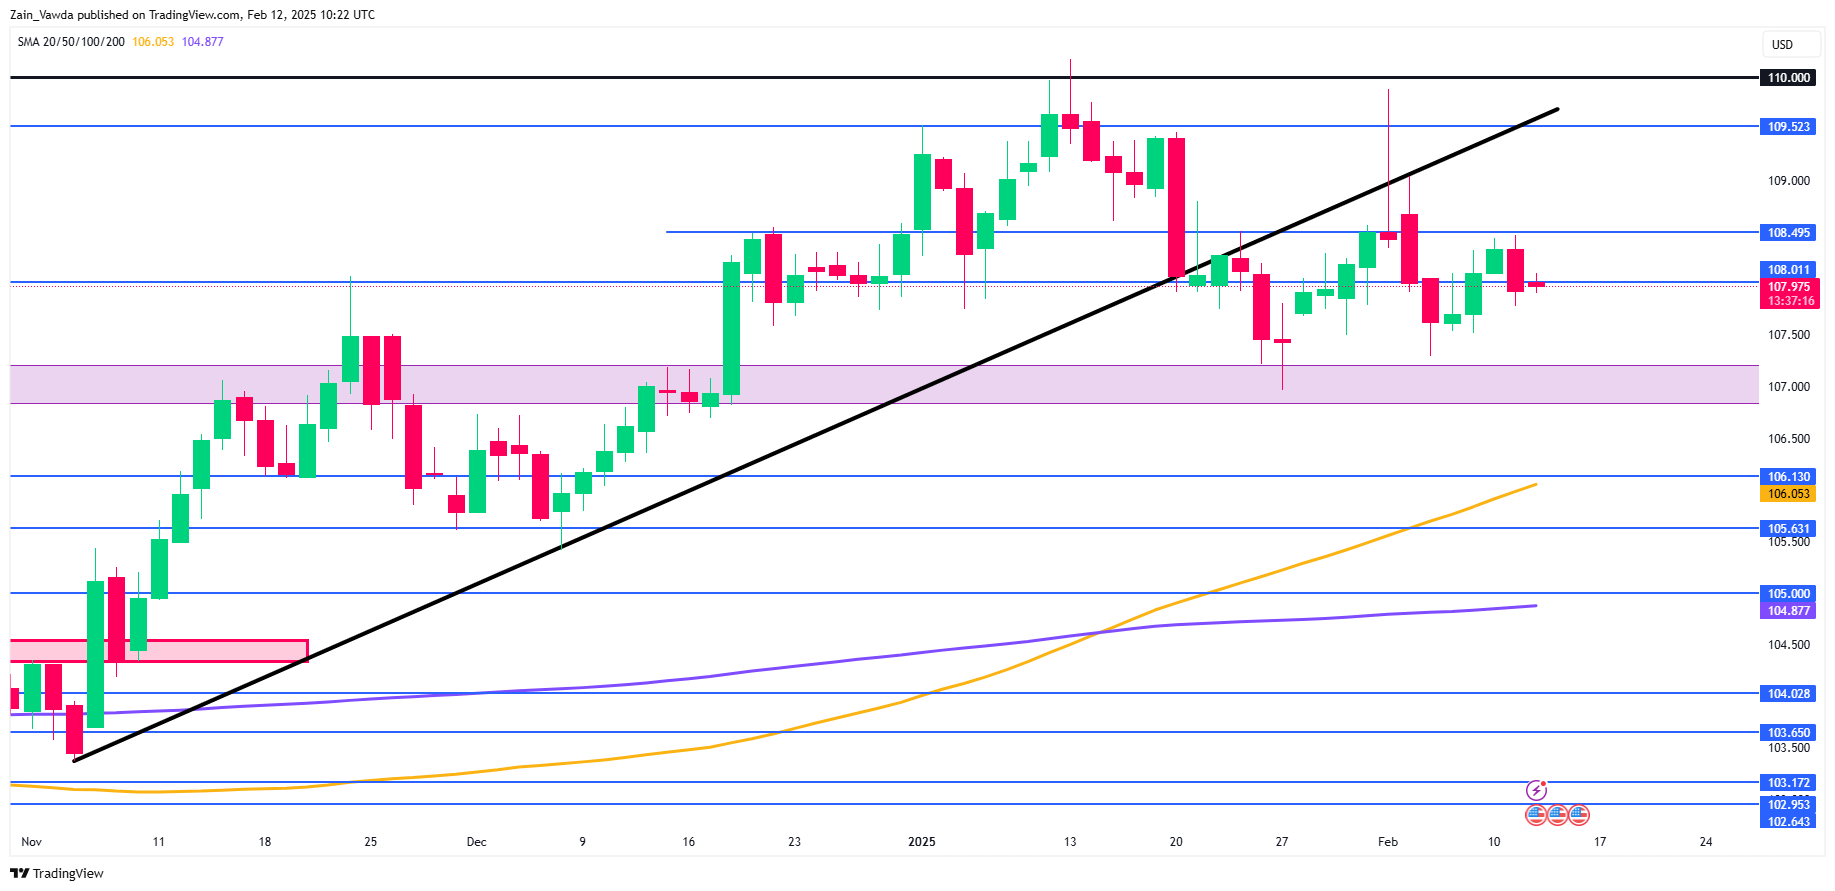
Source: TradingView.com (click to enlarge)
Support
- 107.50
- 107.00
- 106.13
Resistance
- 108.49
- 109.52
- 110.00
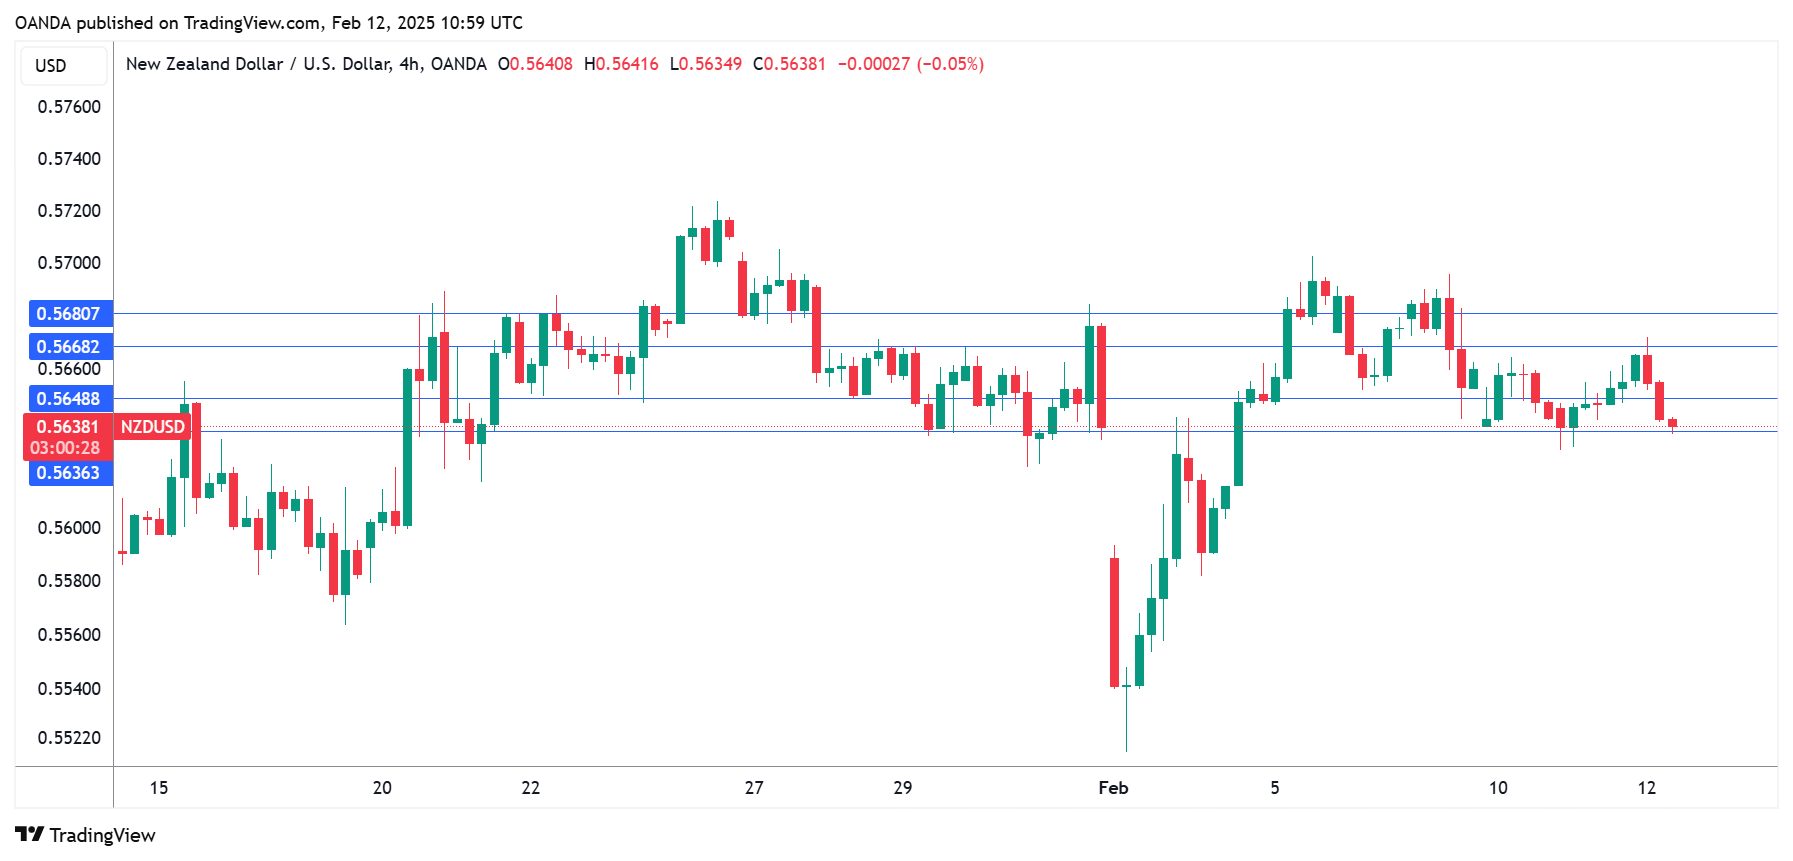
NZ Dollar Eyes US and New Zealand Inflation Data
The New Zealand dollar is in negative territory on Wednesday. NZD/USD is trading at 0.5636 in the European session, down 0.31% on the day.
US CPI expected to tick lower to 0.3%
The markets are keeping a close eye on the January inflation report, which will be released later today. Headine inflation is expected to remain unchanged at 2.9% y/y, while monthly it is expected to dip to 0.3% from 0.4%. The core rate, which excludes food and energy, is projected to dip to 3.1% y/y from 3.2%. Monthly core CPI is projected to rise to 0.3% from 0.2%.
The Federal Reserve is expected to cut rates once or twice this year, sharply lower than the Fed’s December forecast of four rate cuts. The US economy is performing well and there isn’t much pressure on the Fed to lower rates right now. The markets have priced in a rate hold at the March meeting at 95%, according to the CME’s FedWatch.
Fed Chair Powell reiterated in testimony before a Senate Banking committee on Tuesday that the Fed “does not need to be in a hurry” to adjust policy. Powell said that rate policy remains restrictive but the Fed would be careful not to lower rates too quickly or too slowly. Powell deflected a question about Trump’s tariffs and US trade policy but acknowledged that tariffs could lift inflation and complicate the Fed’s ability to lower rates.
New Zealand releases inflation expectations early Thursday. The forecast for the first quarter stands at 1.8% q/q, compared to 2.1% in Q4 2024. Inflation remained unchanged at 2.2% in the fourth quarter, close to the Reserve Bank of New Zealand’s target of 2%. The RBNZ meets next week and the money markets have fully priced in a rate cut, with about a 50/50 probability of quarter-point or half-point cut.
NZD/USD Technical
- NZD/USD has pushed below support at 0.5648 and is testing support at 0.5636. Below, there is support at 0.5549
- There is resistance at 0.5668 and 0.5680
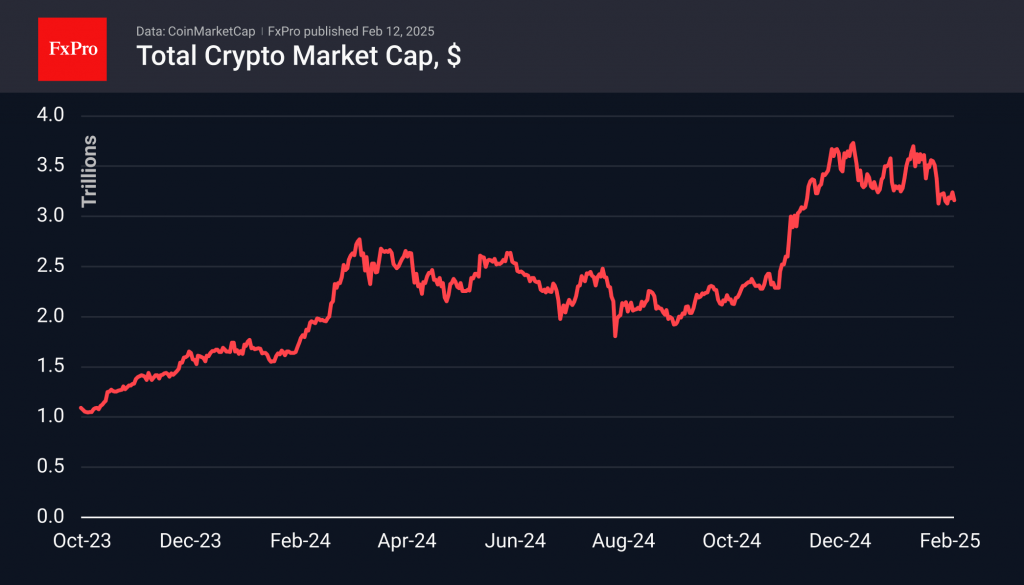
Crypto: No Growth Without Fear
Market picture
The crypto market continues to bump along, pulling back 2.7% to $3.15 trillion after flirting with the $3.3 mark the day before. This week, the market is hovering near the lower boundary of the descending corridor.
Technically, a rebound from these levels is more likely. However, the wiser approach is to wait, as the risk of a sharper decline remains high after an extended period of weakness.
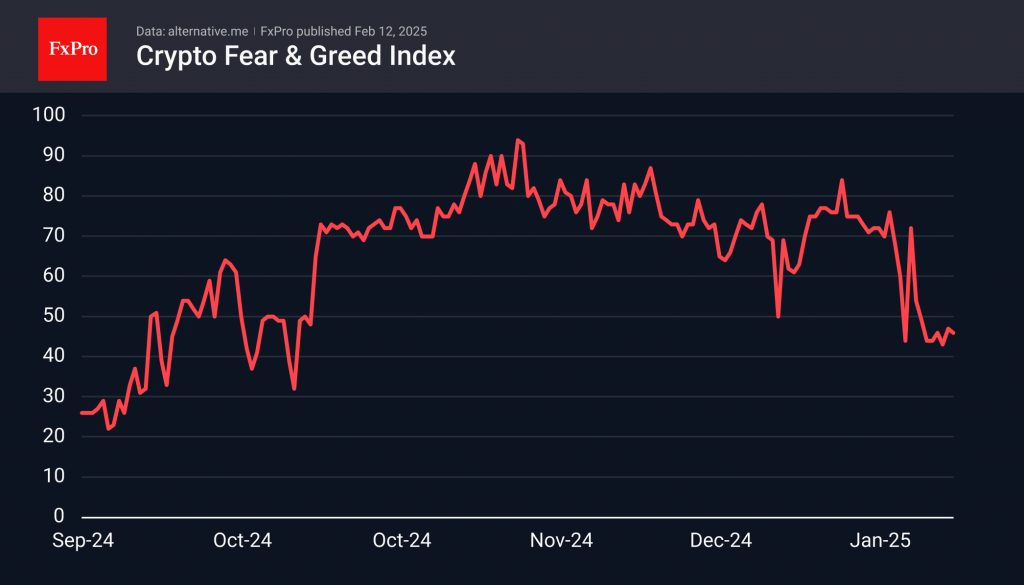
The cryptocurrency sentiment index is hovering between the fringes of fear and neutral territory, having lost 1 point to 46 by Wednesday morning. Still, the market lacks enough fear to attract buyers.
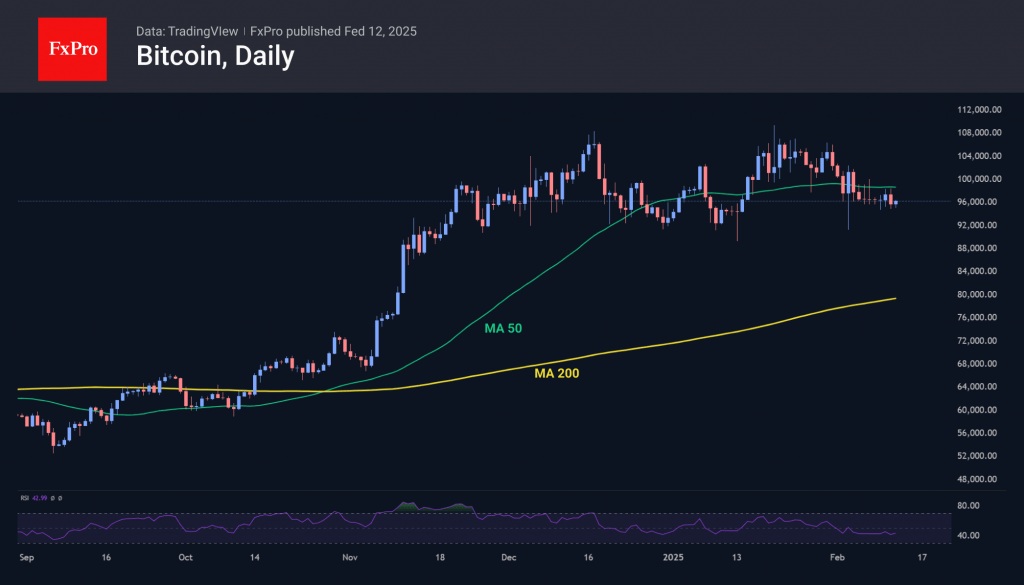
On Tuesday, Bitcoin once again rebounded from its 50-day moving average near $98,600, a strong resistance level over the past week. However, intraday buying interest on dips below $95,000 remains evident. The RSI dynamics align with sentiment index trends, suggesting that a deeper move into oversold territory may be needed to attract buyers.
News Background
Galaxy Digital CEO Mike Novogratz expects Bitcoin to be on the government’s books in six months. He also expects that following the SEC leadership change, many cryptocurrency companies, including Galaxy Digital, will go public and list their shares on the New York Stock Exchange or Nasdaq.
Strategy, which had temporarily paused its initial cryptocurrency purchases, has now resumed buying Bitcoin. Last week, the company acquired 7,633 BTC for $742.2 million at an average price of approximately $97,255.
Strategy (formerly MicroStrategy) holds 478,740 BTC, purchased for a combined $31bn at an average price of $65,033 per coin.
Santiment estimates that market participant interest has definitively shifted from meme coins to Bitcoin and leading alts. Leading Tier 1 blockchains, including Ethereum, Solana, Toncoin and Cardano, account for 44% of all cryptocurrency discussions on social media.
Bloomberg cites Litecoin (LTC), Solana (SOL), XRP, and Dogecoin (DOGE) as having high odds of ETF approval. For LTC and DOGE, the U.S. Securities and Exchange Commission (SEC) has already accepted Forms 19b-4 for review.
In the 19 days since the launch of Official Trump (TRUMP), the volume of accumulated losses from investments in the US president’s meme-coin has reached $2bn, the NYT estimates. More than 810,000 users have experienced losses.
ECB’s Villeroy warns of negative impact from US tariffs
French ECB Governing Council member Francois Villeroy de Galhau cautioned that US President Donald Trump’s tariffs will "very likely" have a "negative effect" on the economy.
Speaking on France Culture radio, Villeroy criticized "protectionism is a seductive short-term policy, but in the long term it is a losing strategy."
Despite trade tensions, Villeroy maintained an optimistic view on France’s economic resilience. He reaffirmed that the country is likely to avoid a recession in 2025.
Bank of France indicated on Tuesday that French GDP is on track to expand by 0.1% to 0.2% in the first quarter.
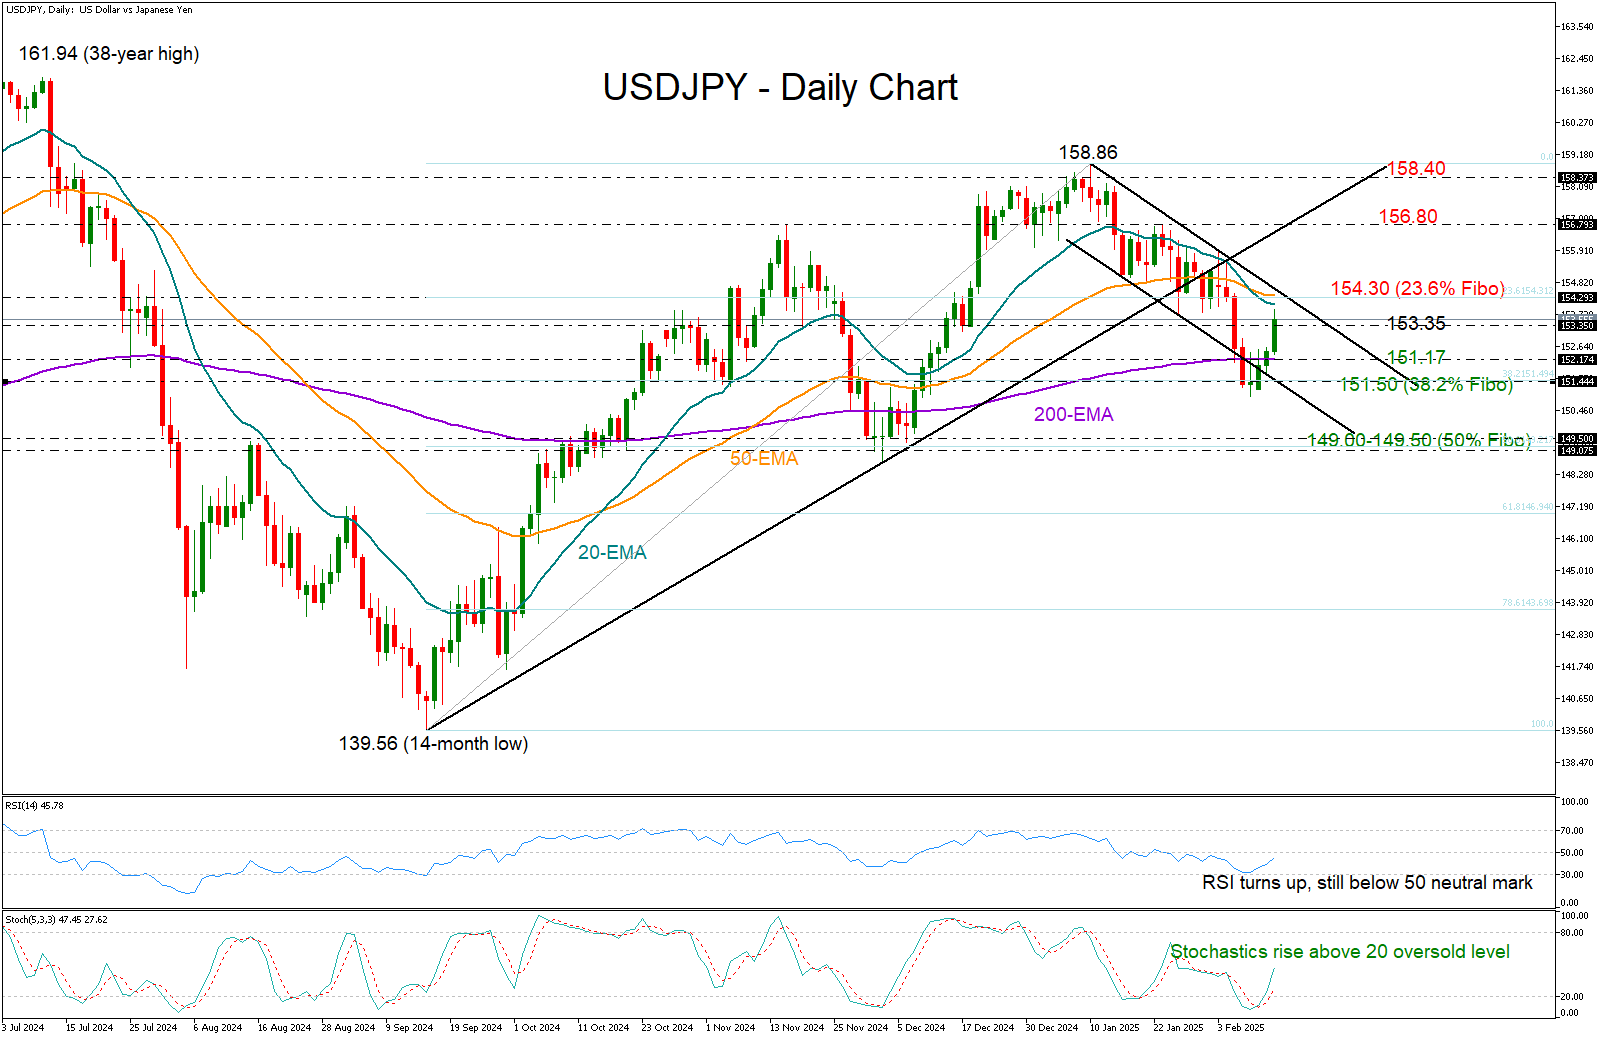
USD/JPY on the Rise: Is the Rally Sustainable?
- USD/JPY starts a new bullish cycle ahead of US CPI data.
- Key resistance near 154.30. Will the bulls retain their power?
USDJPY drifted up to 153.72 after confirming a bullish morning star candlestick pattern above its constraining 200-day exponential moving average (EMA). This marks the start of a potential new bullish cycle—at least for now.
The positive reversal in the RSI and the stochastic oscillator is reflecting improving buying appetite, though the former is still some distance below its 50 neutral mark, suggesting the market is still waiting for confirmation.
Perhaps, some patience is necessary until the price clears the crucial resistance of 154.30. This is where the 23.6% Fibonacci retracement of the September-January upleg, the upper band of short-term bearish channel, as well as the 20- and 50-day EMAs are sitting. If the pair can break through this wall, a faster rally could follow towards the 156.80 region, while higher the focus could turn to the 158.40 barrier.
Yet, the bearish cross between the 20- and 50-day EMAs is casting doubt about whether the pair will return to an uptrend soon, particularly if it fails to close above 153.35. In this case, the price could flip backwards to retest the flat 200-day EMA near 151.17 and the 38.2% Fibonacci of 151.50. Additional losses from there could set the stage for a deeper pullback into the 149.00-149.50 territory, where the 50% Fibonacci number lurks.
In summary, USDJPY is enjoying some recovery at the moment, though it's not out of the woods yet. A decisive break above 154.30 would likely eliminate downside risks, but until then, traders may stay on their toes.
Market Analysis: GBP/USD Recovers While USD/CAD Takes A Dive
GBP/USD started a fresh increase above the 1.2400 zone. USD/CAD declined and now consolidates below the 1.4360 level.
Important Takeaways for GBP/USD and USD/CAD Analysis Today
- The British Pound is eyeing more gains above the 1.2465 resistance.
- There was a break above a key bearish trend line with resistance at 1.2390 on the hourly chart of GBP/USD at FXOpen.
- USD/CAD started a fresh decline after it failed to clear the 1.4800 resistance.
- There is a short-term bearish trend line forming with resistance at 1.4320 on the hourly chart at FXOpen.
GBP/USD Technical Analysis
On the hourly chart of GBP/USD at FXOpen, the pair formed a base above the 1.2330 level. The British Pound started a steady increase above the 1.2360 resistance zone against the US Dollar, as discussed in the previous analysis.
There was a break above a key bearish trend line with resistance at 1.2390. The pair surpassed the 50% Fib retracement level of the downward move from the 1.2549 swing high to the 1.2332 low.
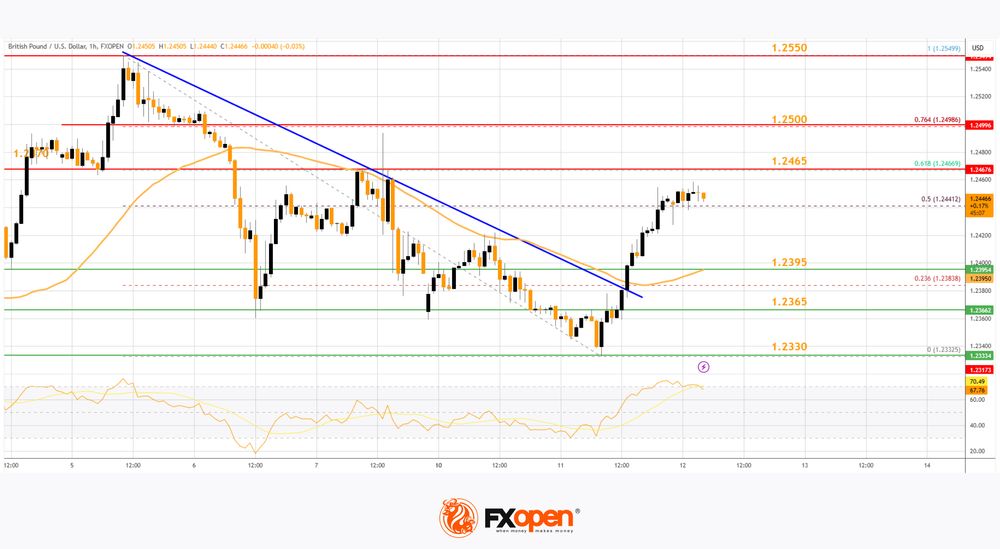
The pair gained strength above the 1.2420 level and the 50-hour simple moving average. The pair tested the 1.2460 zone and is currently consolidating gains. The bulls are now active near the 1.2440 level. If there is another decline, the pair could find support near the 1.2395 level.
The first major support sits near the 1.2365 zone. The next major support is 1.2330. If there is a break below 1.2330, the pair could extend the decline. The next key support is near the 1.2250 level. Any more losses might call for a test of the 1.2150 support.
Conversely, the bulls might aim for more gains. The RSI moved above the 60 level on the GBP/USD chart and the pair is now approaching a major hurdle at 1.2465 and the 61.8% Fib retracement level of the downward move from the 1.2549 swing high to the 1.2332 low.
An upside break above the 1.2465 zone could send the pair toward 1.2500. Any more gains might open the doors for a test of 1.2550.
USD/CAD Technical Analysis
On the hourly chart of USD/CAD at FXOpen, the pair climbed toward the 1.4800 resistance zone before the bears appeared. The US Dollar formed a swing high near 1.4790 and recently declined below the 1.4500 support against the Canadian Dollar.
There was also a close below the 50-hour simple moving average and 1.4360. The bulls are now active near the 1.4270 level. The pair is now consolidating losses below the 23.6% Fib retracement level of the downward move from the 1.4792 swing high to the 1.4270 low.
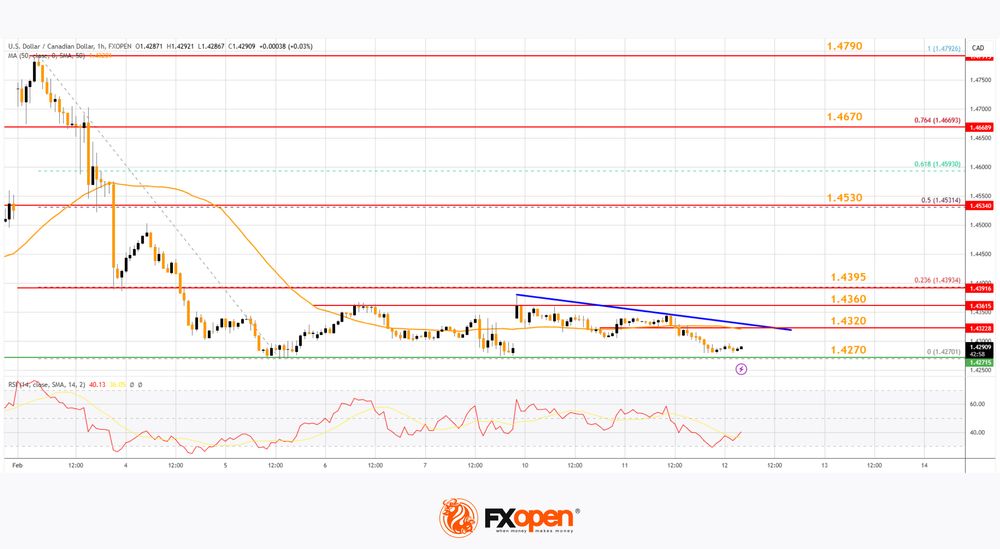
If there is a fresh increase, the pair could face resistance near the 1.4320 level. There is also a short-term bearish trend line forming with resistance at 1.4320.
The next key resistance on the USD/CAD chart is near the 1.4360 level. If there is an upside break above 1.4360, the pair could rise toward the 1.4395 resistance. The next major resistance is near the 50% Fib retracement level of the downward move from the 1.4792 swing high to the 1.4270 low at 1.4530, above which it could rise steadily toward the 1.4790 resistance zone.
Immediate support is near the 1.4270 level. The first major support is near 1.4240. A close below the 1.4240 level might trigger a strong decline. In the stated case, USD/CAD might test 1.4000. Any more losses may possibly open the doors for a drop toward the 1.3850 support.
Trade over 50 forex markets 24 hours a day with FXOpen. Take advantage of low commissions, deep liquidity, and spreads from 0.0 pips. Open your FXOpen account now or learn more about trading forex with FXOpen.
This article represents the opinion of the Companies operating under the FXOpen brand only. It is not to be construed as an offer, solicitation, or recommendation with respect to products and services provided by the Companies operating under the FXOpen brand, nor is it to be considered financial advice.