Sample Category Title
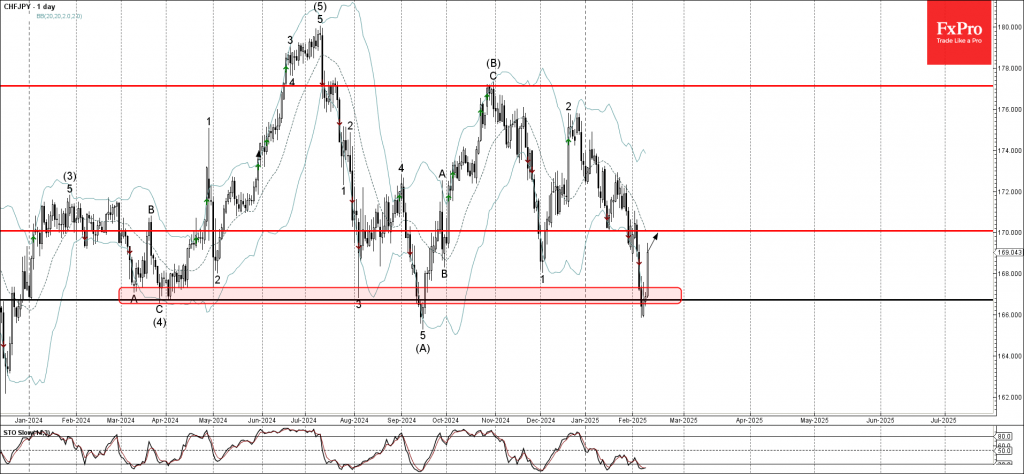
CHFJPY Wave Analysis
- CHFJPY reversed from the support area
- Likely to rise to the resistance level 170.00
CHFJPY currency pair recently reversed up from the support area located between the multi-month support level 166.70 (which has been reversing the price from last March) and the lower daily Bollinger Band.
The upward reversal from this support area created the daily Japanese candlesticks reversal pattern Piercing Line.
Given the strength of the support level 166.70 and the oversold daily Stochastic, CHFJPY currency pair can be expected to rise to the next resistance level 170.00 (former support from last month).
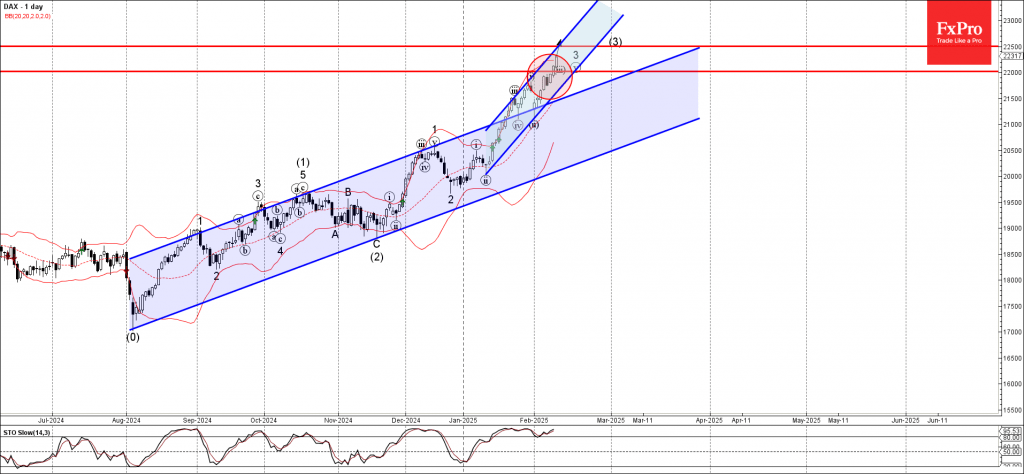
DAX Index Wave Analysis
- DAX index broke resistance level 22000.00
- Likely to rise to resistance level 22500.00
DAX index is under the bullish pressure afar the earlier breakout of the daily up channel from August and the resistance level 22000.00
The breakout of the resistance level 22000.00 greatly accelerated the active impulse wave 3, which belongs to the intermediate impulse wave (3) from November.
Given the clear daily uptrend and the accelerating upward channel inside which the price is moving now, DAX index can be expected to rise to the next resistance level 22500.00 (target price for the completion of the active impulse wave 3).
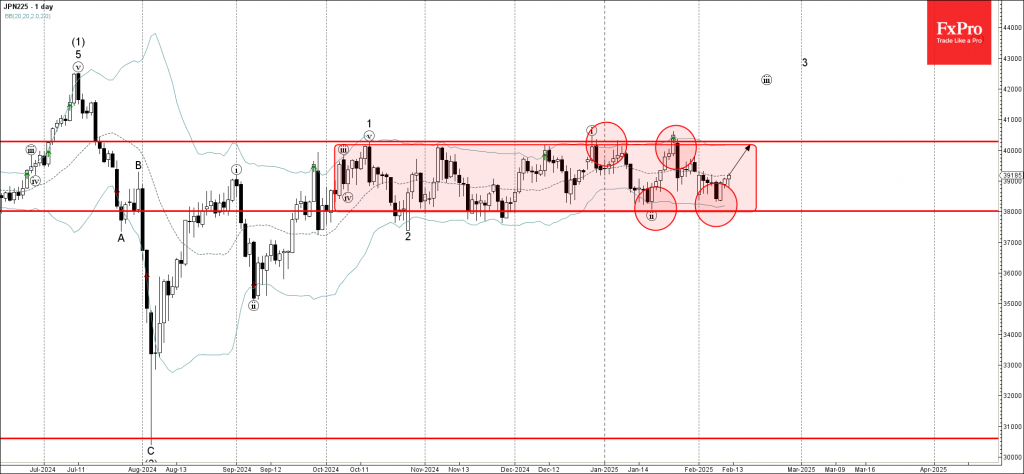
Nikkei 225 index Wave Analysis
- Nikkei 225 index reversed support level 38000.00
- Likely to rise to resistance level 40285.00
Nikkei 225 index recently reversed up from the support level 38000.00, which is the lower border of the narrow sideways price range inside which the index has been moving from last October. This support area was strengthened by the lower daily Bollinger Band
The upward reversal from this support area created the daily Japanese candlesticks reversal pattern Piercing Line.
Given the clear daily uptrend, Nikkei 225 index can be expected to rise to the next resistance level 40285.00 (the upper border of this price range).
Hot January CPI Sends a Chill Over the Inflation Outlook
Summary
Expectations of seeing further modest improvement in inflation at the start of this year were dashed by the January Consumer Price Index. The headline CPI rose 0.5% last month, well ahead of consensus expectations for a 0.3% increase. The upside surprise to the core index was more modest (0.4% versus expectations for a 0.3% increase), but illustrated broad-based strength in pricing at the start of the year. Core goods prices rose 0.3% and are now little changed over the past year as the deflationary tailwinds of improving supply chains have petered out. Core services prices rose 0.5% amid a 0.4% rise in shelter costs and strength in non-housing services like transportation and recreation.
The upside surprise is reminiscent of last January's CPI report and suggests even the updated seasonal factors released in today's report are still struggling to capture early year price increases after the pandemic-period scrambled the typical calendar year pattern of price changes. That said, both the year-over-year rates of the headline and core CPI indices rose over the month. Therefore, setting aside any issues over residual seasonality, today's report offers more evidence of progress in lowering inflation stalling out.
January Déjà Vu
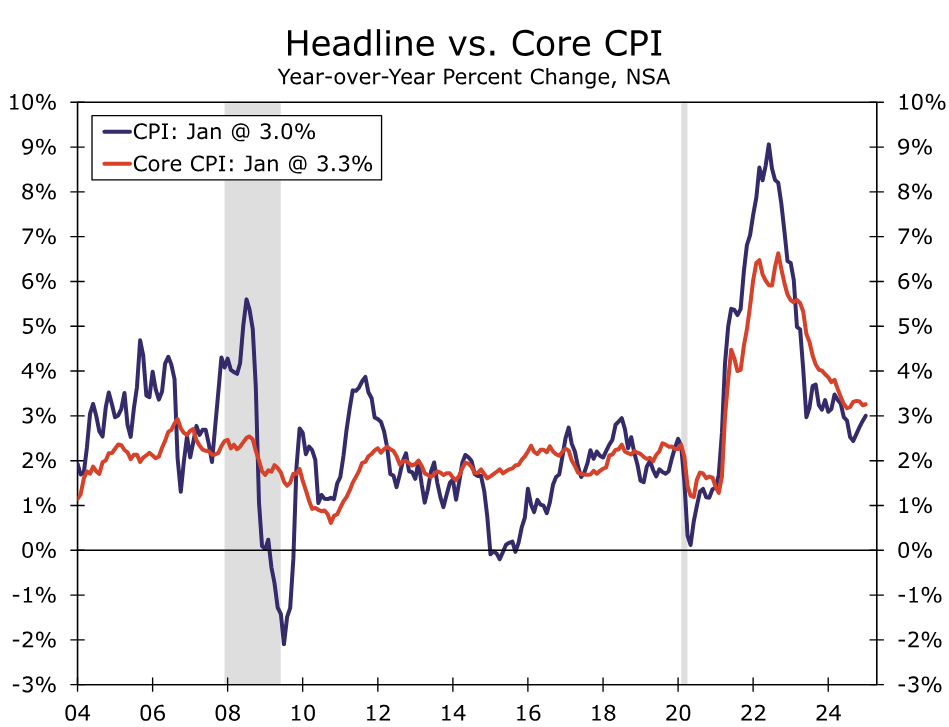
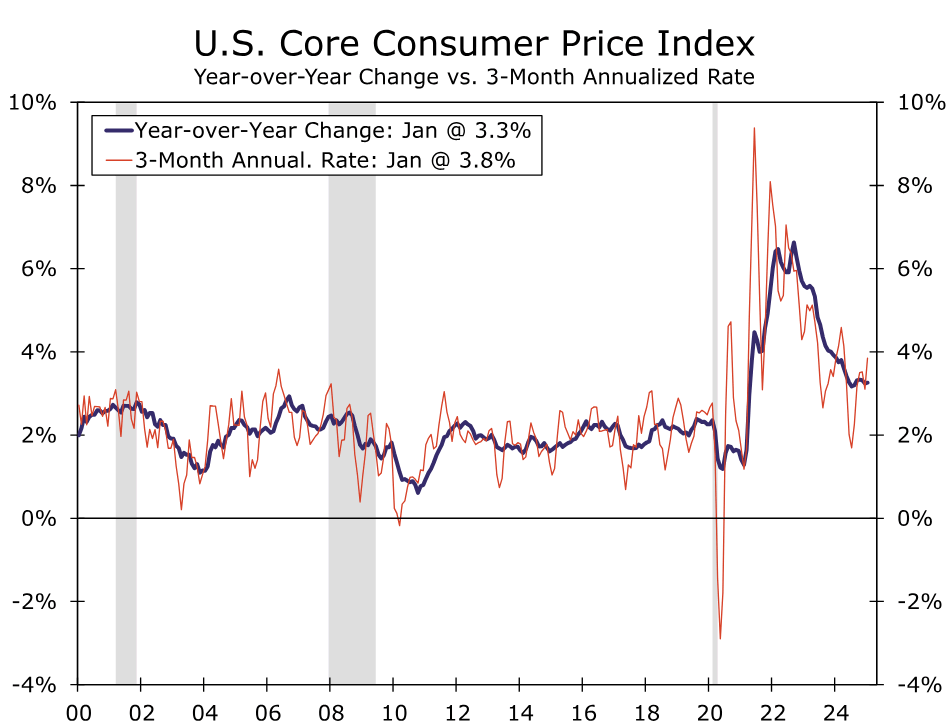
The stubborn picture of inflation continued in January with the Consumer Price Index coming in hotter than expected. Prices rose 0.5% at the start of the year, compared to consensus expectations of a 0.3% gain. On a year-over-year basis, prices rose 3.0%—the strongest 12-month change since June (chart).
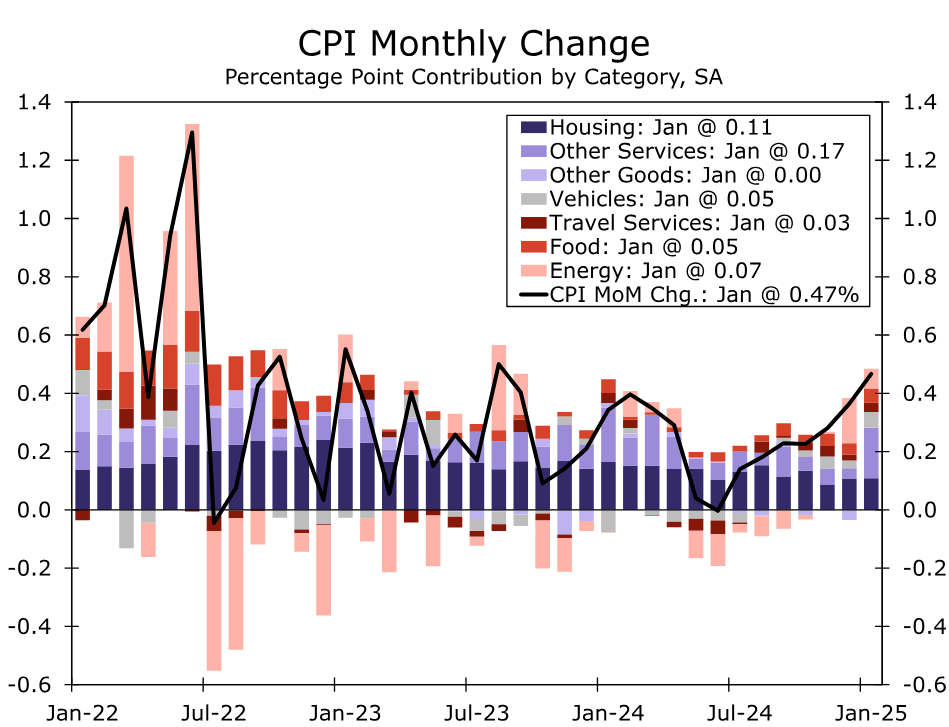
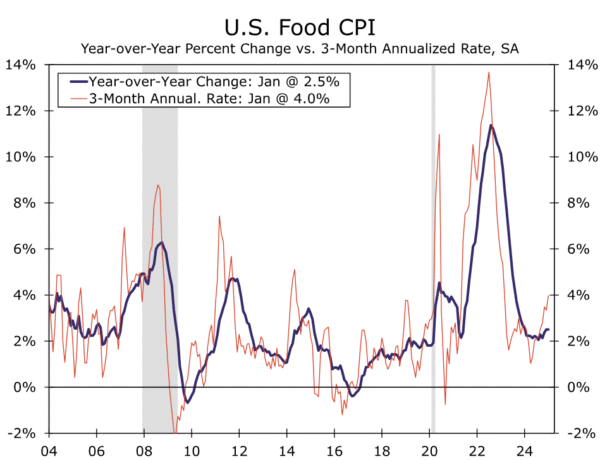
Part of the headline's strength can be tied to a surprisingly large lift in energy prices (chart). Energy goods prices rose 1.9% amid strength in gasoline prices and fuel oil, overshadowing a more temperate rise in energy services. Meantime, the upswing in food inflation continued in January (chart). Grocery prices rose 0.5% amid another leap in egg prices (+15.2%) and are up 1.9% over the past year. Prices for food away from home rose a more modest 0.2% but continue to see more firm growth on trend having advanced 3.4% over the past year.
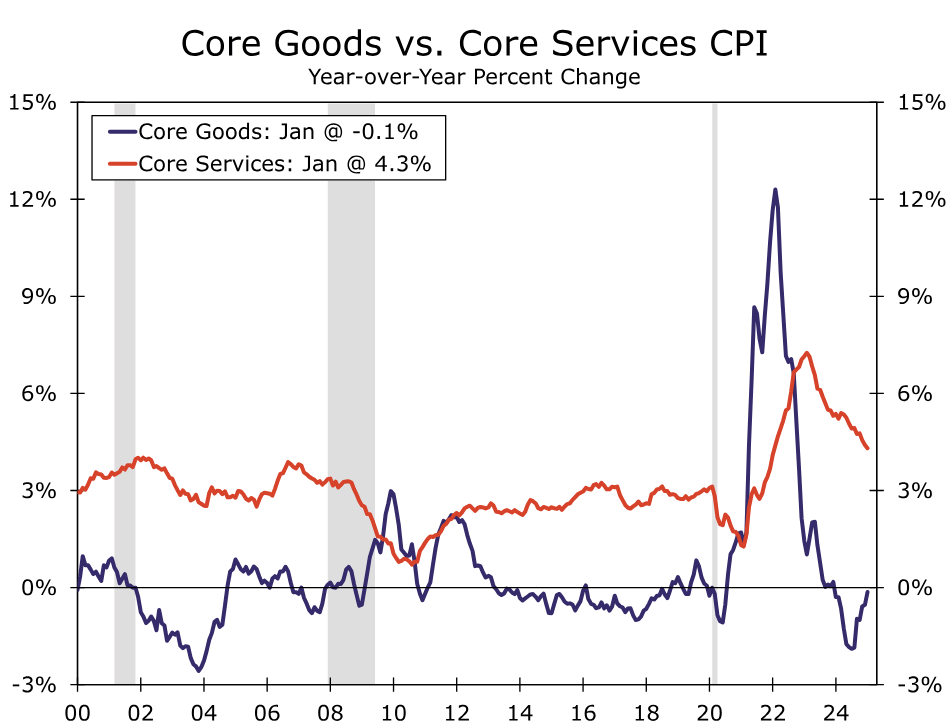
 Excluding food and energy, price growth also beat expectations with a 0.4% gain in January. Gains were broad-based among major components. Core goods prices were up 0.3% over the month and roughly flat over the past year as the disinflationary tailwinds from improved supply chains have run their course (chart). Much of the pickup can be traced to a jump in used vehicle prices (+2.2%), motor vehicle parts (+0.8%) and medical care commodities (+1.2%), whereas apparel posted a notable decline in prices (-1.4%).
On the services side, core prices rose 0.5%. The closely-watched shelter component rose 0.4% over the month, with both rent of primary residences and owners' equivalent rents rising 0.3%, in line with their six-month averages. Lodging away from home, however, helped lift the shelter component with a +1.4% rise over the month, which we see as partially tied to the L.A. wildfires given higher-than-usual occupancy in the area during the month. Beyond shelter, outsized gains in motor vehicle insurance (+2.0%), airline fares (+1.2) and recreation services helped drive core services higher.
January's unexpected strength echoes the pop in prices registered at the start of 2024 and renews questions over residual seasonality (i.e., the inability of seasonal factors to fully capture regular calendar patterns) in the data. However, looking at the year-over-year data to remove issues around seasonality also points to inflation's ongoing strength. The 12-month pace of core CPI picked up to 3.3% in January, keeping it within the 3.2%-3.3% range it has resided in since June (chart). We expect the 12-month rate of core inflation to remain stuck near this level in the coming months, with the core index rising at a loftier 3.8% annualized pace over the past three months.
FOMC officials have made clear that they are in no hurry to adjust the current stance of monetary policy. With inflation still running above the FOMC's target, the labor market looking sturdier after last summer's wobble and heightened uncertainty around economic policy changes, we believe the Committee has settled into a prolonged hold. We have not changed our expectations for two 25 bps rate cuts in September and December of this year, but we believe the risks are skewed toward no cuts this year if the inflation data do not cool further in the months ahead.
Sunset Market Commentary
Markets
Today’s trading session was a long-drawn countdown to the US January inflation data. If anything, the drift in EMU yields still was cautiously north. ECB board member Elderson joined recent comments that data are more important to guide short-term policy decision rather than an assessment on the concept of the natural rate for policy. German yields added up 3.0 bps (2-y). US yields returned small gains just before the CPI release as President Trump on social media advocated the need to lower rates. However, his call for sure won’t fit the Fed assessment post today’s US inflation data. Headline CPI inflation rose an outsized 0.5% M/M (highest since August…2023!!) to raise the Y/Y figure back to 3.0% (from 2.9%). Core inflation also jumped from 0.2% M/M and 3.2% in December to 0.4% M/M and 3.3% (vs 3.1% expected). Food (0.4% M/M and 2.5% Y/Y) and energy prices (1.1% M/M) supported the rise in prices but also services inflation (ex-energy) remains elevated at 0.5% M/M and 4.3% Y/Y. Shelter prices don’t show much of a downward dynamic at 0.4% M/M and 4.4% Y/Y. The super-core inflation (core services less housing as calculated by Bloomberg) at 0.76% M/M doesn’t give comfort. The market reaction was straightforward. US yields currently add between 10 bps (5 & 10-y) and 6-8 bps (2-y and 30-y) the belly thus underperforming the wings. Markets now only discount one single 25 bps cut by the end of the year. Interesting to hear first comments from Fed Chair Powell later today as he testifies before the House Financial Services Committee. The context for today’s $42 bln US Treasury 10-y Note sale also profoundly changed. German yields gained in sympathy, albeit modestly, between 5 bps (2-y) and bps (30-y). The bond market sell-off also pressured US equities with losses of about 1.0% for the three major US indices. Damage for the EuroStoxx 50 (-0.2%) stays limited.
On FX markets, dollar gains again were not exuberant given the sharp rise in yields and the congruent (mainly US) risk-off. DXY gains from about 108 to currently 108.35. The yen clearly underperforms. USD/JPY already rise to from 152.5 to 153.5 before the release to currently extends to 154.2. On the other hand, the euro showed strong resilience with EUR/USD ‘easily’ holding north of 1.03. (1.034 currently). Is some kind of US risk premium building? Recent strength in the likes of the NOK and the SEK (against the euro) is partially reversed. CE currencies (zloty, forint) show negligible losses (against the euro). The Czech koruna even strengthens (EURCZK 25.06).
News & Views
Indian inflation eased a tad more than expected last month. The yearly print fell from 5.22% to 4.31% compared to the 4.5% estimate. Monthly prices fell 1%, driven by a steep 2.9% m/m decline in food prices. Prices of other components including clothing & footwear, housing and fuel & light rose insufficiently to offset the drag of food. The numbers are welcome news to the Reserve Bank of India (RBI) which last week pivoted towards a first 25 bps rate cut after having kept rates steady for two years. Future decisions would be “based on a fresh assessment of the economic outlook”, it said in the accompanying statement. With CPI closing in on the RBI’s 4% target (+/- 2 ppts), the case for additional rate cuts from the current 6.5% as soon as April 9 is strengthening. The RBI needs to thread carefully though, having the Indian currency in mind. While the rupee appreciated since the start of the week from USD/INR <88 to around 86.88 today, it remains historically weak. USD/INR has also yet to react to the Indian CPI outcome as well as the larger-than-expected US reading of today.
OPEC in its monthly report kept forecasts for global oil demand growth unchanged for both 2025 and 2026. Demand this year would rise by 1.45 mln barrels a day and by 1.43 mln in 2026. OPEC said air and road travel would support consumption. While the Trump administration added more uncertainty into the markets, OPEC did not take into account the impact of any potential trade tariffs, saying “It remains to be seen how and to what extent potential tariffs and other policy measures will play out." OPEC holds a more optimistic view on oil demand growth compared to peers. The IEA, for example, sees demand growth at 1.05 mln this year. Oil prices trade a tad lower today around $76/b.
US: Inflationary Pressures Turn Sharply Gigher in January
The Consumer Price Index (CPI) rose 0.5% month-on-month (m/m) in January, an acceleration from December's 0.4% m/m gain. On a twelve-month basis, CPI was up 3.0% (from 2.9% in December).
- Energy prices rose 1.1% m/m, led by a further gain in gasoline prices (+1.8% m/m), though energy services (+0.3%m.m) were also higher. Food prices (+0.4% m/m) also came in on the hotter side – posting its largest monthly gain since February 2023.
Excluding food and energy, core inflation rose 0.4% m/m, ahead of the consensus and the strongest monthly gain since March 2024. The twelve-month ticked up to 3.3% (from 3.2% in December), while the three-month annualized rose to a nine-month high of 3.8%.
- The January release also included revised seasonal adjustment factors, through the impact on the monthly pattern for 2024 was relatively negligible.
- Moreover, the outsized gain in core inflation last month suggests that residual seasonality could still be a factor biasing the early-year readings of inflation higher.
Price growth on core services was up 0.5% m/m, or double the monthly gain recorded in December. On a year-ago basis, services prices remain at an elevated 4.3%.
- Primary shelter costs rose 0.3% m/m, slightly softer than the 0.4% m/m gain averaged over the prior twelve months. On a 12-month basis, shelter costs are up 4.5%.
- Non-housing services inflation (aka "supercore") accelerated sharply, rising 0.7% m/m or its strongest monthly gain since last January. Price gains were relatively broad based, with vehicle insurance (2.0% m/m), recreational services (+1.4% m/m) and travel costs (including airfares, car rentals and hotels) all recording sizeable gains last month.
Core goods prices also came in on the hotter side, rising 0.3% m/m, thanks to a further increase in used vehicle prices (+2.2% m/m), medical goods (+1.2% m/m), and recreational goods (+0.3% m/m).
Key Implications
This report is probably the last thing the Federal Reserve and new Administration wanted to see.
The first CPI reading for 2025 showed core inflation rising at its fastest pace in nearly a year, amid a further uptick in goods prices and ongoing stickiness in services inflation. In the best of case, it's chalked up to residual seasonality (i.e., the inability of seasonal adjustment factors to capture regular calendar moves) and some reversal shows up in the coming months. This effect was apparent in the January/February readings in each of the last two-years.
Following this morning's release, futures markets sold-off sharply while the 2-year Treasury yield was jolted higher by approximately 8 basis points to 4.37%. Fed futures have pushed out the timing of next rate cut to December (yesterday, September was fully priced).
EUR/USD Mid-Day Outlook
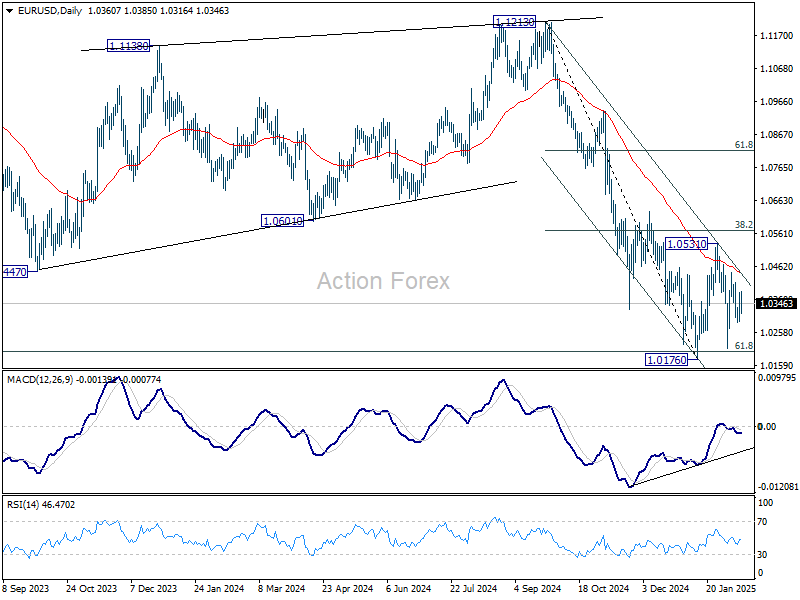
Daily Pivots: (S1) 1.0309; (P) 1.0345; (R1) 1.0398; More...
EUR/USD weakens mildly today but stays in range above 1.0176. Intraday bias remains neutral for the moment. Outlook will remain bearish as long as 38.2% retracement of 1.1213 to 1.0176 at 1.0572 holds. On the downside, break of 1.0176 will resume whole fall from 1.1213. However, decisive break of 1.0572 will raise the chance of reversal, and target 61.8% retracement at 1.0817.
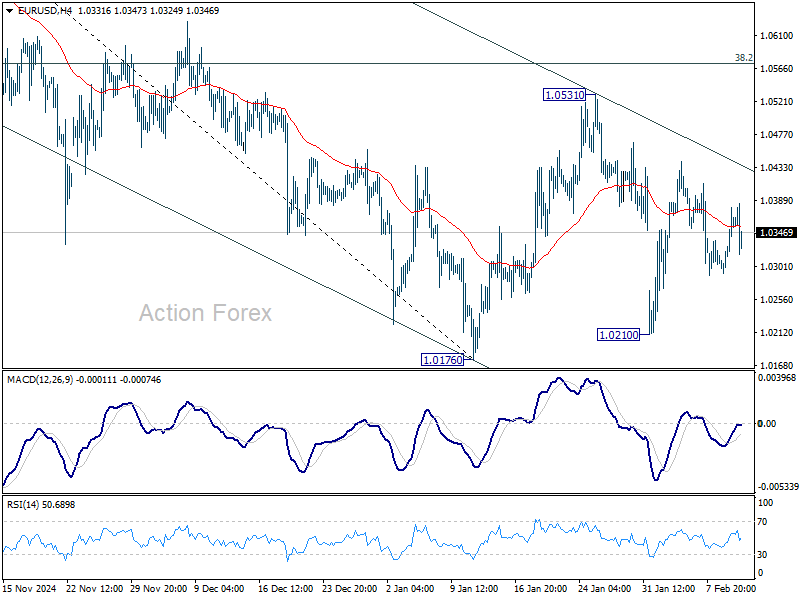
In the bigger picture, immediate focus is on 61.8 retracement of 0.9534 (2022 low) to 1.1274 (2024 high) at 1.0199. Sustained break there will solidify the case of medium term bearish trend reversal, and pave the way back to 0.9534. However, reversal from 1.0199 will argue that price actions from 1.1274 are merely a corrective pattern, and has already completed.
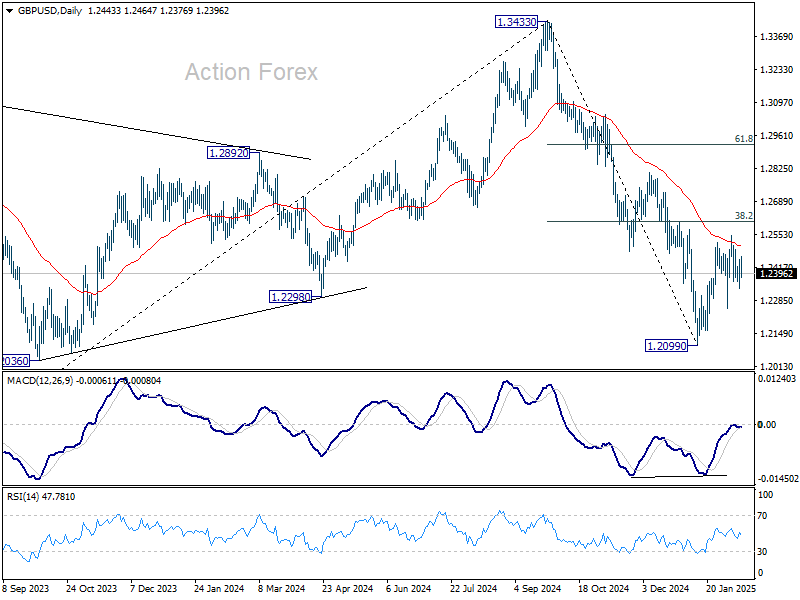
GBP/USD Mid-Day Outlook
Daily Pivots: (S1) 1.2368; (P) 1.2411; (R1) 1.2491; More...
GBP/USD dips notably in early US session but stays above 1.2248 support. Intraday bias remains neutral at this point. Corrective pattern from 1.2099 could extend with another rebound. But upside should be limited by 38.2% retracement of 1.3433 to 1.2099 at 1.2609. On the downside, break of 1.2248 support will bring retest of 1.2099 low. Firm break there will resume whole fall from 1.3433. However, decisive break of 1.2609 will raise the chance of near term reversal, and target 61.8% retracement at 1.2923.
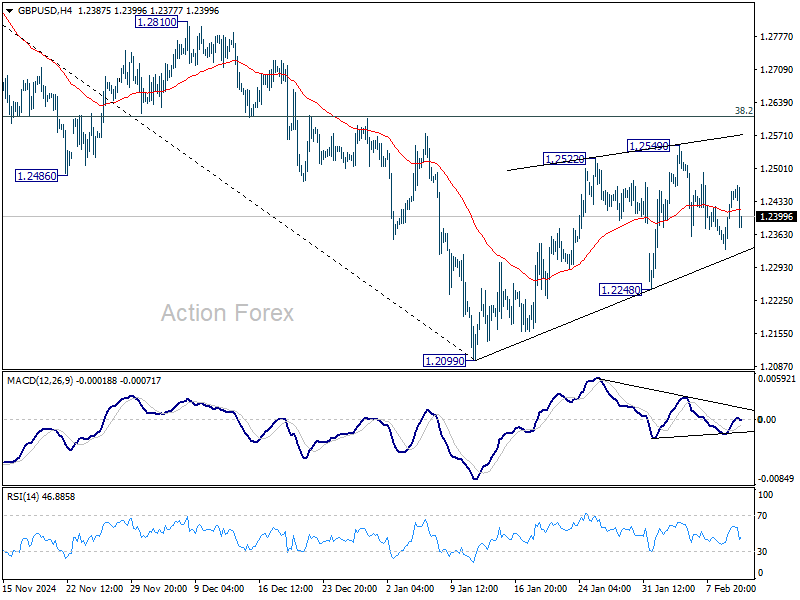
In the bigger picture, rise from 1.0351 (2022 low) should have already completed at 1.3433 (2024 high), and the trend has reversed. Further fall is now expected as long as 1.2810 resistance holds. Deeper decline should be seen to 61.8% retracement of 1.0351 to 1.3433 at 1.1528, even as a corrective move. However, firm break of 1.2810 will dampen this bearish view and bring retest of 1.3433 high instead.
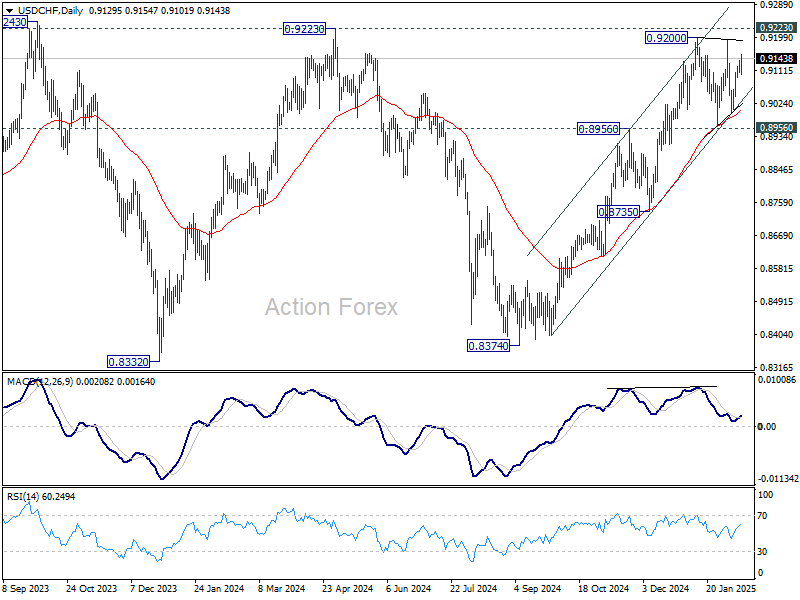
USD/CHF Mid-Day Outlook
Daily Pivots: (S1) 0.9108; (P) 0.9126; (R1) 0.9150; More…
USD/CHF's rise from 0.8990 continues today but stays below 0.9200 resistance. Intraday bias remains neutral first. Outlook stays bullish with 0.8956/64 support zone intact. On the upside, firm break of 0.9200/9223 will resume the whole rally from 0.8374 and carry larger bullish implication. However, sustained break of 0.8964 will be a sign of reversal and turn bias back to the downside.
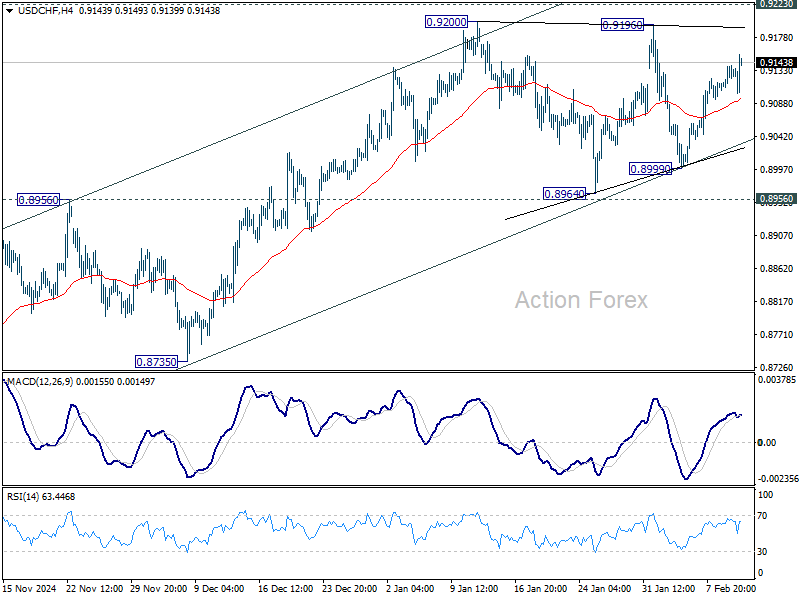
In the bigger picture, decisive break of 0.9223 resistance will argue that whole down trend from 1.0342 (2017 high) has completed with three waves down to 0.8332 (2023 low). Outlook will be turned bullish for 1.0146 resistance next. Nevertheless, rejection by 0.9223 will retain medium term bearishness for another decline through 0.8332 at a later stage.