
Sample Category Title
Crypto Market on a Lower Floor
Market Picture
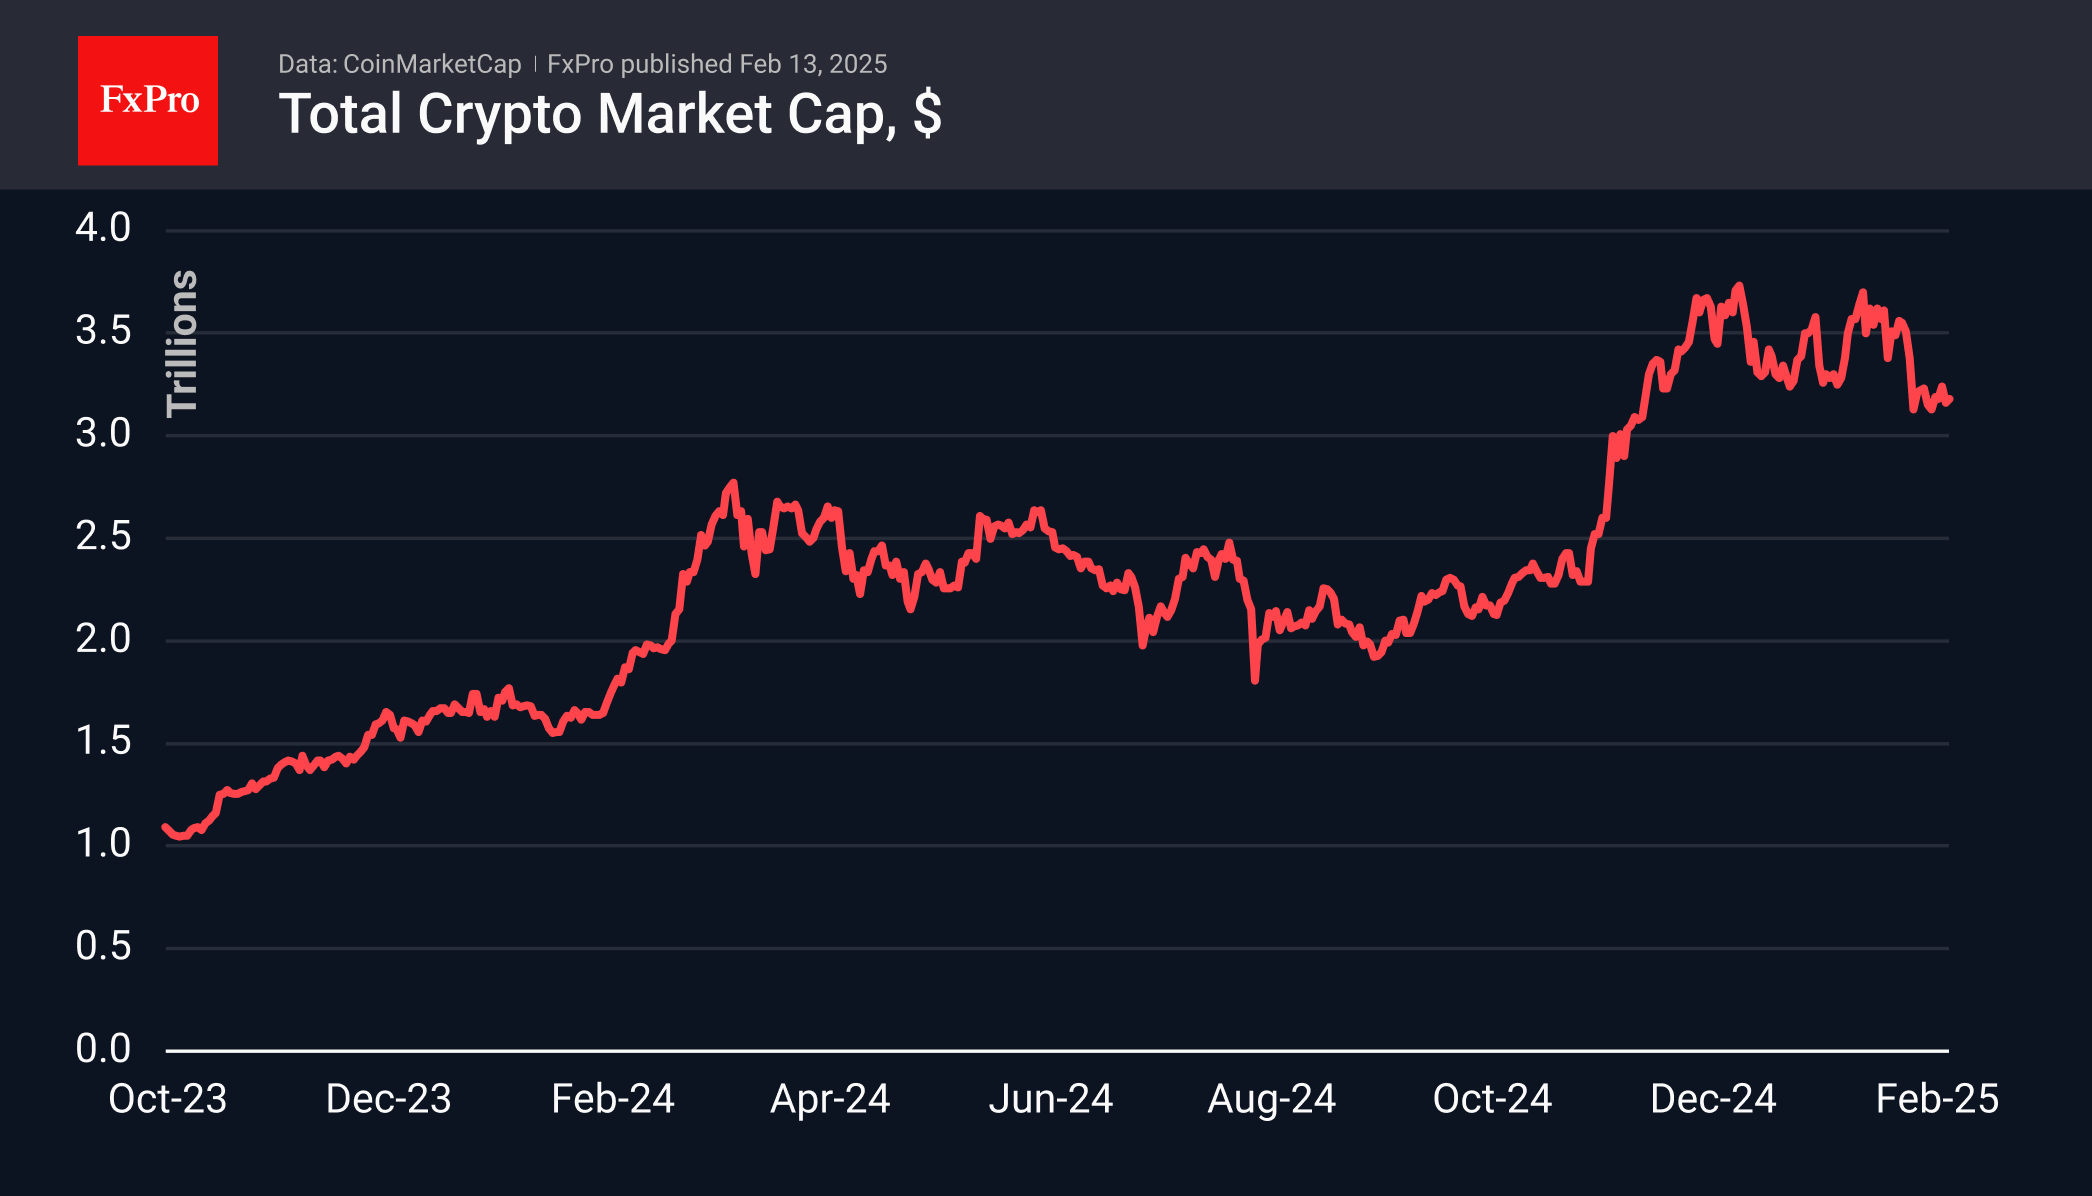
The cryptocurrency market has been stabilising at a lower level since early February. The $3.3 trillion capitalisation mark is acting as resistance, causing the market to reverse downwards quite swiftly. In December, this level served as support.
The Cryptocurrency Fear and Greed Index has risen to 50, trying to push off the local bottom.
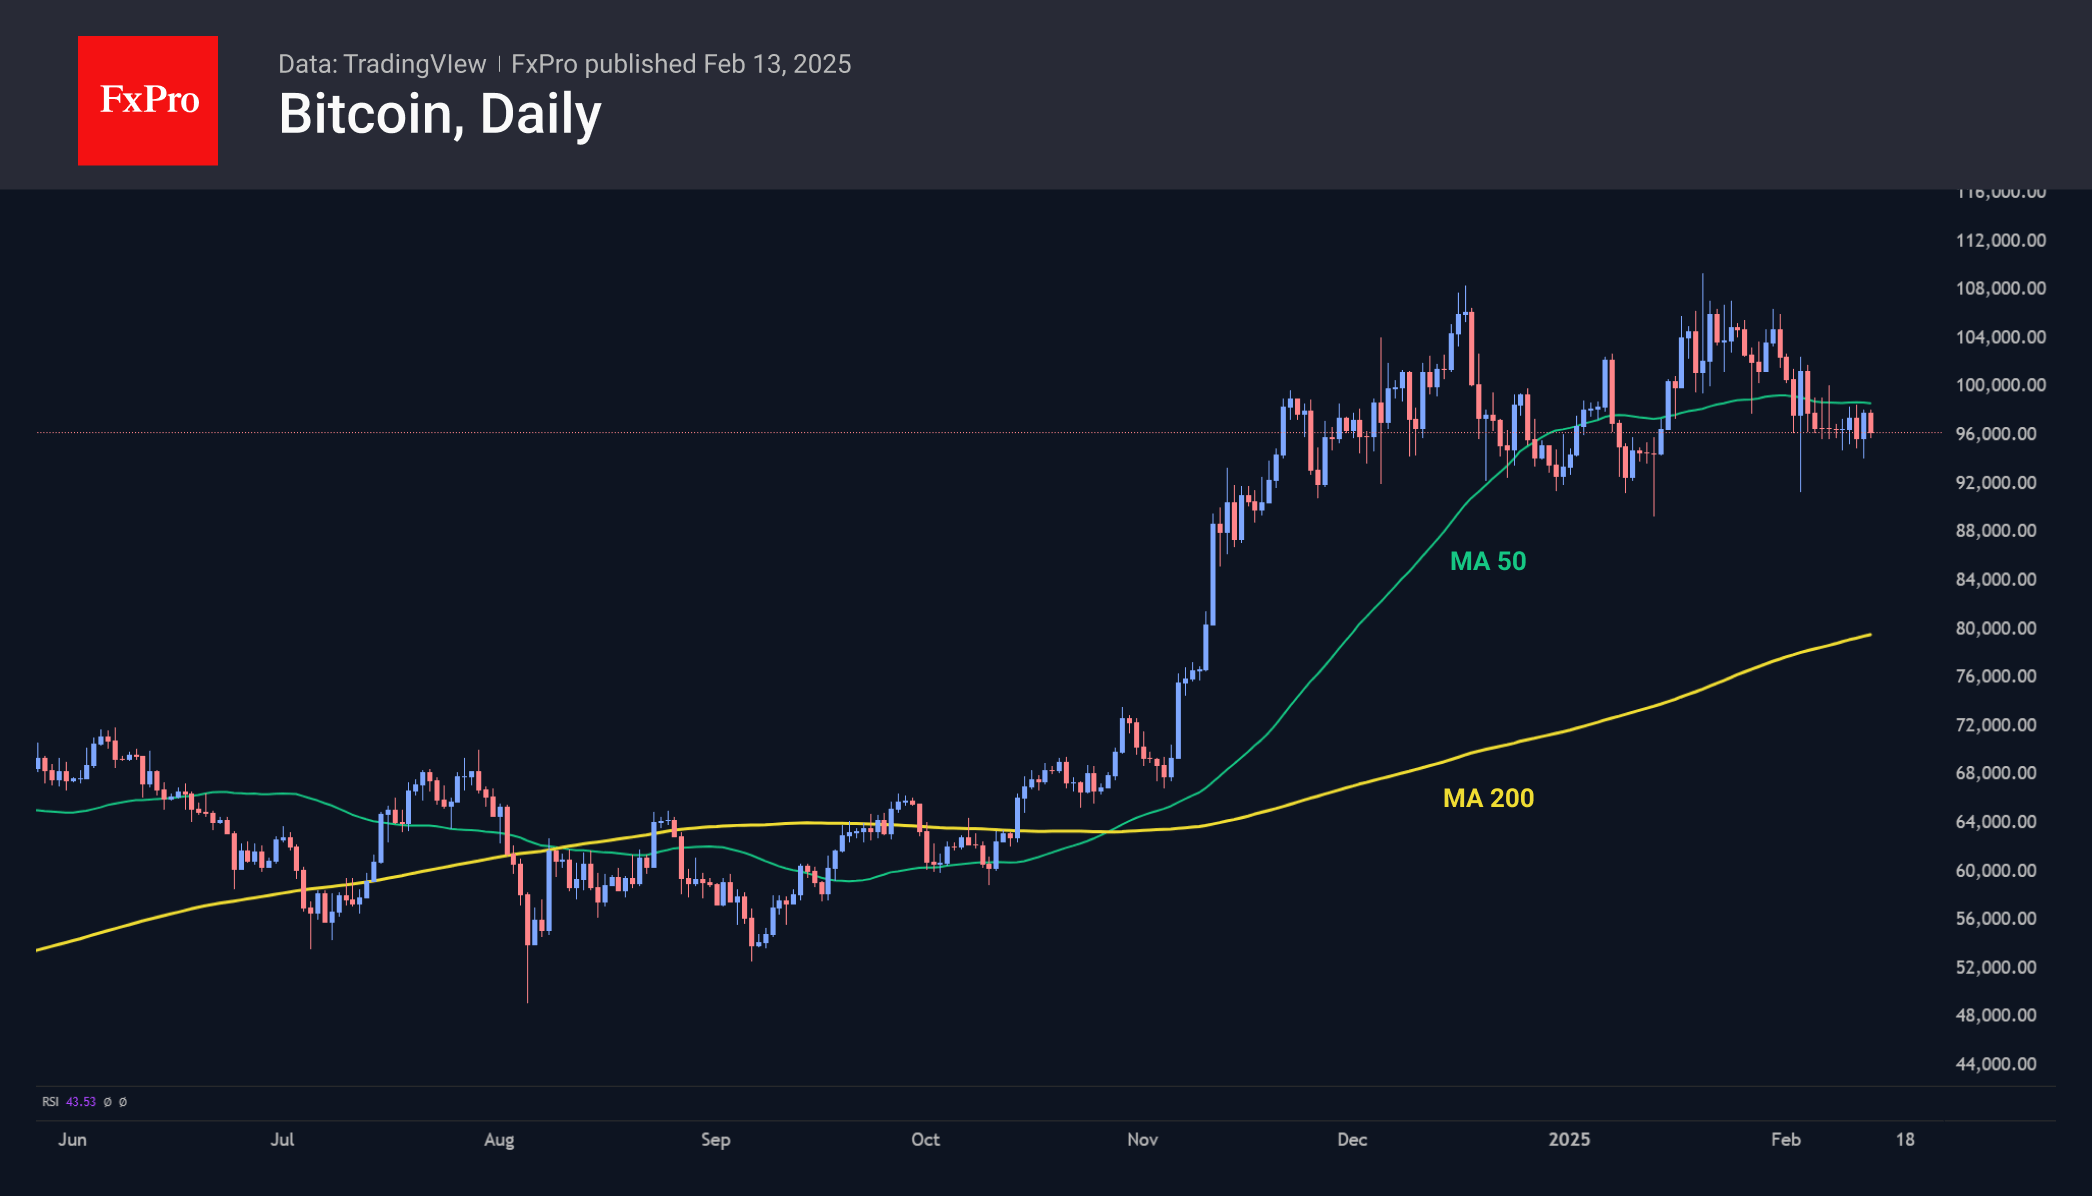
Bitcoin is trading near 96,000, with the 50-day moving average acting as impenetrable resistance, halting growth since early February. Technically, this signals a deeper correction pattern, potentially extending down to 93,000. However, the prolonged consolidation remains a cause for concern.
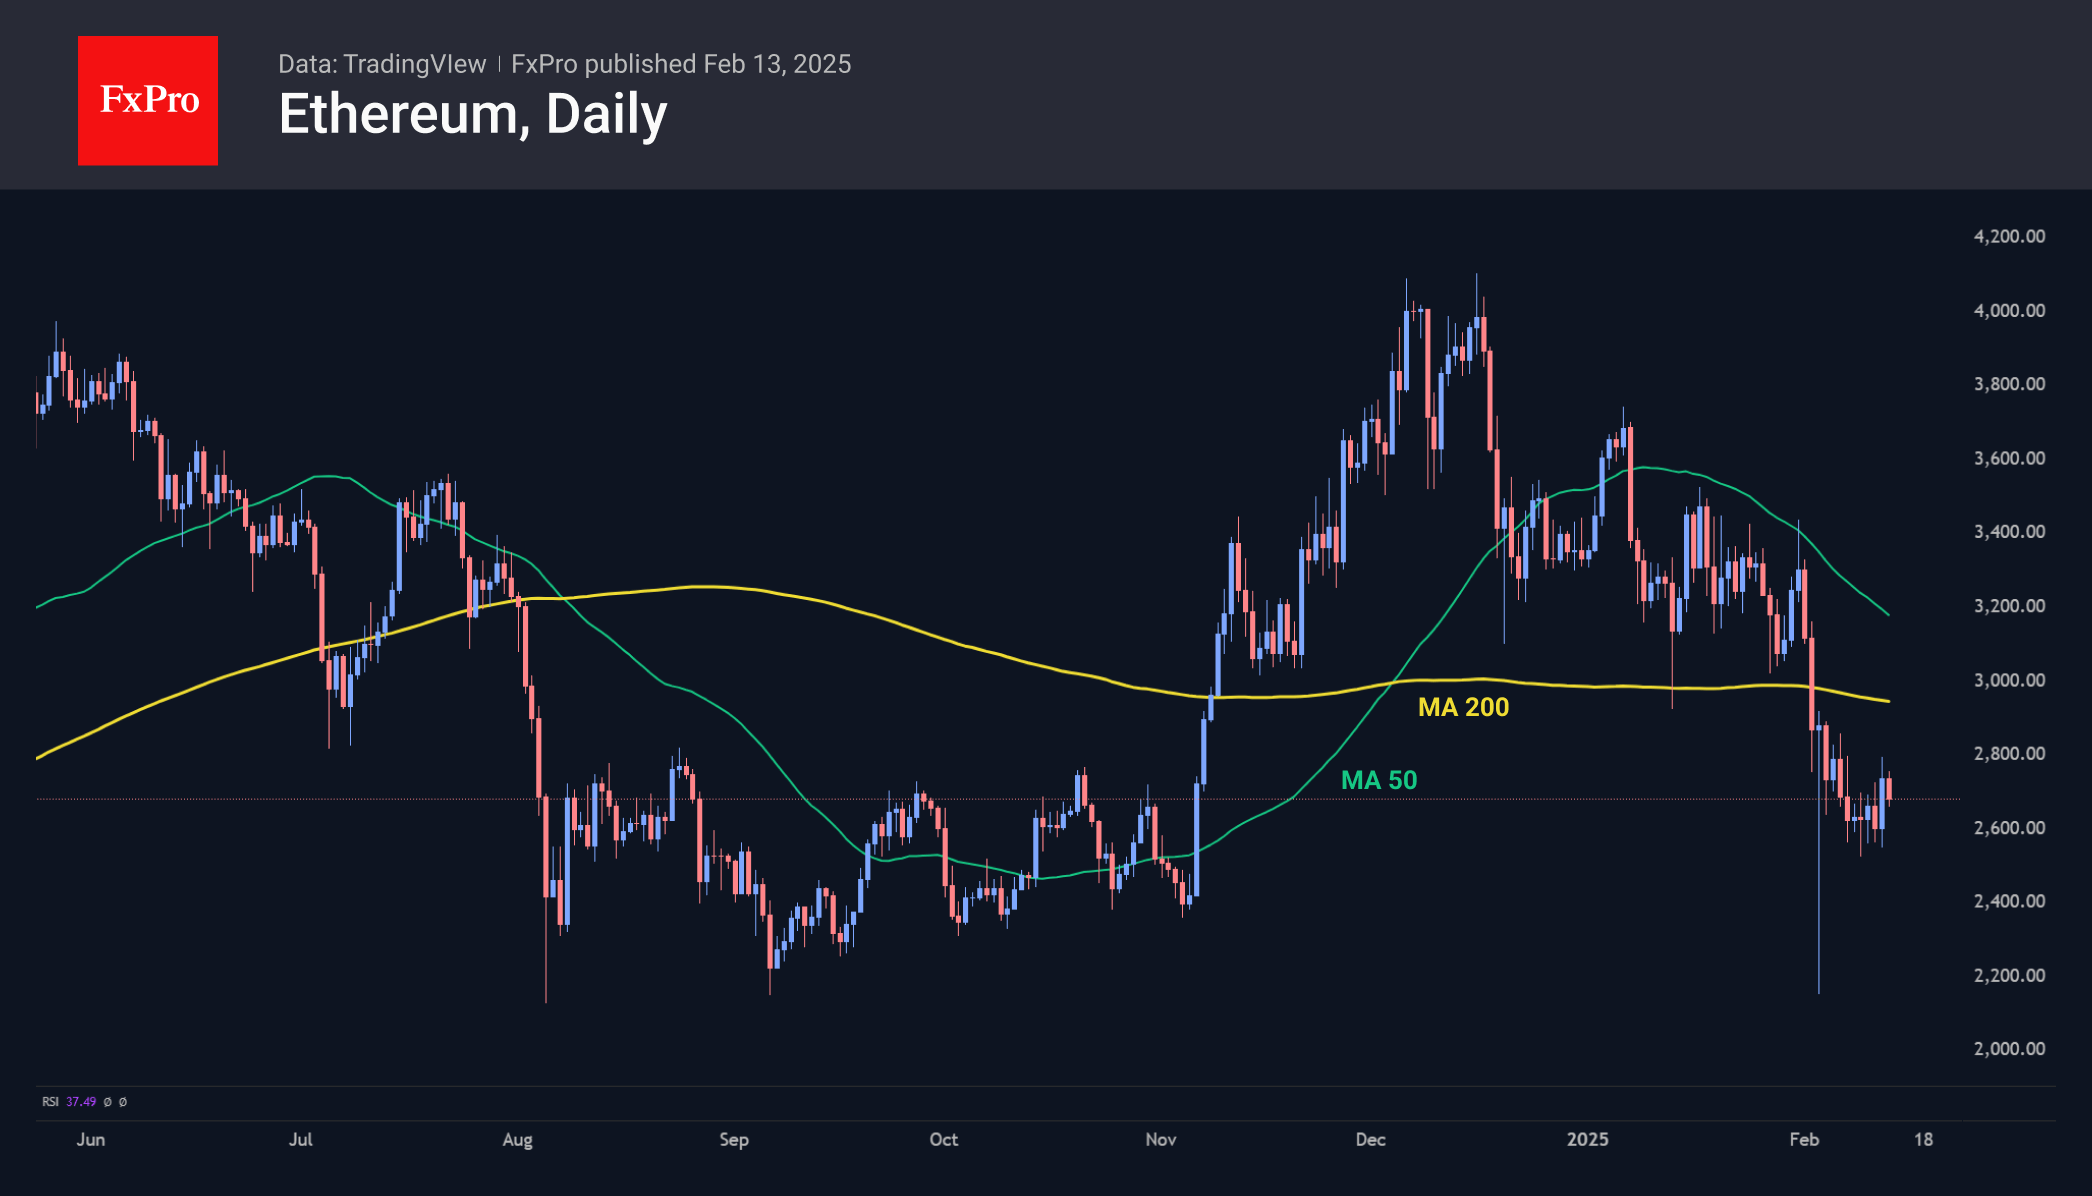
Ethereum is trading the area from $2,500-2,700 after a more than 20% failure in early February. The major altcoin is trading below its 50- and 200-day moving averages, with things heading for a death cross when the fast average dips below the long average. The impressive inflows into ETFs have so far failed to turn the coin’s momentum around. Deep declines are being bought out, but it is not possible to confidently move to growth, as crypto enthusiasts have other favourites in this market cycle.
News Background
The Hash Ribbons indicator, which evaluates the state of the Bitcoin mining ecosystem, has signalled miner capitulation. According to CryptoQuant, this is expected to drive short-term growth for the leading cryptocurrency.
Altcoins did not react to Fed Chairman Jerome Powell’s statements about the lack of rush to adjust rates. Some experts saw this as a sign that the sector had passed the bottom.
Despite Bitcoin’s sharp correction early last week, the bulls remain largely in control. For altcoins, however, the price collapse was likely a bear market event, according to Glassnode. Altcoins have suffered one of the steepest declines in history, with their capitalisation dropping by $234 billion over the past two weeks.
Solana, not Ethereum, will prove to be the winner of the ‘tokenisation race’, said Anthony Scaramucci, founder of SkyBridge Capital. He justified his opinion by the lower fees and faster transactions in Solana.
Eurozone industrial production falls -1.1% mom in Dec, EU down -0.8% mom
Eurozone industrial production fell by -1.1% mom in December, significantly worse than the market expectation of -0.6% mom. The decline was driven by sharp contractions in intermediate and capital goods, while non-durable consumer goods provided some offset.
Breaking down the data, intermediate goods production declined by -1.9% mom. The production of capital goods fell even further, down -2.6% mom. Durable consumer goods also posted a modest decline of -0.7% mom. On the other hand, energy production rose by 0.5% mom, and non-durable consumer goods surged by 5.1% mom.
At the broader EU level, industrial production contracted by -0.8% mom, with Belgium (-6.8%), Portugal (-4.4%), and Austria (-3.3%) suffering the steepest declines. Meanwhile, Ireland (+8.2%), Luxembourg (+6.7%), and Croatia (+6.3%) posted strong rebounds.
Gold Surges as Three Key Factors Drive Prices Higher
Gold prices soared to 2,918 USD per troy ounce by Thursday, 13 February, marking an all-time high above 2,900 USD. The rally in Gold remains strong, with the potential for further price increases.
Key drivers behind Gold’s surge
At least three major factors are supporting Gold's rapid ascent:
- Geopolitical tensions – The ongoing deterioration in US-China relations, mainly due to the imposition of trade tariffs on Chinese imports, has heightened demand for safe-haven assets like Gold.
- Global monetary policy expectations – Investors anticipate that the US Federal Reserve will cut interest rates, which weakens the US dollar and makes Gold more attractive as an alternative investment.
- Central bank demand – Many global central banks, including China’s, are actively increasing their Gold reserves, providing strong demand support for the metal.
The ongoing weakness in the USD has further amplified Gold’s bullish momentum.
Technical analysis of XAU/USD
On the H4 chart, XAU/USD found support at 2,865 USD and extended its growth wave to 2,909 USD. The market is now likely to consolidate around this level. A downward breakout from this range could trigger a corrective move back to 2,865 USD. However, if the price breaks upward, the growth wave could extend to 2,920 USD, with further potential to 2,960 USD. The MACD indicator confirms this scenario, with its signal line above zero and pointing sharply upwards, indicating strong bullish momentum.
On the H1 chart, XAU/USD corrected to 2,865 USD before finding support and forming a new uptrend towards 2,909 USD. The price is now consolidating around this level. The next target will be 2,920 USD if it breaks upwards, followed by a potential extension to 2,960 USD. A short-term decline to 2,909 USD is possible before another upward move. The Stochastic oscillator supports this view, with its signal line above 80, preparing for a minor correction towards 50 before the next leg higher.
Conclusion
Gold continues to benefit from geopolitical tensions, Fed rate cut expectations, and strong central bank demand. While minor pullbacks may occur, the overall trend remains bullish, with key upside targets at 2,920 USD and 2,960 USD. Investors will closely watch further developments in US-China trade relations and any signals from the Federal Reserve regarding monetary policy, as these will shape the next major move in Gold prices.
Germany DAX Technical: Bullish Acceleration Towards Fresh All-Time Highs
- The current bullish trend in the German stock market is supported by positive momentum, market breadth & intermarket dynamics.
- The DAX and Hang Seng Index (HSI) have a high direct correlation where a further bullish move in HSI may trigger a positive feedback loop into the DAX.
- Watch the 21,100 key medium-term pivotal support on the DAX.
The latest key economic data for January such as manufacturing PMI and consumer confidence in the Eurozone and Germany, one of the anchor European economies are not rosy as they highlighted an increased risk of an impending recession in the Eurozone.
Also, these leading Eurozone economic indicators have yet to indicate any clear recovery from an economic slowdown in the past year where external factors such as impending trade tariffs on European manufactured motor vehicles from US President Trump may torpedo the Eurozone into a recession next year.
In contrast, the German stock market has ignored such fears. It has continued to march higher since November 2024 as the Germany DAX scales new fresh all-time highs and is on track to record its fourth consecutive positive monthly gain in February.
Outperformance of the Germany stock market
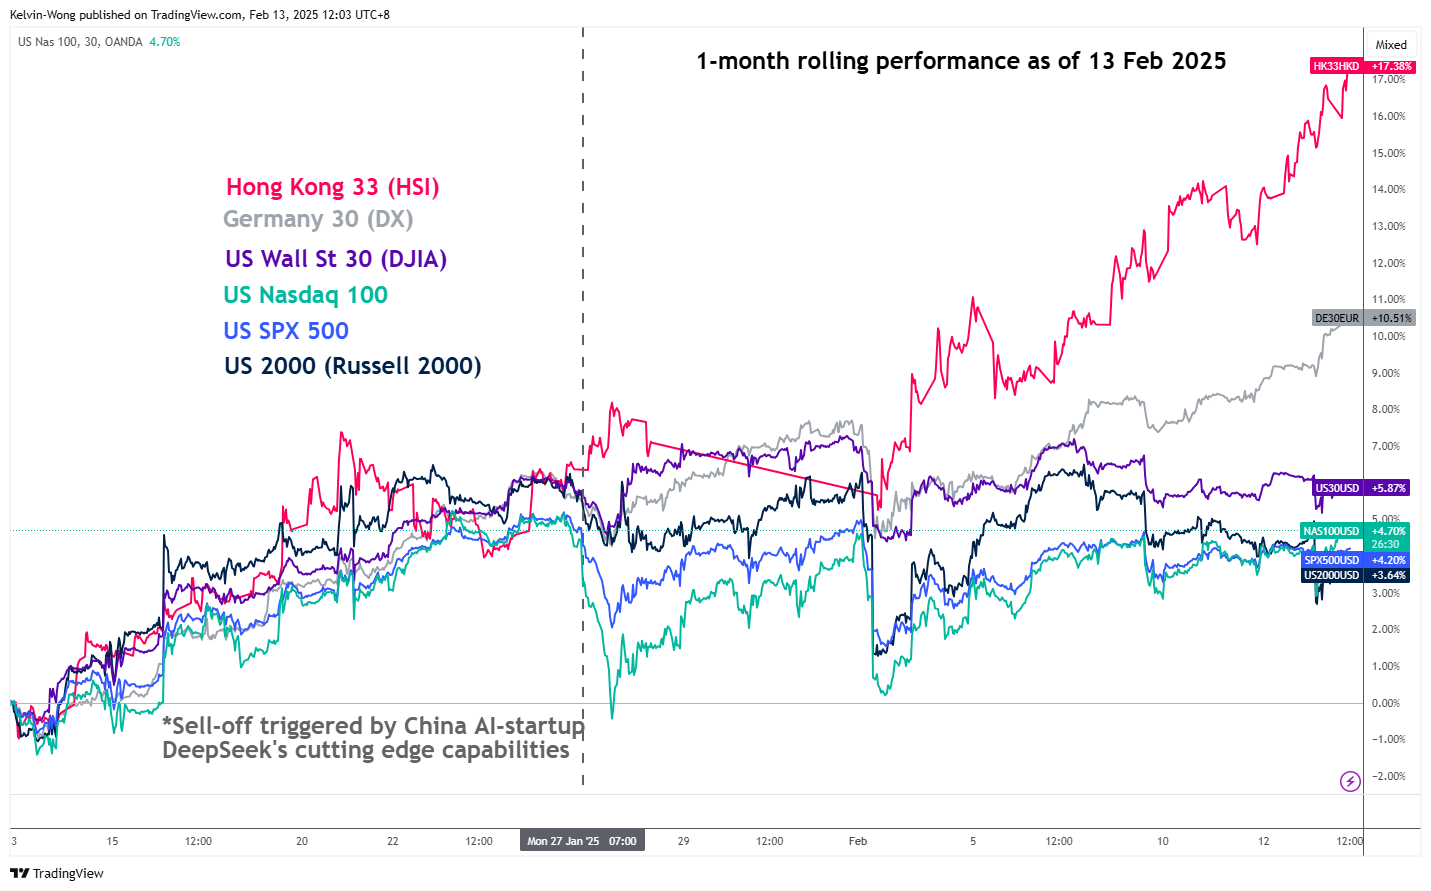
Fig 1: 1-month rolling performances of Germany 30 & US CFD stock indices as of 13 Feb 2025 (Source: TradingView, click to enlarge chart)
Interestingly, the Germany DAX and Hang Seng stock indices (a proxy for international investors and traders to get exposure to China equities) have tracked closely to one another and outperformed the major US stock indices on a one-month rolling basis at this time of the writing according to the prices of contract for difference (CFD) stock indices on these markets offered by OANDA.
Based on a one-month rolling performance basis, the Germany 30 CFD stock index (a representation of the DAX) has recorded a gain of 10.50%, almost two times more than the average return of 4.6% seen on major US CFD stock indices such as US Nasdaq100 and US SPX 500 (see Fig 1).
Improving market breadth
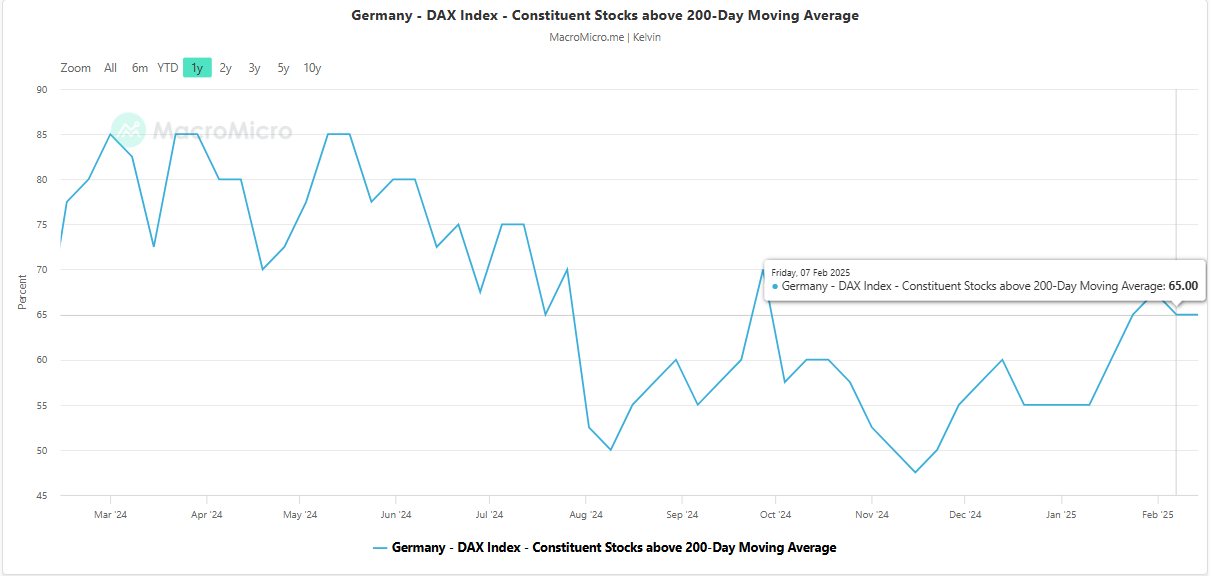
Fig 2: Percentage of DAX component stocks above 200-day moving average as of 7 Feb 2025 (Source: MacroMicro, click to enlarge chart)
The percentage number of DAX component stocks trading above their respective 200-day moving averages has increased significantly from 47% in mid-November 2024 to 65% as of 7 February 2025 (see Fig 2).
These observations suggest that market breadth has improved to increase the odds of a continuation of the ongoing medium-term uptrend phase of the DAX.
Bullish acceleration in DAX
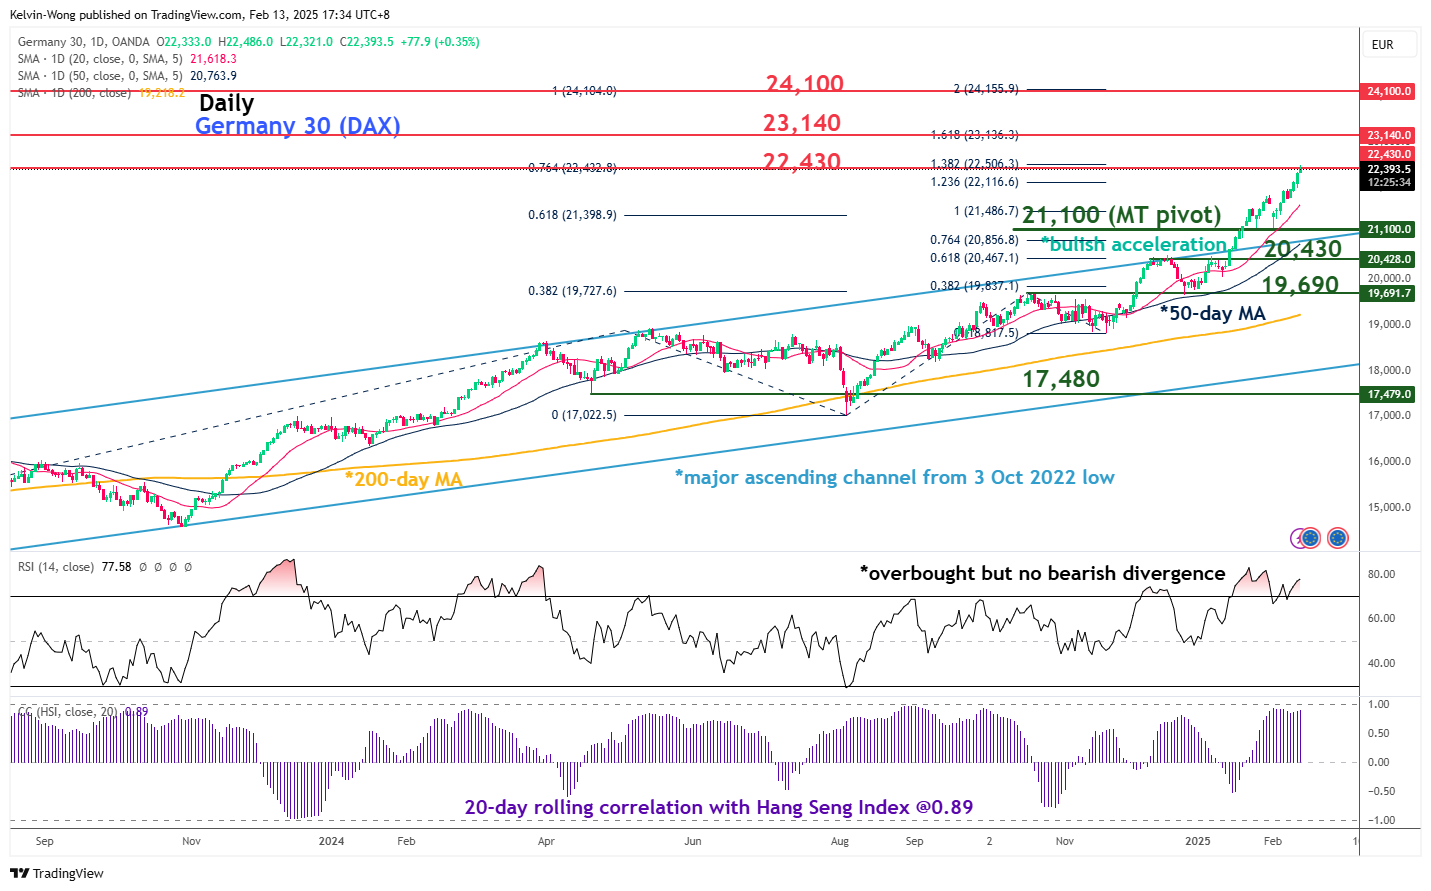
Fig 3: Medium-term trend of Germany 30 CFD stock index as of 13 Feb 2025 (Source: TradingView, click to enlarge chart)
The price actions of the Germany 30 CFD stock index (a representation of the DAX) staged a breakout above the upper boundary of a major ascending channel on 17 January.
Thereafter, it continued to trade above its 20-day moving average without any bearish divergence conditions currently on its overbought daily RSI momentum indicator (see Fig 3).
In addition, the Germany 30 CFD stock index has a high positive correlation (20-day rolling correlation coefficient at 0.87) with the Hang Seng Index (a proxy of China’s stock market).
The Hang Seng Index may continue to see an extension of its impulsive bullish upmove sequence within an ongoing medium-term uptrend phase (click here for a recap of our recent analysis on the Hang Seng Index) which in turn may trigger a positive feedback loop back into the Germany 30 CFD stock index.
Watch the 21,100 key medium-term pivotal support to maintain the bullish bias for the next medium-term resistances to come in at 23,140 and 24,100.
However, a breakdown below 21,100 invalidates the bullish impulsive upmove sequence to kickstart a potential medium-term (multi-week) corrective decline to expose the next medium-term supports at 20,430 and 19,690.
Brent Crude Price Drops After Trump’s Call with Putin
According to the XBR/USD chart, the price of Brent crude oil fell by more than 2% in a single day. This decline followed an announcement by US President Trump that he had spoken with Russian President Putin, discussing various global issues, including the war in Ukraine.
As reported by Reuters, this has raised expectations that a potential peace agreement between Ukraine and Russia could involve lifting sanctions, which have disrupted global oil supply flows.
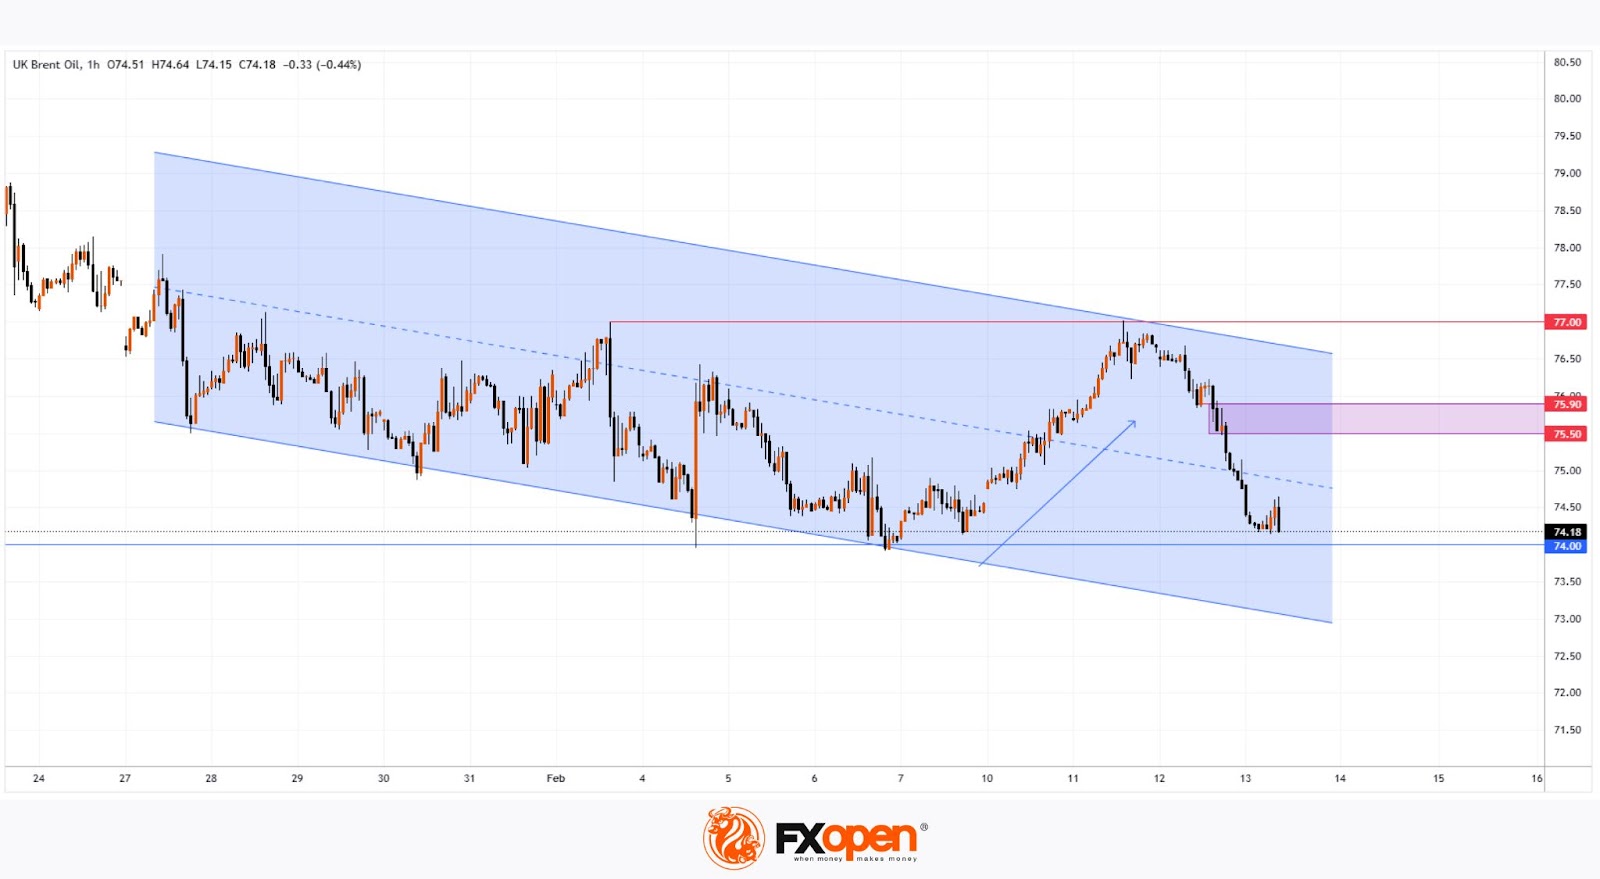
Technical Analysis of XBR/USD
On 7 February, we highlighted key support at $74. Since then, the price has risen (as indicated by the arrow) to $77, which has confirmed its role as resistance.
Brent crude price movements outline a descending channel (marked in blue), with:
→ Bullish perspective: The $74 level may still act as support.
→ Bearish perspective: The $75.50–$75.80 zone, where sellers have shown dominance, could challenge bulls attempting to push prices into the upper half of the channel.
Rising US oil inventories, the prospect of increased production under President Trump, and expectations of sanctions on Russia being lifted could all contribute to Brent crude revisiting its 2025 lows.
Start trading commodity CFDs with tight spreads. Open your trading account now or learn more about trading commodity CFDs with FXOpen.
This article represents the opinion of the Companies operating under the FXOpen brand only. It is not to be construed as an offer, solicitation, or recommendation with respect to products and services provided by the Companies operating under the FXOpen brand, nor is it to be considered financial advice.
Swiss inflation softens again as CPI slows to 0.4% in Jan
Switzerland’s CPI declined by -0.1% mom in January, in line with market expectations. Core CPI, which excludes fresh and seasonal products, energy, and fuel, also dropped by -0.1% mom. While domestic product prices ticked up by 0.1% mom, the steep -0.7% mom decline in imported product prices suggests that external factors continue to exert deflationary pressure on the Swiss economy.
On a year-over-year basis, headline inflation eased from 0.6% yoy to 0.4% yoy, also matching expectations. However, core CPI edged higher to 0.9% yoy from 0.7% yoy. Domestic product inflation slowed from 1.5% yoy to 1.0% yoy, reflecting weaker demand and subdued price pressures in the local economy. Meanwhile, imported product prices remained in deflationary territory, improving slightly from -2.2% yoy to -1.5% yoy.
Market Focus Shifting from Risk of Tariffs to Positives from End to War in Ukraine
Markets
‘Great progress’, ‘We’re close but not there on inflation’, ‘We don’t get excited about one or two good readings, and we don’t get excited about one or two bad readings.’ These are some semi-live comments from Fed Chair Powell at its second day hearing before Congress in the wake of blow-out US January inflation figures, published less than two hours earlier. Anyway, in those figures, the progress on inflation was well masked. US January headline inflation jumped 0.5% M/M (from 0.4% and 0.3% expected) rising the Y/Y measure to 3.0% (from 2.9%). Similar story for core CPI inflation at 0.4% M/M (from 0.2%) with the Y/Y measure reaccelerating to 3.3% from 3.2%. Food (0.4% M/M) and energy prices (1.1%) both also services inflation (0.5% M/M and 4.3% Y/Y) don’t suggested a that a swift return toward 2.0% was gaining momentum. Idem for shelter prices (0.4% M/M, 4.4%). The market reaction was straight forward. US yields closed between 7.2 (2-y) and 9.8 bps (5-y) higher. US markets now only see a next 25 bps Fed rate cut fully discounted in the final quarter of the year. The fact that the biggest yield rise occurred at the belly of the curve suggests that markets feel that even in a scenario of persistent inflation, the (political) bar remains high of the Fed to resume raising rates. Markets for now only consider a higher-for-(much)-longer scenario. Still, US yields closed off the intraday peak levels. A decline in the oil price (Trump suggesting upcoming Ukraine peace talks) capped a rise in inflation expectations. Even so, the US 10-y $42 bln Note sale, despite the higher yield, only attracted mediocre investors interest. German yields in sympathy gained between 5.3 bps (2-y) and 3.3 bps (30-y). US equities opened about 1.0% lower on tighter interest rate conditions post the CPI release, but easily reversed most of the initial loss. Dollar gains were limited and short-lived except for USD/JPY (close 154.4 from 152.5). Especially the euro showed remarkable resilience. Interest-driven USD strength, if any, was counterbalanced by the prospect that an end to the war in Ukraine might be on the horizon after Trump’s phone call with Putin kickstarted the process.
Asian equity markets this morning mostly show solid gains. The market focus is shifting from the risk of US tariffs to the potential positives from an end to the war in Ukraine. This evidently applies to European markets. EUR/USD this morning jumps to currently trade near 1.043. This theme probably also will set the tone on European markets later today. Aside from the Ukraine risk-on , the eco calendar contains the US PPI and jobless claims data. They probably won’t amend the higher-for-longer message from yesterday’s US CPI. The US 2-y yield is close to the key 4.40% resistance area. However, for a break the market probably has to reconsider Fed rate hikes. We’re not that far yet. In FX, the euro is gaining traction. A break beyond 1.0442 would open the way to the 1.0533/1.0630 previous correction highs. UK Q4 GDP at 0.1% Q/Q reported this morning was less worse than expected, but the details (poor private consumption and investments) confirms an ongoing uphill battle for the UK economy. Sterling gains modestly (EUR/GBP 0.834).
News & Views
The European Commission yesterday confirmed that it will cut the settlement cycle for stock, bond and fund trades from two days to one. Single-day securities settlement will begin on October 11 2027, aligning the switch with those in the UK and Switzerland. The move will bring a significant reduction in margin requirements for market participants and would also unlock important benefits, notably by achieving risk reduction, margin savings and the reduction of costs linked to misalignment with other major jurisdictions. The US shortened its settlement time in May of last year with countries like Canada, Mexico, India and China also already on the T+1 scheme.
News agency Bloomberg runs an article citing at least six EU member states who would be pushing the EC to allow more flexibility on refilling requirements for gas storage ahead of next winter. The Gas Coordination Group meets today. Targets are currently designed to ensure that inventories are 90% full by November 1st, but current levels (48% full on average) are relatively low because of cold weather, low wind generation and loss of Russian supplies. There is concern that overly strict targets are at least partly responsible for the surge in gas prices to the highest level in two years’ time.
UK GDP surprises to the upside, services lead the growth
The UK economy outperformed expectations in December, with GDP expanding by 0.4% mom, significantly stronger than the 0.1% growth forecast. The services sector led the way, posting 0.4% monthly growth, while production output also rebounded, rising by 0.5%. However, the construction sector remained weak, contracting -0.2% mom.
For Q4 as a whole, GDP increased by 0.1% qoq, defying expectations for a -0.1% contraction. Services grew by 0.2% in Q4, maintaining its position as the primary growth driver, while construction saw a moderate expansion of 0.5%. However, industrial production was a notable drag, shrinking by -0.8%.
For full-year 2024, GDP increased by 0.8% compared to 2023, a modest but better-than-feared outcome given the economic uncertainties. Services expanded by 1.3%, cushioning the economy, while production sector contracted by -1.7%, and construction grew slightly by 0.4%.
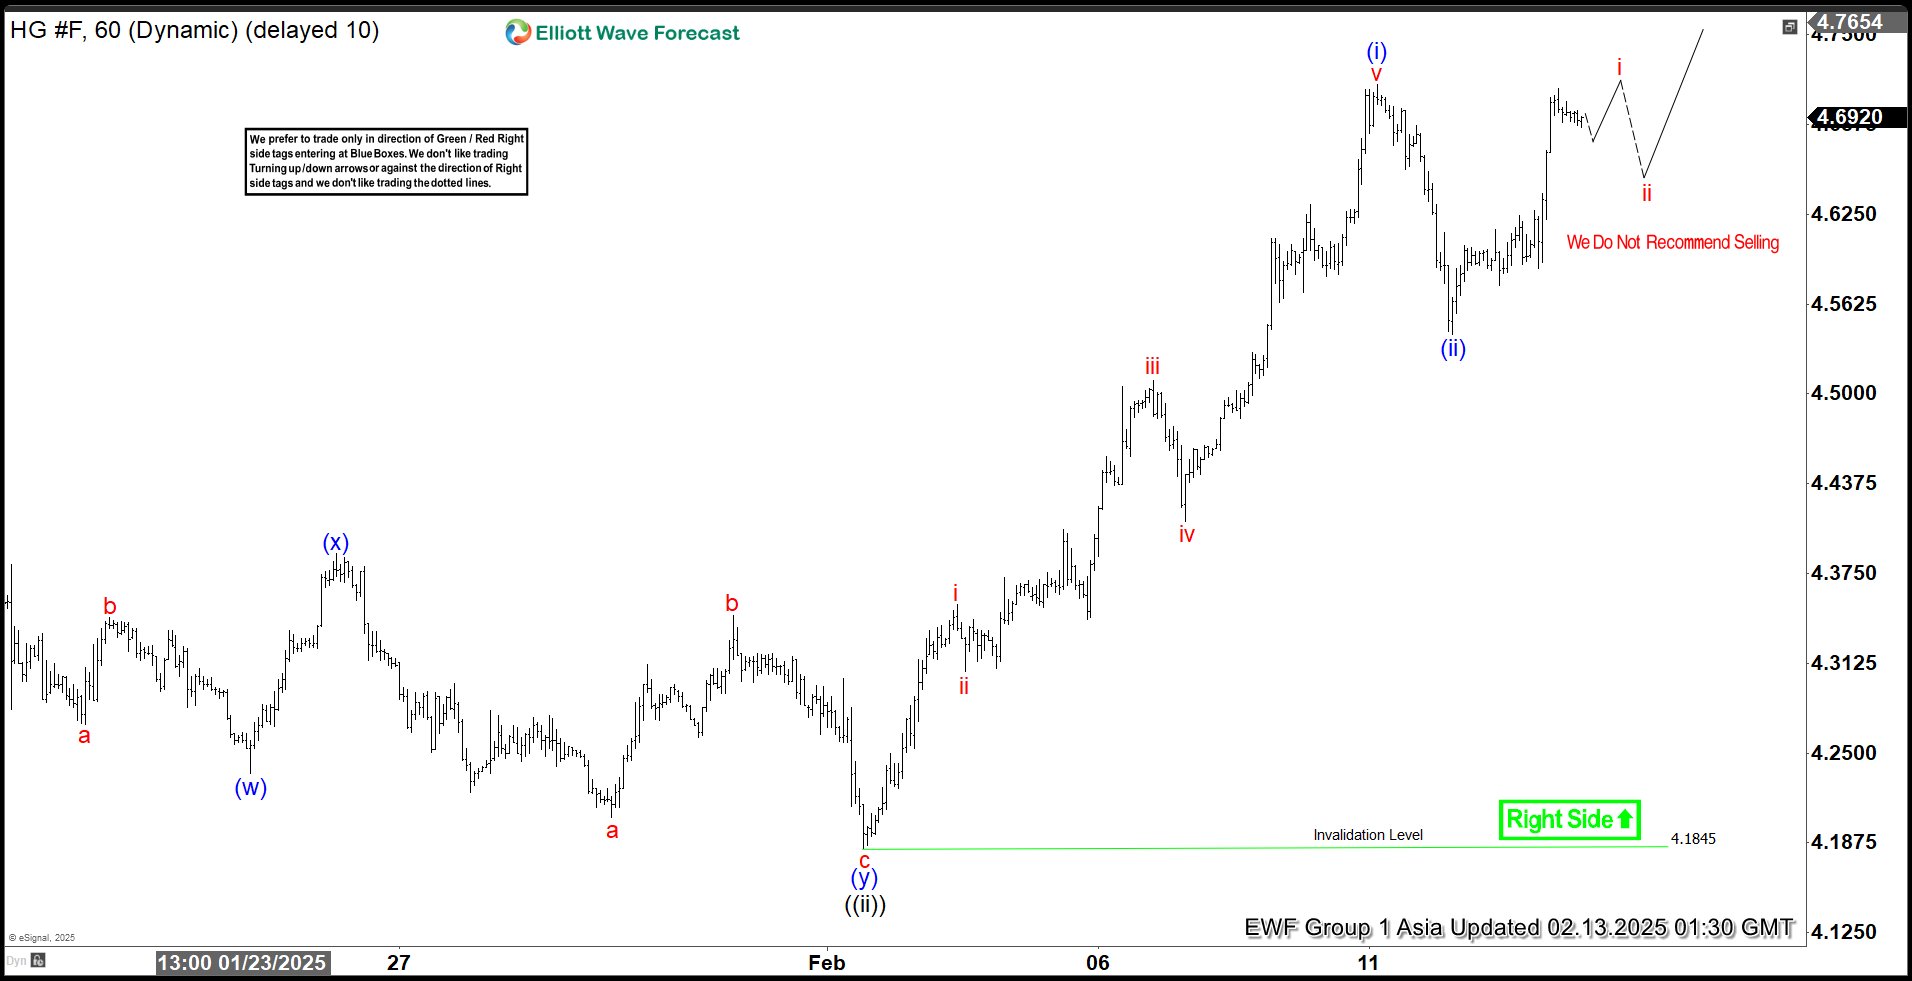
Elliott Wave View: 5 Swing Sequence in Copper (HG) Favors Higher
Short term Elliott Wave in Copper shows 5 swing sequence from 11.14.2024 low, favoring more upside. Up from 11.14.2024 low, wave 1 ended at 4.335 and pullback in wave 2 ended at 4.005. The metal has resumed higher in wave 3. Up from wave 2, wave ((i)) ended at 4.47 and pullback in wave ((ii)) ended at 4.1835. Internal subdivision of wave ((ii)) unfolded as a double three Elliott Wave structure. Down from wave ((i)), wave (w) ended at 4.235, wave (x) ended at 4.389, and wave (y) lower ended at 4.184 which completed wave ((ii)) in higher degree.
The metal has resumed higher in wave ((iii)). Up from wave ((ii)), wave i ended at 4.3535 and pullback in wave ii ended at 4.3065. Wave iii higher ended at 4.5095 and pullback in wave iv ended at 4.411. Wave v higher ended at 4.715 which completed wave (i) in higher degree. Pullback in wave (ii) ended at 4.541. Pair has resumed higher in wave (iii). Near term, as far as pivot at 4.1845 low stays intact, expect dips to find buyers in 3, 7, or 11 swing for further upside.
Copper (HG) 60 Minutes Elliott Wave Chart
Copper (HG) Video
https://www.youtube.com/watch?v=KqR5bBJjoLY
Too Sticky to Cut
Uh oh... Yesterday’s inflation update from the US didn’t go well. January data showed a hotter-than-expected report across monthly and annual readings and all categories including food, energy and housing. In numbers, the US headline inflation accelerated to 3%, instead of decelerating to the Federal Reserve’s (Fed) 2% target. Core inflation – the one that excludes food and energy and that matters more to the Fed under the pretext of being less volatile – ticked up to 3.3%, and Fed Chair Jerome Powell said in the second day of his semiannual testimony – and following the CPI release – that they ‘were close but not there on inflation’. ‘Close’? Not so much: inflation sticks around the 3% mark since summer, and will hardly point its nose to the 2% target with Trump’s tax cuts and tariffs.
PS: US federal budget gap widened to a record for the first third of the fiscal year, and the cumulative deficit for October through January widened 25% (Bloomberg).
As such, the Fed rate cut expectations melted like snow under the sun after yesterday’s clear uptick in US inflation suggested that the Fed would better wait and see before doing anything else. The US 2-year yield – that best captures the Fed expectations – jumped almost 10bp yesterday and the US 10-year yield – which will serve to control the borrowing costs under the new treasurer Bessent jumped around 12bp. Activity on Fed funds futures suggests that the Fed is not ready to announce its next rate cut before the September meeting – gradually kicked down the road from May at the start of the year. And worse, swap traders don’t expect the Fed to cut the rates before December – and hence cut just one more time this year, if it cuts at all. The Fed’s next move could be a rate hike – instead. It all depends on how Trump’s tariffs will hit back the US consumer.
Gold gained despite the rising US yields and the historically negative relationship between US yields and gold prices is no longer a thing – given that big buyers including central banks – flee the US debt and replace it with gold. As such, yes, I think that hitting the $3000 per ounce level in gold could trigger some profit taking and a tactical short opportunity, but the medium to long-term outlook for gold remains positive. If Bitcoin could rally to $100K, gold could well continue its journey toward – I don’t know - $4000 per ounce?!
In the FX, the US dollar didn’t rise on the back of rising hawkish Fed expectations and rising yields. But the greenback is swiftly offered in the Asian session – maybe due to some relief on hopes of an eventual—if imperfect—resolution in Ukraine. Crude prices plunged 2.70% below the 100-DMA yesterday and are extending losses toward the $70pb psychological support this morning. Potentially waning geopolitical risks on the Russian front, the melting Fed cut expectations and the tariff unknown gather dark clouds over the global economic outlook and could encourage a dive in US crude prices below that level and pressure the price of a barrel of Brent crude toward the $70pb level, as well.
Elsewhere, the dollar’s weakness despite the hot CPI read encourages other currencies to recover some of the latest losses. The EURUSD for example jumped past the 50-DMA and is preparing to test a minor Fibonacci resistance. But the medium-term outlook for the EURUSD remains bearish below the 1.06 mark, and macro traders are probably looking for interesting top selling opportunities on the back of diverging Fed and European Central Bank (ECB) policy outlooks. Today, the US PPI and weekly jobs figures could give reason to the USD bulls to pile back in.
In equities, the S&P500 sure kicked off yesterday’s session on a negative note but the index recovered losses throughout the session and ended the day with a meagre 0.27% slide, while Nasdaq 100 managed to eke out a 0.12% advance. The rally in US equities somehow slowed by underwhelming earnings from the Magnificent 7 companies, but the rest of the index is doing pretty well. Around three quarters of the companies in the S&P500 already reported their earnings and the earnings per share grew 12.5% in Q4 compared to a 7% rise expected into this earnings season. But the earnings beat resulted in a meagre average performance of -0.1%. What does that mean? It means that the rotation trade won’t be enough to offset a potential fallout if - God forbid - the Big Tech companies were to fall from grace.