Sample Category Title
EUR/USD Elliott Wave Analysis
EUR/USD – 1.1798
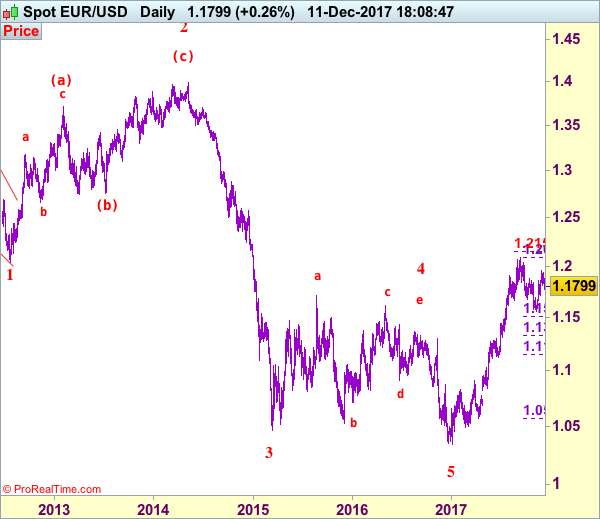
EUR/USD: Wave (c) of 2 ended at 1.3993 and wave 3 of III has commenced for weakness to 1.0411 (1.236 of wave 1), then 1.0000.
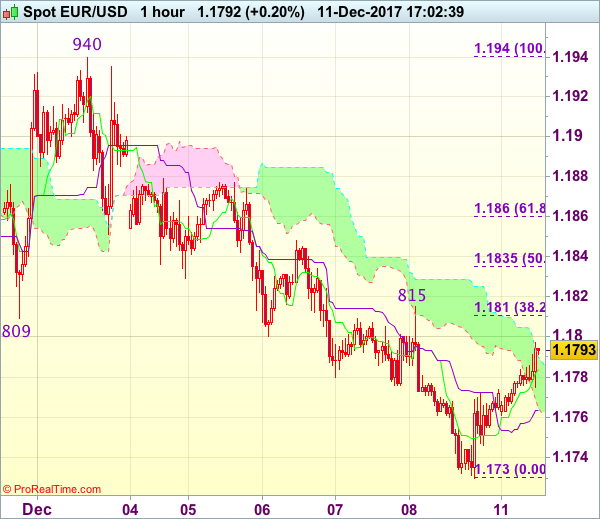
The single currency dropped last week on dollar’s broad-based rebound and the pair fell to as low as 1.1730 late last week, suggesting top has possibly been formed at 1.1961, hence consolidation below this level would be seen and below said support at 1.1730 would bring test of support at 1.1713, a break there would suggest the rebound from 1.1554 has ended at 1.1961, bring further fall to 1.1660-65, then towards 1.1620-25 but said support at 1.1554 should remain intact. .
Our preferred count on the daily chart remains that a wave (II) from 1.2329 ended at 1.5145 with A-leg ended at 1.4720, followed by wave B at 1.2457, the wave C from there was also a 3 legged move and is labeled as (a): 1.3739, (b): 1.2885, the wave iii of the 5-waver (c) from 1.2885 has ended at 1.4339 and wave iv is a triangle ended at 1.3878 and wave v formed a top at 1.5145. The decline from there is a 5-waver (C) with minor wave (i) of I of (C) ended at 1.4218 with wave (ii) ended at 1.4580, wave (iii) ended at 1.3267 and wave (iv) ended at 1.3692 and wave (v) ended at 1.1876, this is also the low of wave I of (C) and wave II ended at 1.4940, hence wave III is now in progress with a diagonal wave 1 ended at 1.2042, the breach of previous support at 1.1876 (wave I trough) adds credence to our view that the wave 2 has ended at 1.3993, wave 3 has commenced for further weakness to 1.0411, then towards 1.0000.
On the upside, whilst initial recovery to 1.1845-50 cannot be ruled out, reckon upside would be limited to 1.1875-80 and bring another decline later. Only above 1.1940 would revive bullishness and signal the retreat from 1.1961 has ended, bring retest of said resistance, break there would extend the rise from 1.1554 to 1.2000. Looking ahead, only a break above resistance at 1.2035 would retain bullishness and signal early upmove has resumed for retest of 1.2093 first. A break of this resistance would confirm resumption of recent upmove from 1.0340 low for headway to 1.2150-55 (61.8% projection of 1.1119-1.1910 measuring from 1.1662), then 1.2200-10
Recommendation: Stand aside for this week.
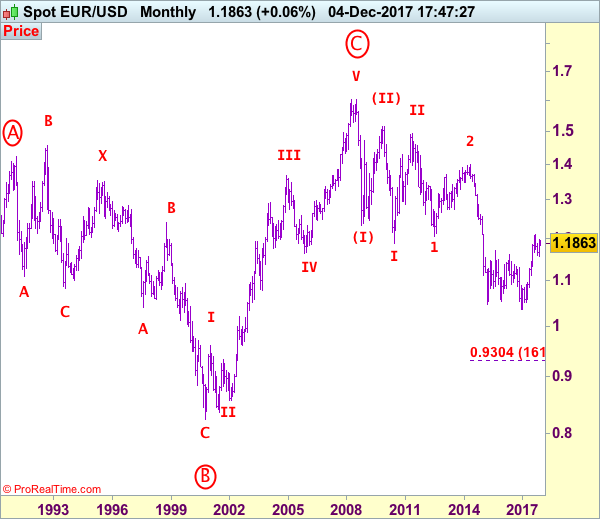
Euro's long-term uptrend started from 0.8228 (26 Oct 2000) with an impulsive structure. The rise from 0.8228 to 0.9593 (5 Jan 2001) is labeled as wave I, the retreat to 0.8352 (6 Jul 2001) is wave II and the rally to 1.3670 (31 Dec 2004) is wave III. Wave IV from there ended at 1.1640 (15 Nov 2005), the subsequent upmove to 1.6040 (July 15, 2008) is treated as wave V, the major selloff from the record high of 1.6040 to 1.2329 (October 27, 2008) signals a reversal has taken place with (I) leg ended at 1.2329 and once (II) ended at 1.5145, wave (III) itself is an extended move with I: 1.1876 and complex wave II ended at 1.4902, wave III has commenced with wave 1 and 2 ended at 1.2042 and 1.3993 respectively, wave 3 of III is now unfolding for weakness towards parity.
EUR/USD: US Non-Farm Employment Change
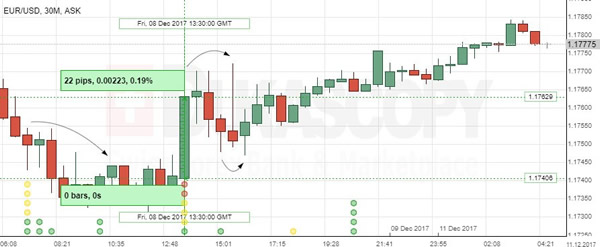
The Greenback weakened against the European single currency on the US data on Friday pointing to the healthy economic conditions. The EUR/USD jumped 22 base points to the 1.1760 mark, where the bullish sentiment was sustained, putting the pair higher to the 1.1780 level.
The US employment grew at a strong pace in November, confirming the country’s healthy economic state, which analysts see not requiring the Donald Trumps’ proposed fiscal stimulus, even with the moderate pay growth. The Labour Department showed that non-farm payrolls added 228K positions, while average hourly earnings increased 0.2% in the reported month, boosting the yearly rise in wages to 2.5%. Data also showed the jobless rate unaltered at a 17-year low of 4.1%.
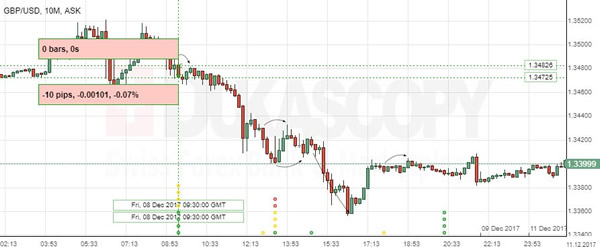
GBP/USD: UK Manufacturing Production
The Sterling edged lower against the US Dollar on the report showing mixed Britain's manufacturing and trade figures. The GBP/USD exchange rate fell 10 base points to continue depreciation in the 1.3400 area.
Britain's manufacturing expanded at its strongest annual pace in a year, while mixed trade figures and a downturn in construction left the market projections divided for the country's economy in 2018. The Office for National Statistics said that the UK factory output marked a 0.1% increase in October. Meanwhile, business surveys indicated that factories were enjoying higher demand from Europe, but also faced further rise in price pressures. The outcome of the country's quit from the EU is expected to be crucial for manufacturers' outlook.
EUR/JPY Potential Inverted Head And Shoulders On Intraday Charts
The EUR/JPY looks like it is forming an inverted head and shoulders pattern- Bullish SHS. The pair is currently sitting between H3 and H4, and there is still room to the upside. POC ( D L3/L4, EMA 89, ATR pivot) 133.18-35 and POC2 (W L3, historical support, D L5,ARE projection low) could reject the price towards higher resistance zones on a retracement. Targets are 134.05 and 134.47. 1h momentum and/or 4h close above 134.50 should open the door towards W H5 135.30. Break below 132.50 and EUR/JPY is bearish.
Trade Idea: GBP/USD – Stand aside
GBP/USD – 1.3375
Original strategy :
Exit long entered at 1.3410,
Position: - Long at 1.3410
Target: -
Stop: -
New strategy :
Stand aside
Position: -
Target: -
Stop:-
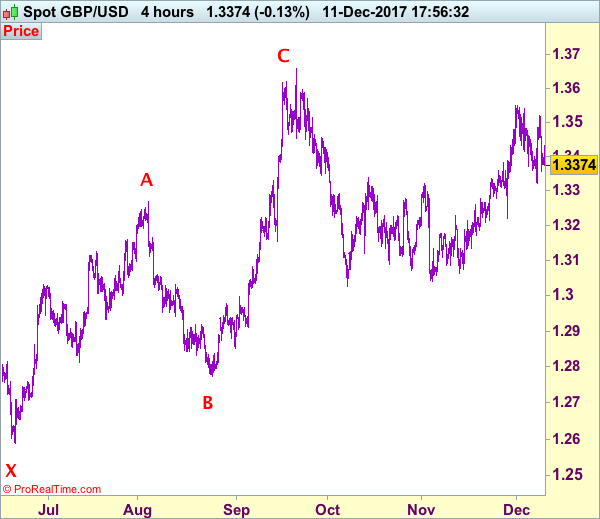
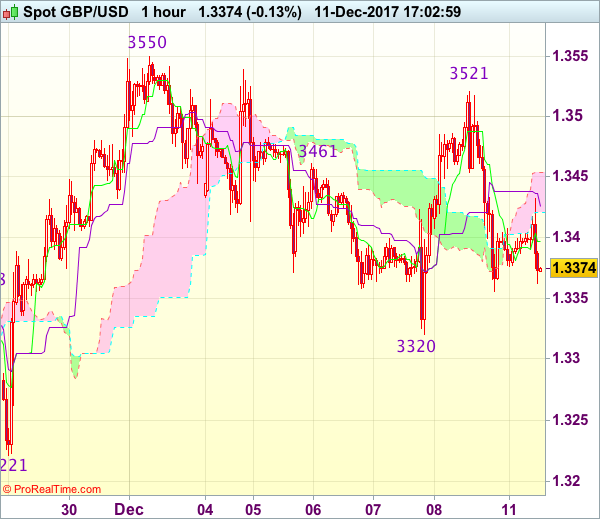
Despite rising to 1.3521 on Friday, lack of follow through buying and the subsequent retreat suggest recent upmove is not ready to resume and further consolidation below this month’s high at 1.3550 would be seen and pullback towards support at 1.3320 (last week’s low) cannot be ruled out, however, break there is needed to signal top has been formed at 1.3550, bring retracement of recent rise to 1.3300 but reckon downside would be limited to 1.3250-60 and previous support at 1.3221 should remain intact, bring rebound later.
In view of this, would be prudent to stand aside in the meantime. Above 1.3450 would bring another bounce towards 1.3520 resistance, however, only above this level would revive bullishness and signal correction from 1.3550 has ended, bring retest of this level first. Looking ahead, a break of 1.3550 would extend the rise from 1.3027 low to 1.3595-00, however, reckon recent high at 1.3658 (Sept high) would hold from here due to near term overbought condition, bring retreat later. Our preferred count is that (pls see the attached chart) the wave IV is unfolding as a complex double three (ABC-X-ABC) correction with 2nd wave B ended at 1.2774, hence 2nd wave C could have ended at 1.3658.
Our preferred count on the daily chart is that cable's rebound from 1.3500 (wave (A) trough) is unfolding as a wave (B) with A ended at 1.7043, followed by triangle wave B and wave C as well as wave (B) has ended at 1.7192, the subsequent selloff is the larger degree wave (C) which is still unfolding with minor wave (III) of larger degree wave 3 ended at 1.1986, hence wave (IV) correction is in progress which could either be a triangle wave (IV) of a complex formation but upside should be limited to 1.3500 and price should falter well below 1.4000, bring another decline in wave (V) of 3 for weakness to 1.1500, then 1.1200.
Gold Bearish In Short-Term, Remains Vulnerable But Immediate Downside Pressure Eases For Now
Gold has turned increasingly bearish and has shifted out of a range in which it has been trading in since early October. Prices broke below the 1270-1300 range to trade under 1250 since last Thursday.
On the 4-hour time frame, there was a bearish crossover of the 50 and 200-period moving averages. RSI has dipped into bearish territory and is slowly moving out of oversold levels. Gold prices are entering a consolidation phase due to the oversold conditions.
Immediate resistance is at 1250 which is currently being tested and could be quite a challenge to breach. A sustained break off this level could push prices towards the key 1260 area and then to the bottom of the recent range at 1270 with scope to re-enter the medium-term neutral phase.
Near-term support is expected between the 1243.48 low and 1247. Risk is tilted to the downside and there is potential for additional weakness for a move towards the 1235 area which was previously tested as support. From here a decline below 1230 cannot be ruled out.
The multi-month trend is bearish and the market remains vulnerable. But in the near term, congestion is expected to remain just below the 1250 area and above the 4-month low. Price action is soft but downside pressure is muted for now.
Technical Outlook: USDJPY – Hourly Cloud To Contain Corrective Dips
The pair probes below initial support at 113.37, provided by daily cloud top after Monday’s action posted marginally higher high at 113.68 (against Friday’s high at 113.58), but unable to sustain gains.
Strong rally on Thu/Fri generated bullish signal on close above daily cloud top, but corrective easing is signaled by reversal of RSI / slow stochastic from overbought zone on 4-hr chart.
Thick hourly cloud (spanned between 113.25 and 112.80) marks solid support which is expected to contain correction before broader bulls resume.
Hourly cloud base is reinforced by converged 30/55 SMA’s and should limit extended corrective dips.
Bulls eye initial target at 113.81 (Fibo 76.4% of 114.73/110.83 descend), ahead of recent peaks at 114.45/73 (the highest since March and marking the ceiling of broader 114.73/107.31 range).
Res: 113.68, 113.81, 114.45, 114.73
Sup: 113.25, 112.80, 112.52, 112.34
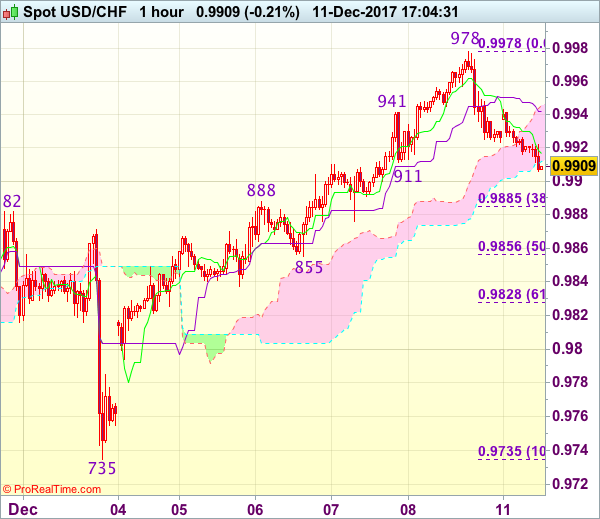
Trade Idea : USD/CHF – Buy at 0.9860
USD/CHF - 0.9911
Most recent candlesticks pattern : N/A
Trend : Near term up
Tenkan-Sen level : 0.9917
Kijun-Sen level : 0.9942
Ichimoku cloud top : 0.9945
Ichimoku cloud bottom : 0.9912
Original strategy :
Buy at 0.9890, Target: 0.9990, Stop: 0.9855
Position : -
Target : -
Stop : -
New strategy :
Buy at 0.9860, Target: 0.9970, Stop: 0.9825
Position : -
Target : -
Stop : -
As the greenback has retreated again after rising to 0.9780, suggesting consolidation below this level would be seen and pullback to 0.9885 (38.2% Fibonacci retracement of 0.9735-0.9978), however, reckon 0.9855-60 (50% Fibonacci retracement) would hold and bring another rise later, above 0.9950 would suggest the retreat from 0.9978 has ended, bring retest of this level, break there would signal recent upmove has resumed and extend gain to 1.0000 but price should falter below recent high at 1.0038.
In view of this, would not chase this rise here and we are looking to buy dollar on subsequent pullback as 0.9855 support should contain downside. Only below 0.9825-30 (61.8% Fibonacci retracement of 0.9735-0.9978) would abort and signal top has been formed, bring further fall to 0.9800.
Trade Idea : GBP/USD – Stand aside
GBP/USD - 1.3383
Most recent candlesticks pattern : N/A
Trend : Near term up
Tenkan-Sen level : 1.3397
Kijun-Sen level : 1.3426
Ichimoku cloud top : 1.3454
Ichimoku cloud bottom : 1.3421
New strategy :
Stand aside
Position : -
Target : -
Stop : -
As cable’s retreat from 1.3521 has kept sterling under pressure, suggesting near term downside risk remains for weakness to 1.3345-50, however, as outlook remains consolidative, reckon support at 1.3320 would limit downside and bring further choppy trading. Only a drop below this level would revive bearishness and signal top has been formed at 1.3550 earlier, bring retracement of recent rise to 1.3290-00 first.
On the upside, expect recovery to be limited to 1.3430-35 and the upper Kumo (now at 1.3454) should hold, bring another decline later. Above the upper Kumo would bring a stronger rebound to 1.3490-95 but still reckon resistance at 1.3521 would hold from here, bring retreat later. As near term outlook is mixed, would be prudent to stand aside for now.
Trade Idea : EUR/USD – Sell at 1.1835
EUR/USD - 1.1795
Most recent candlesticks pattern : N/A
Trend : Near term down
Tenkan-Sen level : 1.1784
Kijun-Sen level : 1.1764
Ichimoku cloud top : 1.1790
Ichimoku cloud bottom : 1.1765
Original strategy :
Sell at 1.1825, Target: 1.1725, Stop: 1.1860
Position : -
Target : -
Stop : -
New strategy :
Sell at 1.1835, Target: 1.1735, Stop: 1.1870
Position : -
Target : -
Stop : -
As the single currency found support at 1.1730 late last week and euro has rebounded, suggesting consolidation above this level would be seen and corrective bounce to 1.1810 (38.2% Fibonacci retracement of 1.1940-1.1730) cannot be ruled out, however, reckon upside would be limited to 1.1835 and bring retreat later, below 1.1760 would bring retest of 1.1730 but break of this support is needed to confirm recent decline has resumed and extend weakness to previous key support at 1.1713. Looking ahead, only break there would retain bearishness for subsequent decline towards 1.1660-70.
In view of this, we are looking to sell euro on further subsequent recovery as said resistance at 1.1815 should limit upside and bring another decline. Above 1.1845-50 would defer and suggest low is formed, bring a stronger rebound to 1.1875-80 first.