Sample Category Title
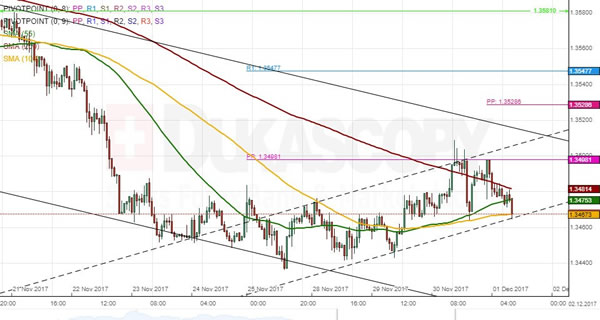
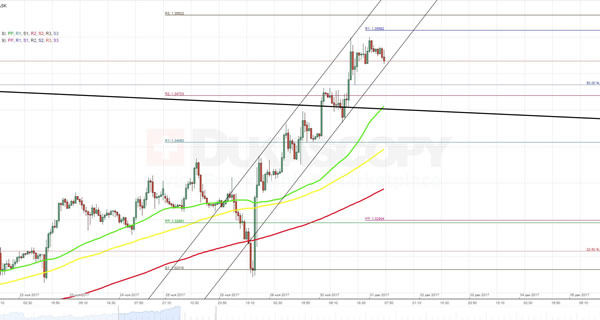
USD/SGD 1H Chart: Bearish Patterns Dominate
USD/SGD is being dominated by several channels, the most important of which in the short term are three. The US Dollar bounced off the upper boundaries of the two most senior channels on October 27 and subsequently began trading lower. Its bottom boundary was tested a month later near the 1.3440 mark. The pair has since recovered some of its lost positions and thus tested the weekly PP two times. It is expected that the most junior channel could be respected during the following two trading sessions until the psychological 1.35 mark is reached. However, technical indicators suggest that the rate might trade lower within next week. A possible downside target could be the 1.34 area where the bottom boundary of a five-month channel is located.
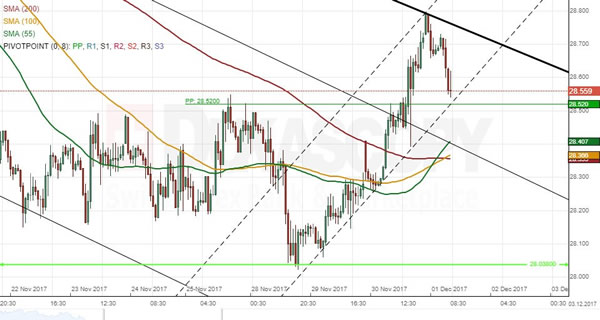
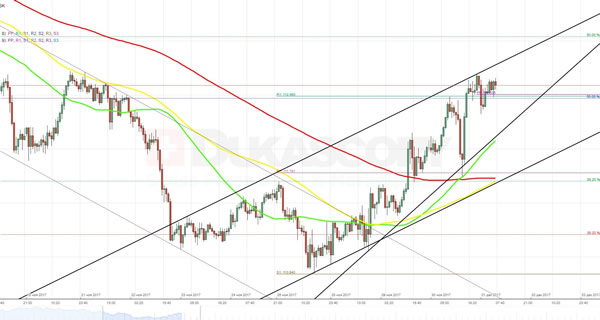
TRY/JPY 1H Chart: Lira Moves Away From Historic Low
The Turkish Lira has been trading in a channel down against the Japanese Yen for the last three months. During this time, a new descending channel was formed. After failing to edge down to the bottom boundary of the senior pattern last week, the Lira reached its ultimate low of 28.04 and reversed to the upside. Meanwhile, the pair breaching the shorter-term pattern yesterday might point to appreciation in both short and medium term; however, the upper line of the senior channel is yet to be breached circa 28.65. It is likely that the pair edges lower in this session and tries to make a retracement from the breached channel. However, the combined support of the 55-, 100– and 200-hour SMAs at 28.35 should limit further loses. This area is expected to mark a point of reversal from which the Lira might start its momentum north.
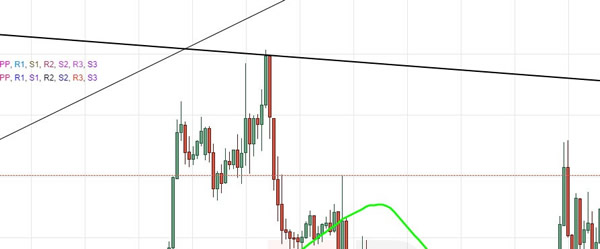
XAUUSD Analysis: Breaks From Junior Channel Up
Formation of a minor pennant pattern, indeed, pushed the further downwards. However, the fact that the buck continued to appreciate against the gold in based not only on release of satisfying macroeconomic data yesterday. Most probably the maximum that the pair has reached on November 27 was interpreted as a rebound from the upper trend-line of a larger descending channel, while the subsequent massive plunge simultaneously signified a breakout from the junior rising wedge formation. If this view dominates the market, then the bearish pressure is expected to continue until the pair reaches the lower support line of a dominant long-term ascending channel near 1,271.00. As for today, unless some event causes high volatility the pair is likely to fluctuate between the 1,276.50 and 1,271.50 levels.
EURUSD Analysis: Prepares To Hit 1.1940
In line with expectations, in first half of previous trading session the pair slipped to the bottom and, after reaching at the 200-hour SMA that was located slightly above the lower trend-line of a junior ascending channel, resumed the surge. By this morning, the currency rate has crossed practically all notable resistance levels. The only area left untested is located at 1.1936. Nevertheless, it is unlikely to stop the pair from reaching the upper boundary of a senior descending channel near 1.1940 by the end of the day. But even in case bears take the lead, for instance, after release of better than expected information on the US ISM Manufacturing PMI, combined support level formed mainly by the 100-hour SMA but also by the 61.8% Fibonacci retracement level is expected to neutralize the plunge.
GBPUSD Analysis: Slowly Heads To Weekly R3
In accordance with expectations, in first half of previous trading session the cable made a minor pull back to 1.3440 and then resumed the surge. An existence of two barriers located at the 1.3500 and 1.3530 levels was confirmed, while the pair continued to climb to the top yesterday. As majority of pending orders both in 50 and 100 pip range are set to buy, the currency rate is expected to continue moving upwards today as well. The bullish scenario is also backed up by fundamental reasons, such optimism related to progress made on Brexit. However, there is a need to take into account that alleged resistance barriers located at the 1.3560, 1.3580 and 1.3590 might either halt or event slightly turnaround the pair, especially if it matches with release of the US ISM Manufacturing PMI.
USDJPY Analysis: Tests Strong Resistance At 112.70
Unfortunately, neither existence of a rising wedge formation, nor the weekly R1 or the 50% Fibonacci retracement level stopped the rate from breaking to the top. However, this does not automatically mean dissolution of the pattern, as it still stay in force by making readjustment of the boundaries. Regardless of existence of the figure, in order to continue moving upwards, the pair will need to cross strong resistance zone located between the 112.62 and 12.70 marks. In addition to that, this barrier is strengthened by the 55-day SMA that lies at 112.75 as well as the 50% Fibonacci retracement level located at 113.00. In support of this assumption, 55% of pending orders in 100 pip range and 59% in 50 pip ranges are set to sell.
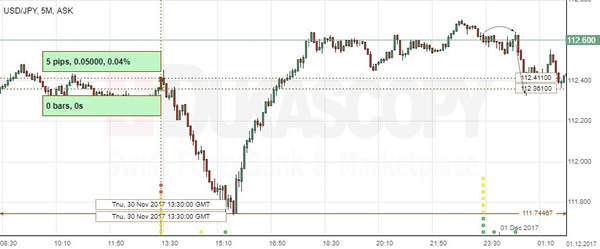
USD/JPY: US Core PCE Price Index
The Greenback made the last attempt to rise against the Yen before falling sharply on non-negative US economic data. The USD/JPY added 5 base points, ahead of the sharp fall to the 111.74 area. However, bulls put the pair back to the pre-data level of 112.60.
US consumer inflation growth weakened in October, as the hurricane-related increase in purchases of motor vehicles started to fade. The Fed’s closely watched inflation measure, the Core PCE Price Index excluding energy and food increased 1.4% year-over-year in October, though the figure undershot the bank’s 2% target for more than 5 years. Recent economic data strengthened projections for the Fed to raise borrowing costs once again in December.
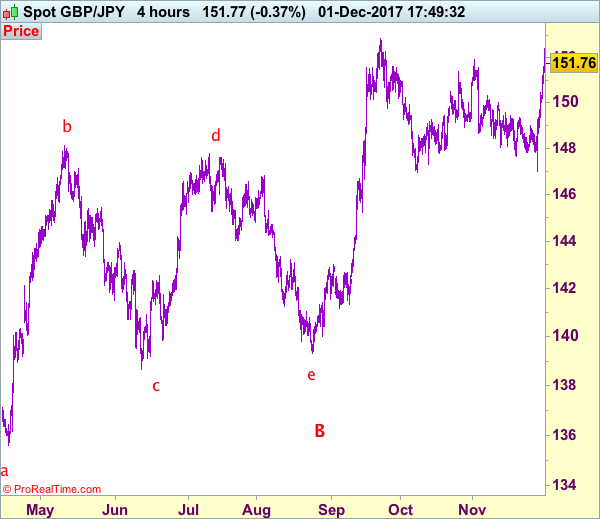
Trade Idea: GBP/JPY – Buy at 150.50
GBP/JPY - 151.75
Original strategy:
Buy at 148.50, Target: 150.30, Stop: 147.90
Position: -
Target: -
Stop: -
New strategy :
Buy at 150.50, Target: 152.50, Stop: 149.90
Position: -
Target: -
Stop:-
Although sterling’s rally above previous resistance at 151.90 adds credence to our view that entire correction from 152.85 top has ended at 146.95 earlier, as price has retreated from 152.45, minor consolidation would be seen and pullback to 150.90-00 cannot be ruled out, however, reckon 150.4050 would contain downside and bring another rise later. Above said resistance at 152.45 would bring a retest of 152.85 but break there is needed to confirm early uptrend has resumed for headway to 153.50, then 154.00-10 later.
In view of this, we are looking to buy sterling again on pullback as 150.40-50 should limit downside. Below 149.90-00 would defer and risk test of 149.35-40 but break there is needed to signal top is formed instead, risk further weakness to 148.90-00 first, however, support at 148.65 should hold from here.
Our preferred count is that larger degree wave V with circle is unfolding from 251.12 with wave (I) 219.34, (II): 241.38 and wave (III) is subdivided into 1: 192.60, 2: 215.89 (23 Jul 2008) and wave 3 ended at 118.87 earlier in 2009. The correction from there to 162.60 is wave 4 which itself is a double three and is labeled as first a-b-c ended at 151.53, followed by wave x at 139.03, 2nd a ended at 162.60, 2nd b at 146.75 and 2nd c leg of wave 4 ended at 163.00. Therefore, the decline from 163.00 to 116.85 is now treated as wave 5 which also marked the end of larger degree wave (III), hence wave (IV) major correction has commenced for retracement of the wave (III) from 241.38 and upside target at 183.95-00 (50% Fibonacci retracement of the wave (II) from 241.38) had been met, a drop below 160.00 would suggest wave (IV) has ended at 195.85, bring decline in wave (V) for initial weakness to 130 (already met) and 120.
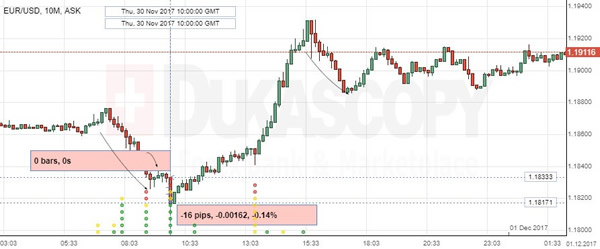
EUR/USD: EZ Consumer Price Index
The European single currency depreciated against the US Dollar, following the Euro zone’s economic reports on Thursday. The EUR/USD currency pair slacked 16 base points or 0.14% to reverse the downmove and freely rerturn above the 1.1900 mark.
Euro zone inflation growth accelerated at a weaker-than-expected pace in November, pointing to the price growth to remain weak and reinforcing the ECB projections for a further decrease by the end of the year. Eurostat showed that consumer inflation in the 19-country bloc rose 1.5% in November, remaining below the 2% target for nearly five years and missing expectations for a stronger growth pace of 1.6%, despite an increase in prices of oil, which resulted in higher energy costs.
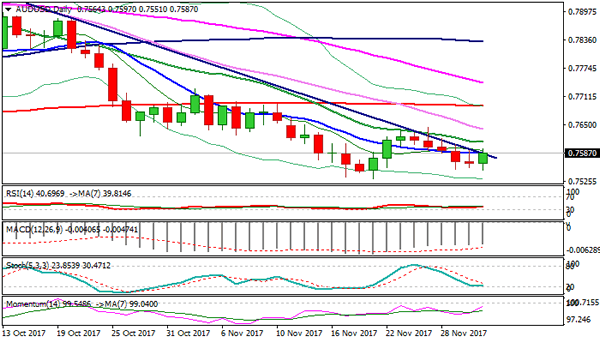
Technical Outlook: AUDUSD – Recovery Attempts Show Lack Of Strength For Stronger Correction
The Aussie dollar bounced on Friday after five-day descend found footstep at 0.7550, just ahead of key support at 0.7530 (21 Nov low.
Fresh recovery, propped by weaker greenback, probes above bear-trendline which tracks the downtrend since 20Sep and daily Tenkan-sen / 10 SMA (0.7587).
Upticks were so far unable to clearly break higher and trigger stronger correction of 0.7644/0.7550 downleg.
Failure to break here and take out 20SMA barrier at 0.7611 would keep in play risk of final push towards 0.7530 and bearish continuation on sustained break lower, but bears may stay in extended consolidation before resuming.
Close above 20SMA is needed to sideline immediate bearish threats and signal extension towards next pivotal barrier at 0.7644.
Res: 0.7597, 0.7611, 0.7630, 0.7644
Sup: 0.7551, 0.7530, 0.7500, 0.7475