Sample Category Title
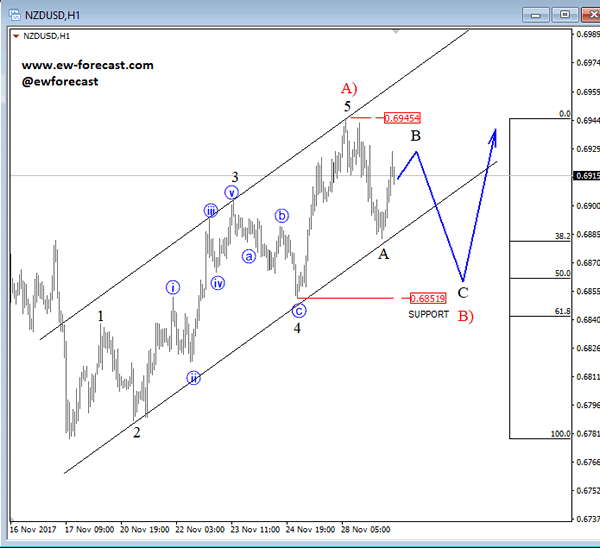
Elliott Wave Analysis: NZDUSD Trading In A Temporary Setback, With Support Around 0.6852/0.6840
NZDUSD has been trading bullish since November 17 and unfolded a higher degree wave A), first leg of a bigger three-wave recovery. Well rise has recently stopped near the upper Elliott wave channel line at 0.6945 level and breached lower, ideally for a three-wave correction into wave B). As of today, we see price again rising, but only for a temporary sub-wave B of B), with possible resistance coming in at around 0.6940 region. There a new drop into wave C of B) may follow, with significant support coming in at 0.6852 level former swing low.
NZDUSD, 1h
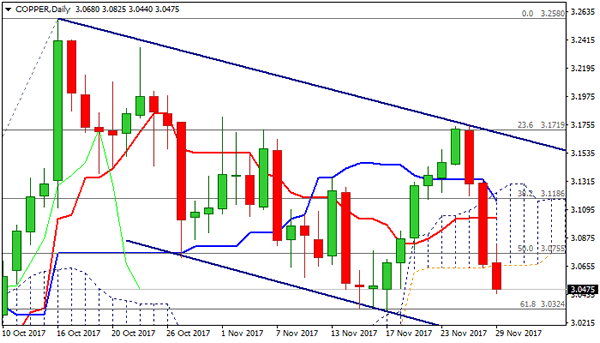
Technical Outlook: COPPER Extends Steep Descend Below Daily Cloud
Copper hit one-week low on today's extension of steep fall from $3.1750 peak which generated strong bearish signal on break below daily cloud base ($3.0663).
Bears are looking for full retracement of $3.0305/$3.1750 upleg, with growing risk of eventual break below key support at $3.0324 (Fibo 61.8% of larger $2.8930/$3.2580 ascend).
Sustained break here would be strong bearish signal for extension of bear-leg from $3.1750 towards psychological $3.00 support.
Broken daily cloud now acts as resistance and weighs on near-term action.
Stronger dollar on progress in US tax cut plan talks also pressures copper price.
Res: 3.0663, 3.0825, 3.1000, 3.1162
Sup: 3.0324, 3.0305, 3.0045, 3.0000
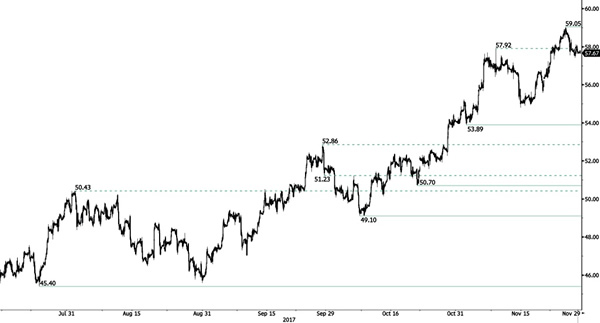
CRUDE OIL Bearish Retracement
Crude oil has finished its consolidation and is now ready to challenge the 60-dollar level. Expected to show continued increase. Support is given at a distance at 54.81 (14/11/2017 low)
In the long-term, crude oil has recovered after its sharp decline last year. However, we consider that further weakness are very likely. For the time being the pair lies in an upside momentum. Strong support lies at 35.24 (05/04/2016) while resistance can now be found at 55.24 (03/01/2017 high).
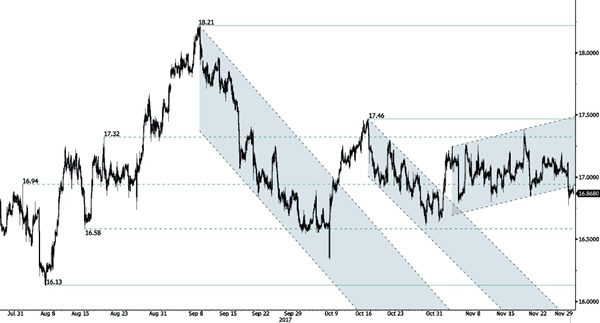
SILVER Monitoring Uptrend Channel
Silver is heading higher. Hourly support can be found at 16.60 (27/10/2017 low). Hourly resistance is given at 17.46 (13/10/2017 high). Additional support can be found at 16.13 (06/10/2017 low).
In the long-term, the trend is rater negative. Further downsides are very likely. Resistance is located at 25.11 (28/08/2013 high). Strong support can be found at 11.75 (20/04/2009).
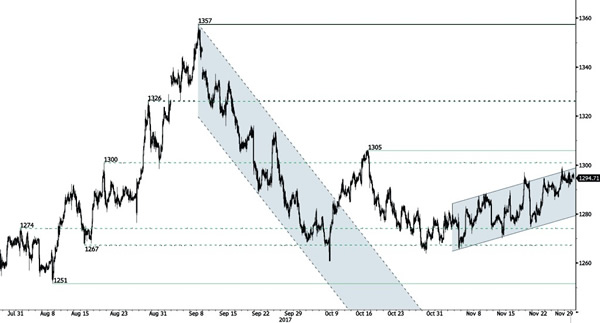
GOLD Riding Uptrend Channel
Gold is pushing higher. The technical structure confirms the end of the consolidation phase. Support lies at a distance at 1251 (08/08/2017 high). Resistance is located at 1288 (20/10/2017).
In the long-term, the technical structure suggests that there is a growing upside momentum. A break of 1392 (17/03/2014) is necessary ton confirm it, A major support can be found at 1045 (05/02/2010 low).
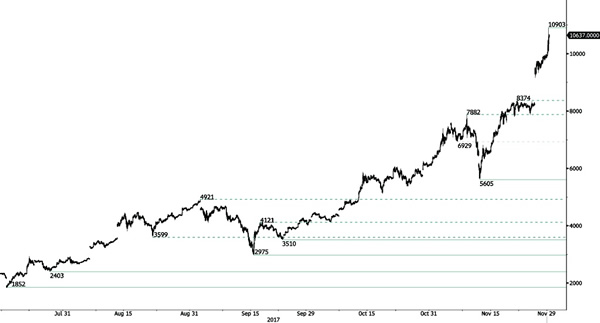
BITCOIN Mooning
Bitcoin has jumped over the weekend. The technical structure shows a tremendous positive short-term momentum. Hourly support is located at 5605 (13/11/2017 low). Strong support stands very far at 2975 (22/08/2017 low). In the shortterm, the digital currency should continue rising above 10k.
In the long-term, the digital currency has had an exponential growth. There are decent likelihood that the asset will reach $40'000.
EUR/CHF Trading Below 1.17
EUR/CHF continues to push towards resistance area above 1.17 and support given at 1.1610 (27/10/2017 low). Expected to show continued sideways move.
In the longer term, the technical structure has reversed. Strong resistance is given at 1.20 (level before the unpeg). Yet, the ECB's QE programme is likely to cause persistent selling pressures on the euro, which should weigh on EUR/CHF. Supports can be found at 1.0184 (28/01/2015 low) and 1.0082 (27/01/2015 low).
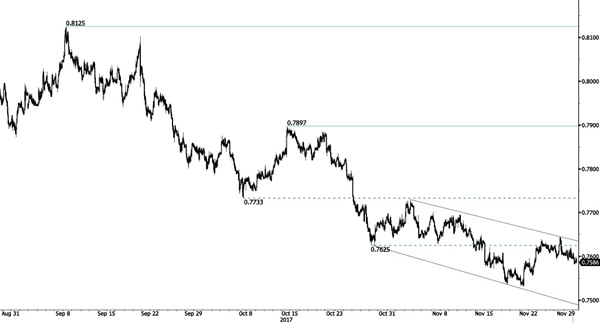
EUR/GBP Sharp Decline
EUR/GBP has collapsed unexpectedly despite the technical structure suggests further shortterm bullish momentum breaking hourly support at 0.8842 (21/11/2017 low). Next resistance is located at 0.8943 (27/11/2017 high).
In the long-term, the pair has largely recovered from recent lows in 2015. The technical structure suggests a growing upside momentum. The pair is trading above from its 200 DMA. Strong resistance can be found at 0.9500 (psychological level).
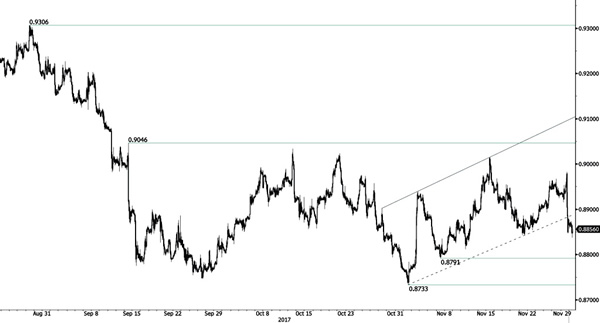
AUD/USD Riding Downtrend Channel
AUD/USD is ready to go even lower showing that downside pressures are still lively. Hourly resistance is given at a distance at 0.7897 (13/10/2017 high). Expected to show renewed pressures towards key support at 0.7535 (22/06/2017 low).
In the long-term, the trend is turning positive. Key supports stands at 0.6009 (31/10/2008 low) . A break of the key resistance at 0.8164 (14/05/2015 high) is needed to invalidate our long-term bearish view.
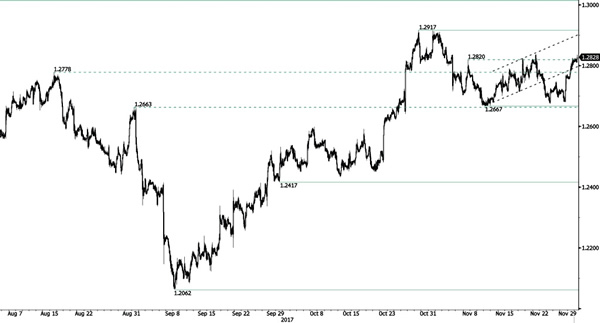
USD/CAD Pushing Higher
USD/CAD has broken hourly resistance can be found at 1.2837 (21/11/2017 high). Hourly support lies at 1.2667 (10/11/2017 low). Expected to show bearish pressures.
In the longer term, the pair has broken longterm support that can be found at 1.2461 (16/03/2015 low). Strong resistance is given at 1.4690 (22/01/2016 high). The pair is likely to head further lower.