
Sample Category Title
America’s Next Top Model: Tariff Edition
Summary
Prospects for a trade war are transitioning from a looming threat to looming policy. While most of the latest proposal is now on ice, our model simulations demonstrate how the latest round of proposed tariffs could introduce a modest stagflationary shock by negatively impacting growth and temporarily boosting inflation.
Begun the Trade War Has
For something that was widely telegraphed, the nearing implementation of tariffs still managed to introduce disorder into financial markets. In this report we unpack what has changed as a result of the new trade policies put into effect by President Trump and offer a framework for thinking about the economic impact of these changes.
Two weeks to the day from his inaugural address, President Trump is close to making good on his promise to use tariffs as a tool to achieve various, albeit at times conflicting, policy aims. Specifically, the President has come within a whisker of implementing the following tariffs:
- 25% tariff on non-energy Canadian goods, 10% on Canadian energy goods (postponed for 30 days)
- 25% tariff on Mexican goods (also postponed for 30 days pending negotiations)
- 10% tariff on goods from China
There is little that is certain about current U.S. trade policy, though the fact that the tariffs on Mexico and Canada were temporarily suspended suggests that the duration of these levies are not immutable. To the extent that the trade tariffs remain in force, they will have clear impacts on the economy. In a recent special report, we discussed how 25% tariffs on our North American trading partners would cast both those economies into recession while reducing U.S. GDP growth by a full percentage point relative to its status-quo baseline. Also, the annual rate of consumer price inflation would be half-a-percentage point higher by year-end than it otherwise would be in the absence of these specific tariffs.
While the exact timing and final size of the current tranche of tariffs under discussion remains in flux, the events of the past few days send the strongest signal yet that a step-up in tariffs is quickly approaching. To better understand how the tariffs taking shape would impact the U.S. outlook, we look at two new tariff scenarios:
- Scenario 1: All the tariffs listed in the bullets above go into effect in the first quarter of this year and the affected countries retaliate.
- Scenario 2: Prices in the potential expansion of the trade war to include the rest of the world by adding additional 10% tariffs across-the-board for the rest of the world to Scenario 1, as well as retaliatory tariffs on U.S. exports of 10%. Because these tariffs may not be implemented fully and both the timing and duration are uncertain, this second scenario is a dire case.
Like the other tariff scenarios about which we have written, this particular brew would impart a modest stagflationary effect on the U.S. economy. The down-to-the-wire implementation of steeper tariffs on some of our largest trading partners points to major changes to trade policy happening sooner rather than later, and warrants a look at how the impact to the economy would unfold over the coming quarters. Applying the tariffs outlined above into a macroeconomic model of the economy points to an immediate increase in consumer price inflation. Specifically, the model points to the year-over-year rate of the CPI rising 0.6 percentage points above its pre-tariff baseline in the first quarter tariffs are implemented. While the quarterly lift to the rate of inflation fades over the first year in which tariffs take effect (Figure 1), the level of prices would be 0.3% higher at the end of our forecast horizon in 2026.
The projected higher price level comes despite weaker growth in the first year in which tariffs are enacted. The model shows that the largest downward impulse to economic growth occurs one quarter after tariffs take effect, at which time the annualized rate of real GDP growth is a little more than two-percentage points lower than the baseline. While growth subsequently picks up a year after tariffs are implemented, the U.S. economy would be about 1% smaller at the end of 2026 in the more targeted tariff scenario, and about 1.5% smaller in the expanded trade war scenario relative to the model's baseline (Figure 2).
Notably, these simulations likely represent a dire-case scenario. Some imports may get a carve-out if no American-made substitutes are available, or these tariffs could be applied only temporarily. It is also worth highlighting that our forecast already assumed a material increase in tariff use this year. In November, we updated our policy assumptions to where roughly half of the 10% universal/60% tariffs on China proposed by Donald Trump on the campaign trail would go into effect around the third quarter of this year. The composition of tariffs currently under discussion is somewhat different from our earlier assumption, while the timing looks to be a bit earlier. Yet the estimated effect of the tariffs currently taking shape on the model's baseline is similar in scope to prior projections. We will update our forecast with the publication of our next Monthly Economic Outlook on February 13 to reflect the mix and timing of tariffs as more details have come into view. However, the comments from the administration the past two weeks support our previously held expectations: U.S. growth is likely to slow meaningfully this year while progress in lowering inflation grinds to halt amid a significant increase in the use of tariffs.
Trump 2.0 Tariff Chaos/Unpredictability Continues
Markets
The Trump 2.0 tariff chaos/unpredictability continues. High profile 25% levies announced this weekend on imports of Mexico and Canada obtained a last minute ‘delay ‘overnight. However, uncertainty persists. At the same time, 10% levies imposed on Chinese imports entering the US were applied ‘as planned’, triggering multiple, admittedly still modest, Chinese retaliation measures (10-15% tariffs on energy and some other goods, anti-trust probe versus Google and export controls on rare metals, amongst others). At first sight, the market reaction stays contained and orderly. However, this guarded market reaction at least partially might be a sign of paralysis due to a lack of visibility rather than indicating some comfort. Any directional reaction to whatever action from the US administration potentially might have to be reversed on new, contractionary measures/announcements anytime soon. This lack of visibility not only applies for the investment community, it also determines central banks reaction function. Recent Fed comments at least suggest that the combination of still decent US data combined with inflationary risks from tariffs fits current higher for longer Fed bias. US yields today again add between 1-2 bps across the curve. In a broader perspective, the sideways pattern than dominates trading in US yields since end October/early November remains in place. Since Thursday last week, softer than expected EMU growth data, more than the communication from the ECB policy meeting, caused EMU interest markets to focus on growth risk rather inflation, despite yesterday’s higher than expected January CPI. Today, this move at least takes a breather with German yields rebounding about 3 bps across the curve. Still, money markets err to the side of the ECB potentially reducing the policy rate below 2.0%. The ECB will have to make an in depth revelation in case of substantial US tariffs on EMU goods. However, for now we have to feeling that enough easing is discounted. The perceived ‘controlled’ exchange of tariffs between China and the US for now apparently gives investors some hope of a similar scenario for Europe. We stay a bit cautious, agnostic on this assessment. Still the EuroStoxx50 reversed a modest early decline to currently gain 0.6%. US indices open little changed. Oil extends its decline ($74 p/b).
On FX markets, the dollar also shows no clear direction pattern. An early risk-off related USD-bid after the Chinese retaliation measures soon evaporated. DXY currently even trades marginally lower in a daily perspective (108.4 area). Similar pattern for EUR/USD (lightly higher at 1.0345). After weathering USD strength recently, the yen today slightly underperforms (USD/JPY 155.3) but holds recent short-term consolidation range (153.75/156.75). After a solid performance of sterling of late (less risk of US tariffs?), EUR/GBP today stabilizes near 0.832, as markets look forward to Thursday’s BoE policy decision, annex ‘guidance’ of a new monetary policy report.
News & Views
The Organisation for Economic Cooperation and Development (OECD) warned Poland in its 2025 survey a sustained fiscal adjustment is needed to reduce the budget deficit and avoid excess demand. The recommendation builds on the OECD’s expectations for higher social, health and defense spending in coming years combined with running fiscal support measures. It expects a budget deficit in 2025 similar to the 5.8% of GDP in 2024 and called the government’s plan to lower the that ratio by one percentage point over 2026-2028 “ambitious”. It would also dampen economic growth. The OECD anticipates Poland to grow by 3.4% in this year and 3% in 2026, supported by demand from abroad, falling inflation and an eventual gradual easing of interest rates. For now though, the OECD recommends keeping monetary policy sufficiently restrictive to bring inflation back to target. Inflation is seen rising to 5% in 2025, pushed up by the withdrawal of the remaining government energy support measures in 2025H2, before easing to 3.9% in 2026. If it were up to the governor of the Polish central bank (NBP), rates would remain steady through all of 2025. However, opposition from within is rising with some deeming rate cuts possible in the second half of this year. KBC Economics sides with the view of the latter. The Polish zloty should remain strong through 2025 with levels of EUR/PLN 4.25 not that far from the current multiyear highs of around 4.22.
EUR/USD Mid-Day Outlook
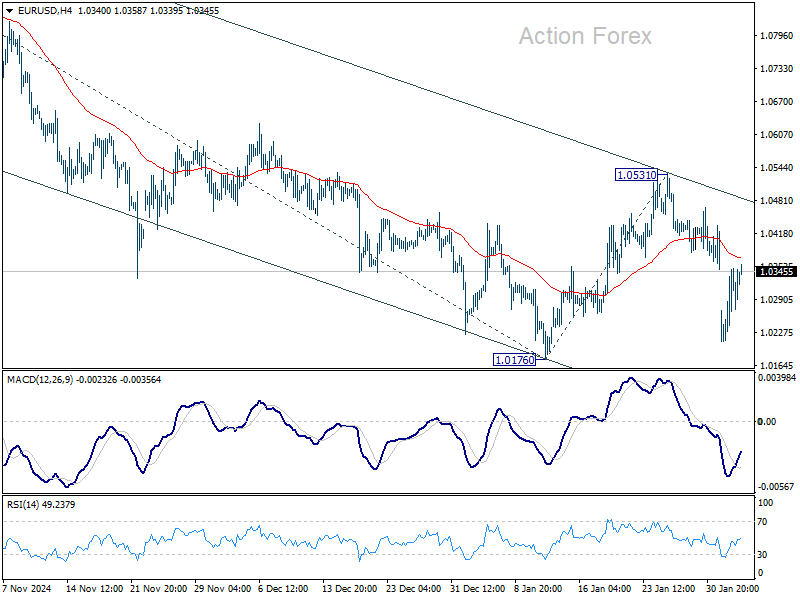
Daily Pivots: (S1) 1.0252; (P) 1.0301; (R1) 1.0391; More...
Intraday bias in EUR/USD remains neutral for the moment. Outlook will stay bearish as long as 1.0531 resistance holds. On the downside, decisive break of 1.0176 will resume whole fall from 1.1213. Next target will be 61.8% projection of 1.1213 to 1.0176 from 1.0531 at 0.9890.
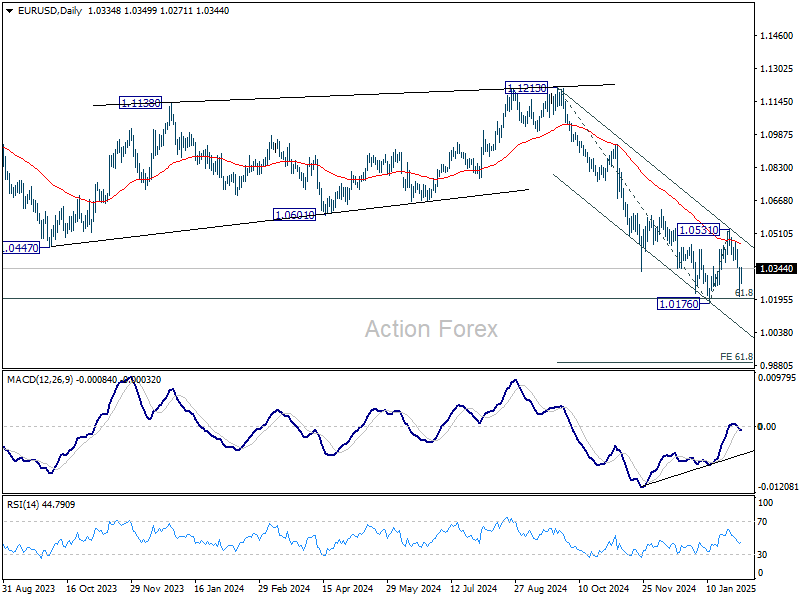
In the bigger picture, immediate focus is back on 61.8 retracement of 0.9534 (2022 low) to 1.1274 (2024 high) at 1.0199. Sustained break there will solidify the case of medium term bearish trend reversal, and pave the way back to 0.9534. For now, risk will stay on the downside as long as 1.0531 resistance holds, in case of rebound.
GBP/USD Mid-Day Outlook
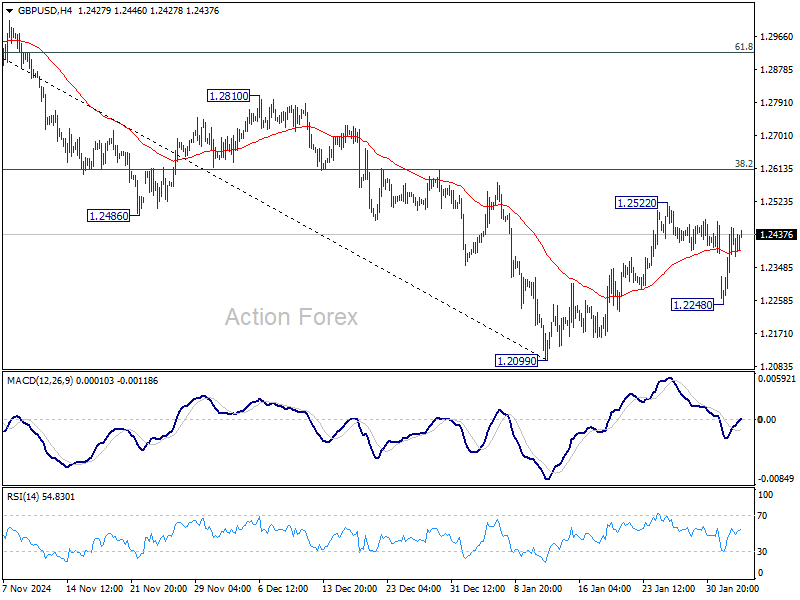
Daily Pivots: (S1) 1.2314; (P) 1.2385; (R1) 1.2520; More...
Outlook in GBP/USD is unchanged and intraday bias stays neutral. Corrective rebound from 1.2099 could extend further with another rise. But strong resistance should be seen from 38.2% retracement of 1.3433 to 1.2099 at 1.2609 to limit upside. Below 1.2248 will bring retest of 1.2099 low first. Firm break there will resume whole decline from 1.3433.
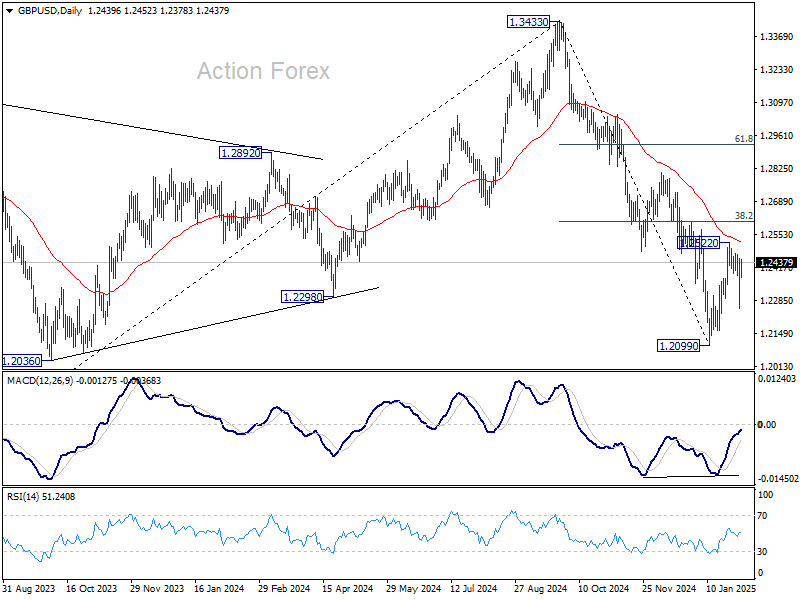
In the bigger picture, rise from 1.0351 (2022 low) should have already completed at 1.3433 (2024 high), and the trend has reversed. Further fall is now expected as long as 1.2810 resistance holds. Deeper decline should be seen to 61.8% retracement of 1.0351 to 1.3433 at 1.1528, even as a corrective move. However, firm break of 1.2810 will dampen this bearish view and bring retest of 1.3433 high instead.
USD/JPY Mid-Day Outlook
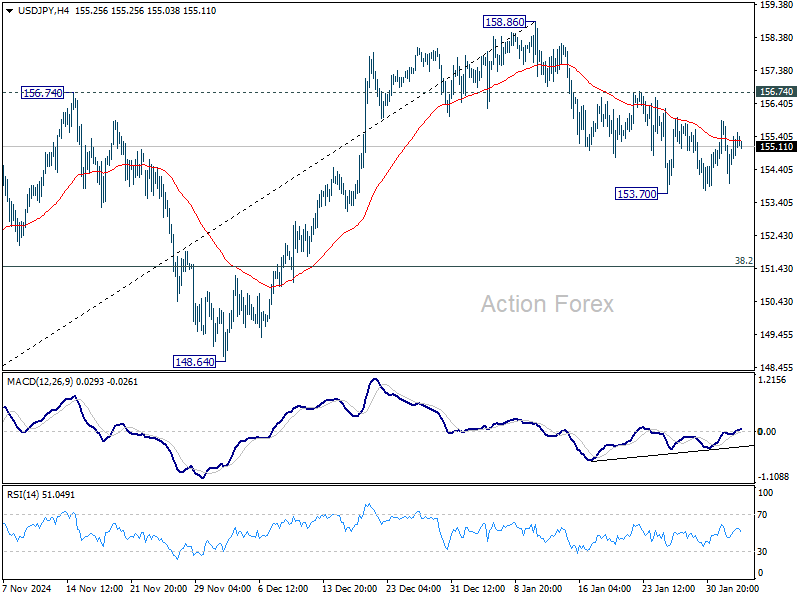
Daily Pivots: (S1) 153.91; (P) 154.90; (R1) 155.79; More...
No change in USD/JPY's outlook as range trading continues. Intraday bias stays neutral and deeper fall is mildly in favor with 156.74 resistance intact. On the downside, break of 153.70 will resume the decline from 158.86 to 38.2% retracement of 139.57 to 158.86 at 151.49. Nevertheless, break of 156.74 resistance will indicate that fall from 158.86 has completed as a correction. Intraday bias will be back on the upside for 158.86 and above to resume the whole rally from 138.57.
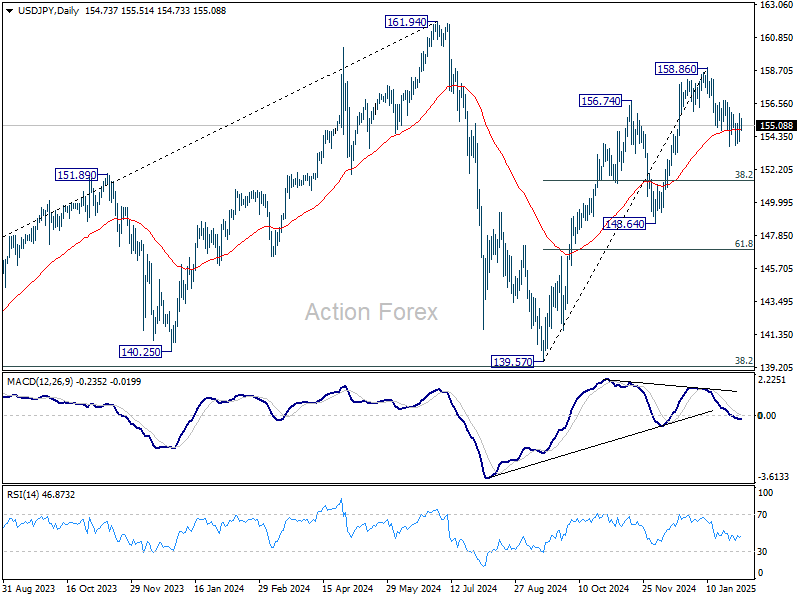
In the bigger picture, price actions from 161.94 are seen as a corrective pattern to rise from 102.58 (2021 low). The range of medium term consolidation should be set between 38.2% retracement of 102.58 to 161.94 at 139.26 and 161.94. Nevertheless, sustained break of 139.26 would open up deeper medium term decline to 61.8% retracement at 125.25.
USD/CHF Mid-Day Outlook
Daily Pivots: (S1) 0.9065; (P) 0.9131; (R1) 0.9169; More…
USD/CHF dips mildly today as consolidation from 0.9200 extends with another downleg. Deeper fall could be seen but outlook will stay bullish as long as 0.8956/64 support holds. Firm break of 0.9200/9223 will resume the whole rally from 0.8374 and carry larger bullish implication.
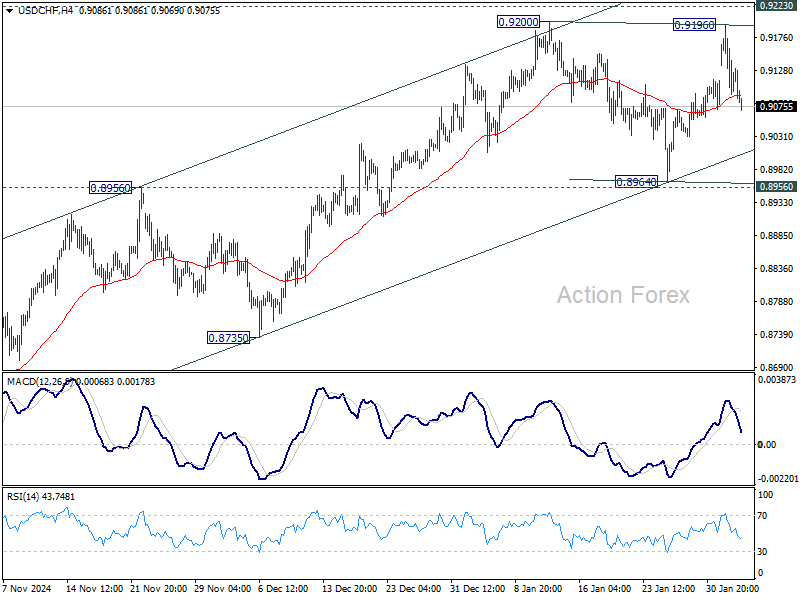
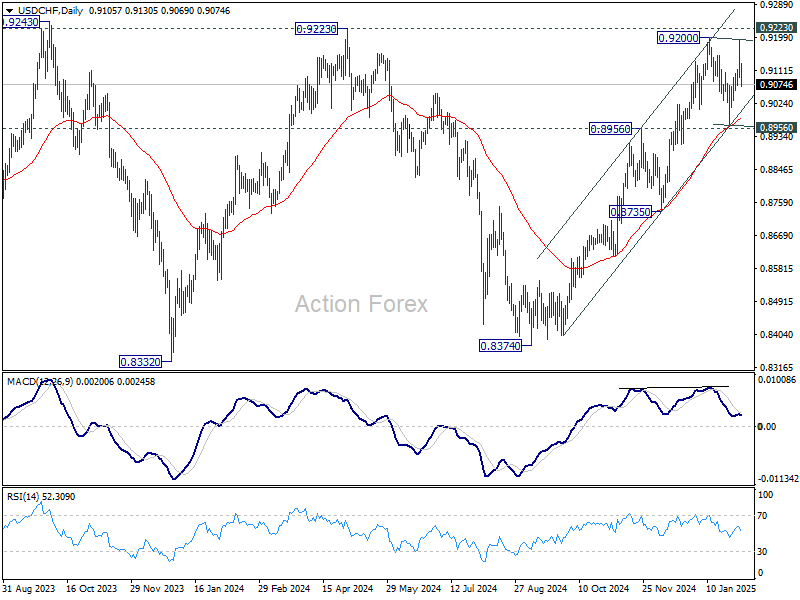
In the bigger picture, decisive break of 0.9223 resistance will argue that whole down trend from 1.0342 (2017 high) has completed with three waves down to 0.8332 (2023 low). Outlook will be turned bullish for 1.0146 resistance next. Nevertheless, rejection by 0.9223 will retain medium term bearishness for another decline through 0.8332 at a later stage.
Markets Stay Calm, Await Clarity from Trump-Xi Call
Global markets remain stable as US session begins, with sentiment lifted by the delay of tariffs on Canada and Mexico. Nonetheless, investors remain cautious about ongoing tensions between the US and China, as Washington’s additional 10% tariffs on Chinese imports have taken effect. So far, there has been no scheduled phone call between US President Donald Trump and Chinese President Xi Jinping, raising uncertainty over whether negotiations will take place anytime soon.
China responded swiftly with retaliatory tariffs of up to 15% on U.S. coal and liquefied natural gas, along with a 10% increase in duties on crude oil, farm equipment, and select automobiles, set to begin on February 10. Additionally, Beijing has opened an antitrust investigation into Google, signaling that trade tensions may extend beyond tariffs and into regulatory action against US firms operating in China.
Unlike the previous trade disputes during Trump’s first term, the current tariff measures appear to be more of a bargaining tool for non-trade-related concessions, making a near-term resolution less likely. Given Beijing’s firm stance, the US may keep the tariffs in place while shifting focus to another geopolitical or economic issue. As a result, investors should prepare for prolonged trade frictions, with potential spillover effects into other sectors.
In the markets, one development to note is the strong bounce in US 10-year yield as safe-haven flows reversed. Technically, 55 D EMA (now at 4.478) could be a spot to provide enough support to end the corrective pull back from 4.809. Break of 4.664 resistance would argue that rise from 3.603 is ready to resume through 4.809. In case the correction extends, downside should be contained by 38.2% retracement of 3.603 to 4.809 at 4.348. Dollar would likely follow yield for its next move, in particular in USD/JPY.
In Europe, at the time of writing, FTSE is down -0.10%. DAX is up 0.22%. CAC is up 0.36%. UK 10-year yield is up 0.062 at 4.551. Germany 10-year yield is up 0.038 at 2.429. Earlier in Asia, Nikkei rose 0.72%. Hong Kong HSI rose 2.83%. Singapore Strait Times fell -0.09%. Japan 10-year JGB yield rose 0.0265 to 1.276.
BoJ's Ueda prioritizes underlying inflation trends, not short-term volatility
BoJ Governor Kazuo Ueda reiterated the central bank’s commitment to achieving its 2% inflation target on a sustained basis, emphasizing that the focus remains on underlying inflation rather than temporary price fluctuations.
Speaking before parliament, Ueda highlighted that BoJ filters out one-off factors such as fuel and volatile fresh food prices when assessing inflation trends.
However, he acknowledged "that process at times could be difficult", reinforcing the need for careful analysis before making policy adjustments.
USD/CHF Mid-Day Outlook
Daily Pivots: (S1) 0.9065; (P) 0.9131; (R1) 0.9169; More…
USD/CHF dips mildly today as consolidation from 0.9200 extends with another downleg. Deeper fall could be seen but outlook will stay bullish as long as 0.8956/64 support holds. Firm break of 0.9200/9223 will resume the whole rally from 0.8374 and carry larger bullish implication.
In the bigger picture, decisive break of 0.9223 resistance will argue that whole down trend from 1.0342 (2017 high) has completed with three waves down to 0.8332 (2023 low). Outlook will be turned bullish for 1.0146 resistance next. Nevertheless, rejection by 0.9223 will retain medium term bearishness for another decline through 0.8332 at a later stage.
Australian Dollar Recovers, But Risks Remain High
The AUD/USD pair rebounded to 0.6199 on Tuesday, recovering some losses. Earlier in the week, the Australian dollar tested multi-year lows as investors distanced themselves from riskier assets amid concerns over US tariffs on Canada, Mexico, and China.
A reprieve came as US President Donald Trump delayed the implementation of tariffs on Canada and Mexico for one month while negotiating with both countries. This pause improved sentiment for risk currencies, including the Australian dollar.
Key factors influencing AUD/USD
Despite this temporary relief, uncertainty remains, particularly regarding China, Australia’s largest trading partner. The newly announced US tariffs on Chinese goods take effect today, which could have significant economic consequences. Any updates related to China directly impact Australia’s economy and currency movements.
Adding to the uncertainty, Trump is set to meet with Chinese President Xi Jinping this week. While China is keen to avoid escalating trade tensions, the US administration will likely use the situation strategically to its advantage. The outcome of these discussions could shape risk sentiment in global markets.
On the domestic front, Australia’s trade balance data for December is scheduled for release on Thursday. This report will provide insights into the health of Australia’s export-driven economy and could influence the Reserve Bank of Australia’s (RBA) policy stance.
Technical analysis of AUD/USD
On the H4 chart, AUD/USD previously formed a downside wave to 0.6088, followed by a correction to 0.6233. Today, the market is expected to initiate another downward wave towards 0.6077. A potential corrective move back to 0.6230 may follow, forming a consolidation range. If the pair breaks upwards from this range, another correction towards 0.6290 is possible. However, if it breaks downwards, the downward wave to 0.6077 will likely continue. The MACD indicator supports this scenario, with its signal line positioned above the zero mark but pointing sharply downwards, indicating strong bearish momentum.
On the H1 chart, AUD/USD established a consolidation range near 0.6160 before breaking upwards to complete a correction at 0.6230. The next move is expected to be a new downward wave targeting 0.6150. If this level is breached, the pair could extend losses towards 0.6077. The Stochastic oscillator confirms this bearish outlook, with its signal line below 80 and trending downwards towards 20, indicating growing downside pressure.
Conclusion
The Australian dollar has staged a modest recovery, but risks remain elevated due to ongoing US-China trade tensions and uncertainty surrounding Australia’s economic outlook. While short-term technical indicators suggest the potential for further downside, the key levels to watch are 0.6150 and 0.6077. Market participants will closely monitor Trump’s meeting with Xi Jinping and Australia’s trade balance data for further directional cues.
Bloodshed in Commodities Currencies (AUD and CAD) as Trade War 2.0 Starts, More Weakness Ahead or Bullish Reversal on...
- Trade War 2.0 may trigger a stagflation narrative as it involves not only US-China trade but with other major trading partners.
- Commodities currencies may face further headwinds due to deteriorating global economic growth prospects.
- Watch the 0.6330 key medium-term resistance on the AUD/USD and the 1.4300 key medium-term support on the USD/CAD.
On 1 February, US President Trump officially “fired” his flagship trade tariffs policy by imposing 25% tariffs on goods from Canada and Mexico and a 10% levy on products from China via the issuance of executive orders.
While tariffs-related orders have not been executed on European Union exports to the US, Trump has remarked that trade tariffs will “definitely happen” on European goods, which sparked a sell-off in the Euro and European benchmark stock indices today; the EUR/USD tumbled by 1.2% to revisit its recent 13 January swing area of 1.0190 and export-dependent Germany’s DAX shed 1.7%
Trade War 2.0 is different from the US-China Trade War which was enacted in January 2018 in terms of coverage as this time round it involves major trading partners of the US, on top of the ongoing US-China Tech War.
Trade War 2.0 may trigger negative whiplash on commodities currencies
Hence, it may trigger a widespread negative sentiment on global growth prospects, risk of stagflation narrative may be back on the radar of speculative players in the financial markets which in turn creates a negative feedback loop on higher beta commodities related currencies that has a direct correlation to global economic growth such as AUD (base metal proxy such as iron ore), CAD (oil proxy).
Let us do a deep dive into the prospects of the Aussie dollar and Loonie from a technical analysis perspective over a medium-term horizon (multi-month).
AUD/USD negative reaction at 50-day moving average
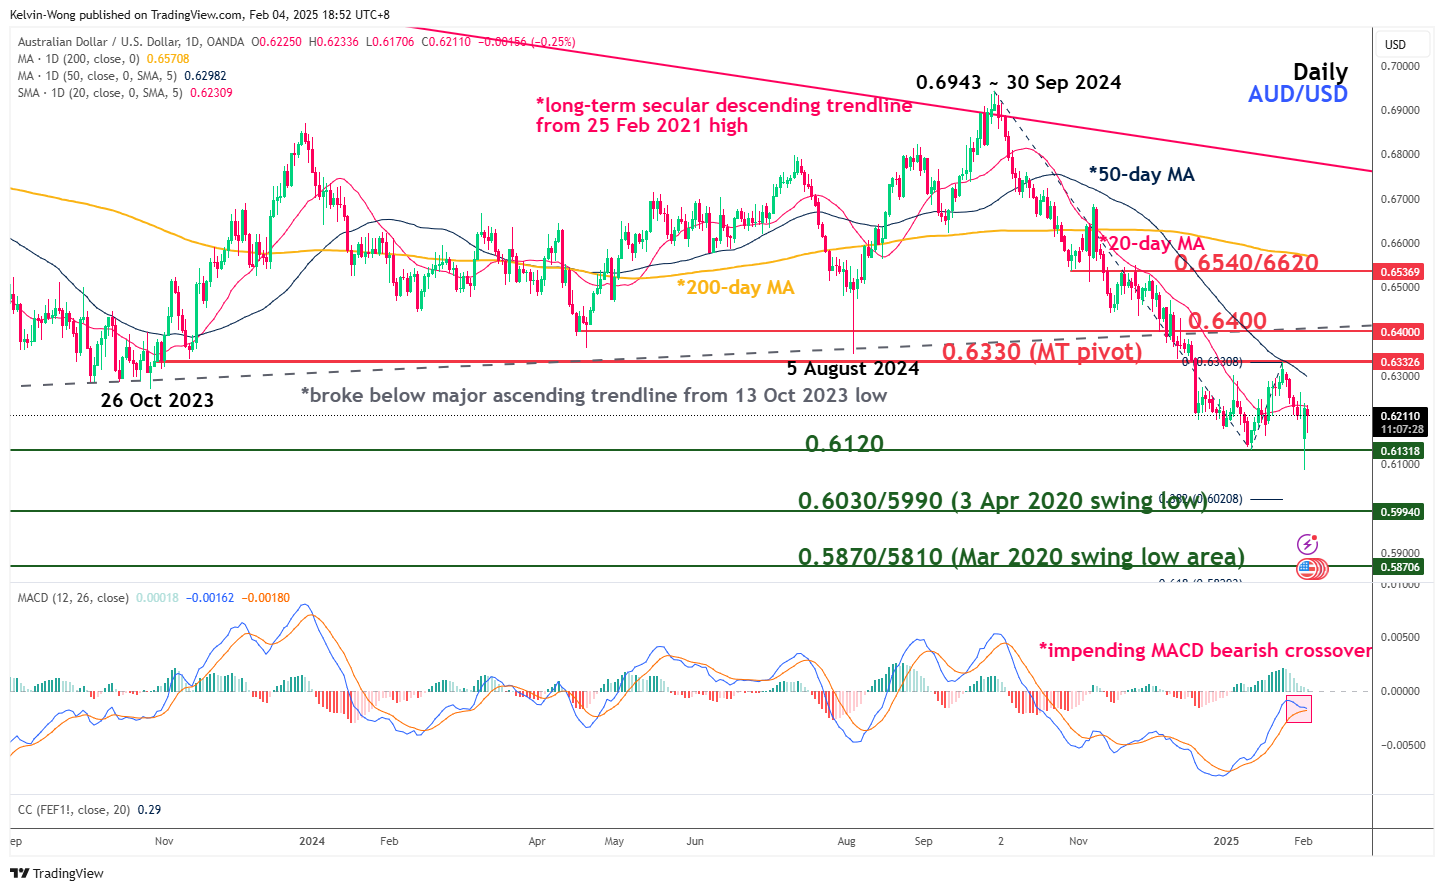
Fig 1: AUD/USD medium-term trend as of 4 Feb 2025 (Source: TradingView, click to enlarge chart)
The recent rebound seen in the AUD/USD from its recent 13 January swing low area has been stalled right at its downward sloping 50-day moving average that has acted as a resistance at around 0.6330 (see Fig 1).
Coupled with an impending bearish crossover condition being flashed out today, 3 February by the daily MACD trend indicator below its centreline suggests that the medium-term downtrend of the AUD/USD in place since its 30 September 2024 swing high of 0.6943 remains intact.
Watch the 0.6330 key medium-term pivotal resistance and a break with a daily close below 0.6120 key near-term support exposes the next medium-term supports of 0.6030/5990 and 0.5870/5810.
On the flip side, a clearance above 0.6330 invalidates the bearish scenario for the next medium-term resistance to come in at 0.6440, and above it sees the long-term pivotal resistance of 0.6540/6620 (also the 200-day moving average).
USD/CAD hit overbought condition but no clear signs of bearish reversal
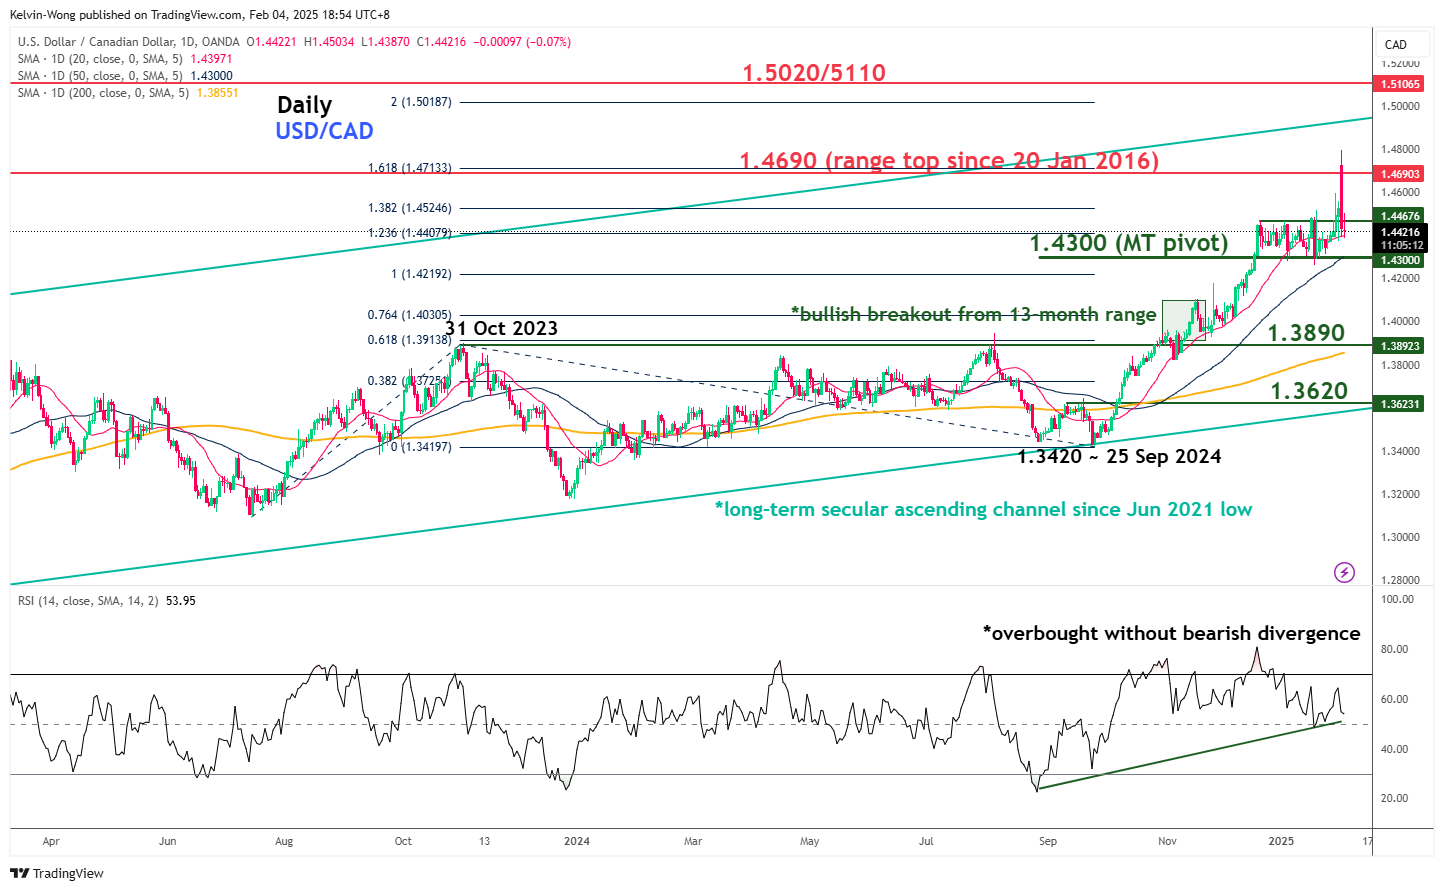
Fig 2: USD/CAD medium-term trend as of 4 Feb 2025 (Source: TradingView, click to enlarge chart)
The price actions of the USD/CAD gapped up today 3 February and right now, it is testing its long-term secular range resistance of 1.4690 which has been in place since 20 January 2016.
The daily RSI momentum indicator has reached its overbought region but has not flashed out any bearish divergence condition which suggests that the USD/CAD may stage a minor pull at this juncture before resuming its impulsive upmove sequence within its current medium-term uptrend in place since 25 September 2024 swing low of 1.3420 (see Fig 2).
Watch the 1.4300 key medium-term pivotal support (also the 50-day moving average) to hold any potential minor pull-backs and a daily close above the 1.4690 key near-term resistance sees the next medium-term resistance coming in at 1.5020/5110 (also the upper boundary of the long-term secular ascending channel from June 2021 low).
However, a breakdown below 1.4300 invalidates the bullish scenario on the USD/CAD for a potential corrective decline sequence to unfold within its major uptrend phase which exposes the next medium-term support at 1.3890 (also the 200-day moving average in the first step).