Sample Category Title
BITCOIN Short-Term Consolidation
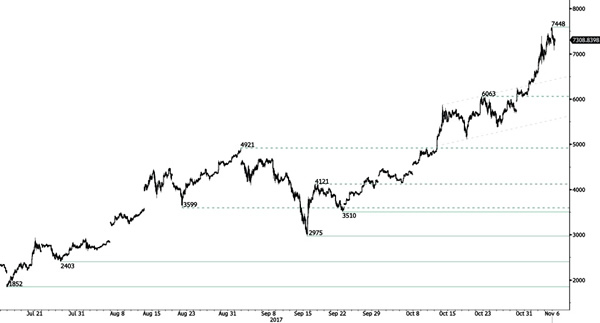
Bitcoin is now consolidating after setting-up a new all-time high for 4 consecutive days. The technical structure shows a tremendous positive short-term momentum. Hourly support can be located at 6027 (30/10/2017 low). Strong support stands very far at 2975 (22/08/2017 low). In the short-term, the digital currency should continue rising.
In the long-term, the digital currency has had an exponential growth. There are decent likelihood that the asset will reach $10'000.
EUR/CHF Pushing Higher Within Former Uptrend Channel
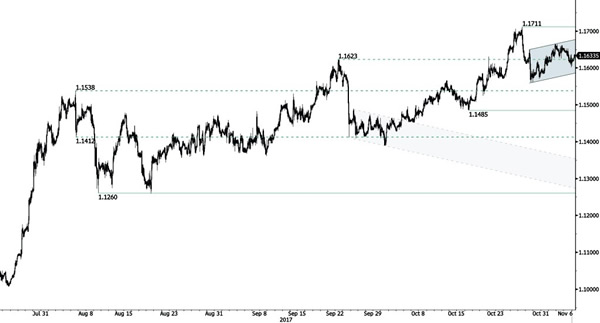
EUR/CHF is back within former uptrend channel. Support is given at 1.1610 (27/10/2017 low). Rising channel suggests further bullish momentum.
In the longer term, the technical structure has reversed. Strong resistance is given at 1.20 (level before the unpeg). Yet, the ECB's QE programme is likely to cause persistent selling pressures on the euro, which should weigh on EUR/CHF. Supports can be found at 1.0184 (28/01/2015 low) and 1.0082 (27/01/2015 low).
EUR/GBP Bouncing Lower
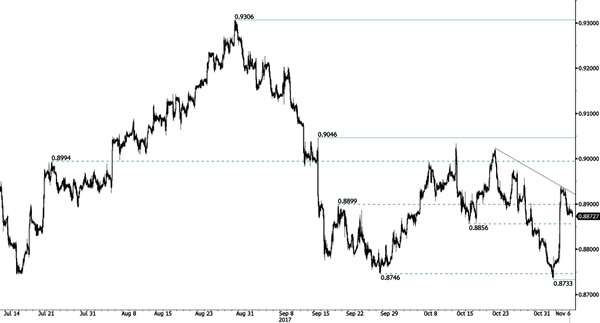
EUR/GBP is consolidating after the sharp increase. As long as prices are below the resistance at 0.9046 (05/09/2017 high), the shortterm technical structure is biased to the downside. Hourly support is given at a distance at 0.8733 (01/11/2017 low).
In the long-term, the pair has largely recovered from recent lows in 2015. The technical structure suggests a growing upside momentum. The pair is trading above from its 200 DMA. Strong resistance can be found at 0.9500 (psychological level).
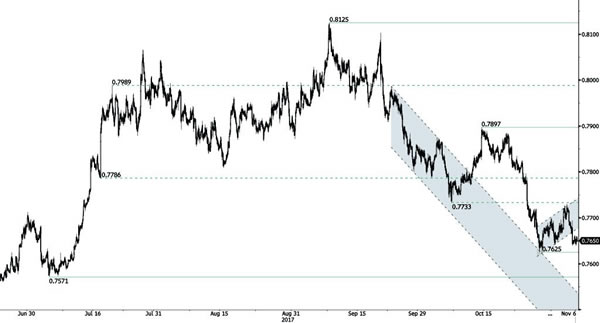
AUD/USD Edging Lower
AUD/USD is ready to bounce back but downside pressures are still lively. Hourly resistance is given at a distance at 0.7897 (13/10/2017 high). Expected to show renewed pressures towards key support at 0.7571 (05/07/2017 low).
In the long-term, the trend is turning positive. Key supports stands at 0.6009 (31/10/2008 low) . A break of the key resistance at 0.8164 (14/05/2015 high) is needed to invalidate our long-term bearish view.
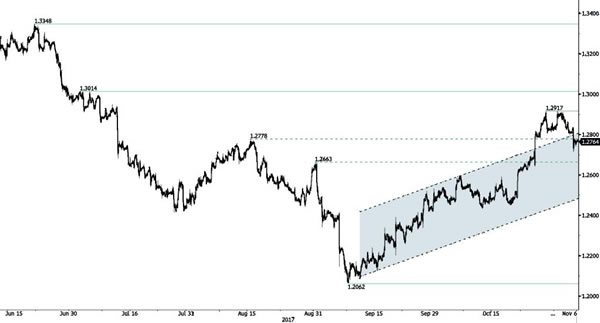
USD/CAD Wide-Open For Further Downside
USD/CAD is weakening after set-up a resistance at 1.2917 (27/10/2017 low). This suggests an extension of bullish momentum. Hourly support lies at 1.2331 (26/09/2017 high). Expected to show continued short-term bullish pressures.
In the longer term, the pair has broken longterm support that can be found at 1.2461 (16/03/2015 low). Strong resistance is given at 1.4690 (22/01/2016 high). The pair is likely to head further lower.
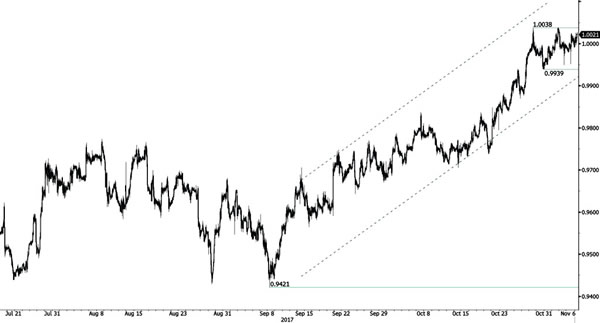
USD/CHF Holding Around Parity
.
USD/CHF is consolidating. Yet, the technical structure is still bullish. The technical structure suggests an improving short-term buying interest. Expected to show continued bullish momentum. Hourly support stands at 0.9951 (01/11/2017 low).
In the long-term, the pair is still trading in range since 2011 despite some turmoil when the SNB unpegged the CHF. Key support can be found 0.8986 (30/01/2015 low). The technical structure favours nonetheless a long term bullish bias since the unpeg in January 2015.
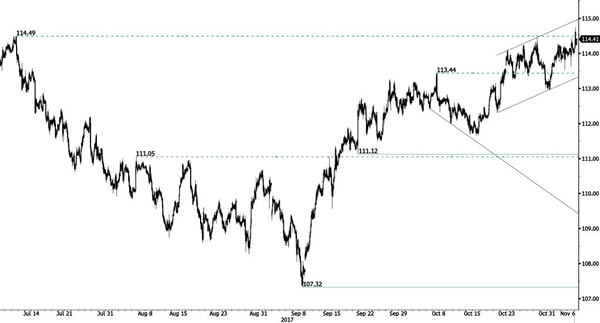
USD/JPY Breaking Resistance At 114.49
USD/JPY is edging higher above resistance stands at 114.49 (11/07/2017 high). Support is located at 111.12 (20/09/2017 low).
We favor a long-term bearish bias. Support is now given at 99.02 (10/08/2013 low). A gradual rise towards the major resistance at 125.86 (05/06/2015 high) seems unlikely. Expected to decline further support at 93.79 (13/06/2013 low).
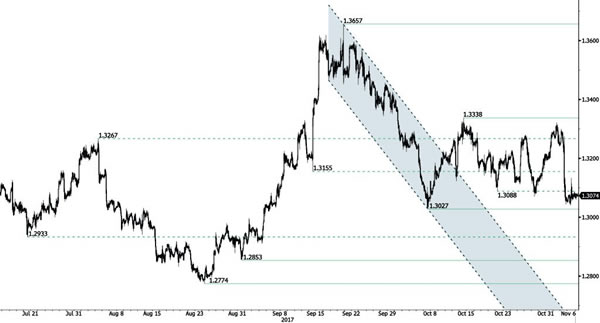
GBP/USD Monitoring Support At 1.3000
GBP/USD is back towards support given at 1.3027 (06/10/2017 low). String resistance is given at 1.3338 (13/10/2017 high). Expected to show continued decline.
The long-term technical pattern is reversing. The Brexit vote had paved the way for further decline. Long-term support can be found at 1.1841 (07/10/2017 low). Long-term resistance given around 1.35 is at stake and indicates a long-term reversal in the negative trend. Yet, it is very unlikely at the moment.
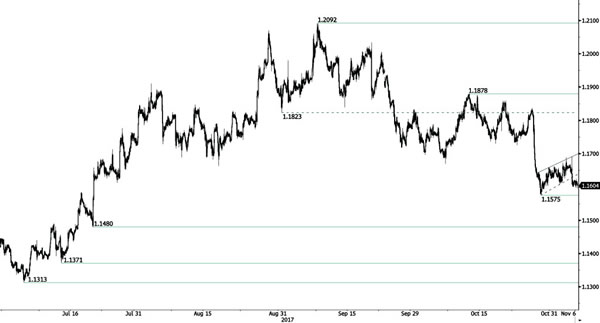
EUR/USD Significant Selling Pressures
EUR/USD is biased to the downside after setting a new hourly support at 1.1575 (27/10/2017 low). Hourly resistance is located at 1.1658 (30/10/2017 high). Expected to show some short-term consolidation.
In the longer term, the momentum is now turning largely positive. We favour a continued bullish bias. Key resistance is holding at 1.2252 (25/12/2014 high) while strong support lies at 1.0341 (03/01/2017 low).
Technical Outlook: US CRUDE OIL Hits New Over Two-Year High, Correction May Precede Fresh Upside
WTI oil maintains strong bullish tone on Monday and hit new high at $56.56 (the highest since July 2015), in extension of strong rally last Thu/Fri.
Oil prices remains strongly supported by expectations that oil producers will agree to extended existing output cut on cartel’s meeting at the end of November.
Series of arrests of high-profile persons in Saudi Arabia over the weekend also added to support of oil prices.
WTI contract for December delivery is currently riding on the third wave of five-wave cycle from $45.57 which hit its 100% Fibonacci expansion and could travel to $57.99 (FE 123.6%) and $59.04 (FE 138.2%) in extension).
Close above initial pivot at $57.14 (Fibo 38.2% of $107.45/$26.04 descend) is needed to generate strong bullish signal.
Meanwhile, correction on overbought daily studies (RSI / slow stochastic) could be anticipated.
Rising daily Tenkan-sen ($54.07) and 10SMA ($54.09) are expected to ideally contain dips and keep broader bulls intact, as bullish sentiment remains firm.
Res: 56.26, 57.14, 57.99, 59.04
Sup: 55.67, 54.59, 54.07, 53.74