Sample Category Title
USDCHF Looking Bullish In The Short- And Medium-Term, Pair Trades Around Parity
USDCHF has been in an upward path after reaching a 26-month low of 0.9419 on September 8. The pair has reached and has been trading around the parity level (1.00) in recent days.
The Tenkan-sen line being above the Kijun-sen line is a positive alignment pointing to bullish momentum in the short-term. The RSI adds to the view for positive momentum as it has been rising over the last number of days. Notice though that the indicator is currently at 69, close to the 70-overbought level.
If USDCHF continues rising, the area around 1.0037 – the six-month high from October 27 – could act as resistance. Notice that the price is at the moment not far below the aforementioned high. Further above, the range around the seven-month high of 1.0107 from April 10 could act as an additional barrier to the upside. The area around this potential key level encapsulates another peak from the recent past, namely the May 11 six-and-a-half-month high of 1.0099.
Should the pair decline, support could come around the current level of the Tenkan-sen at 0.9956 and further below (and given a sharper move down) from the range around the Kijun-sen at 0.9871.
The medium-term picture based on movement over the last five months is looking bullish. The overall trend throughout this period is a positive one. Additionally, both the 50- and 100-day moving averages (MAs) maintain a positive slope while there was a bullish (golden) cross recorded in early October when the 50-day MA moved above the 100-day one.
Overall, the pair is looking bullish in both the short- and medium-term.
Gold In Consolidation Phase But Short-Term Trend Remains Bearish
Gold is neutral after stabilizing from a recent drop, but risk is tilted to the downside in the short term. On the 4-hour chart, oscillators are neutral to bearish.
The market appears to have found near-term support in the lower 1265 area, just above the October 6 low of 1260.59. Any moves to the upside would target key Fibonacci levels of the 23.6%, 38.2% and 50% retracement from 1357.47 to 1260.59. These levels come in at 1283.16, 1297.54 and 1308.91 respectively.
The recent consolidation phase is currently trapped below the 23.6% Fibonacci and is keeping the bearish trend in progress since the decline from 1357.47. A break below 1260.59 would bring a resumption of the downtrend from the multi-month peak.
However, a prolonged consolidation would lead to further loss of momentum and the market’s focus could shift back to the upside. A move above the 50% Fibonacci would indicate the bearish phase has ended. From here, the odds would increase for a test of 1357.47 and gold would see a reversal in the short-term bearish trend.
RBNZ Expected To Keep Interest Rates Steady This Week
The Reserve Bank of New Zealand will be holding its monetary policy meeting this week on Wednesday. The RBNZ's overnight cash rate or OCR is expected to remain unchanged at 1.75%.
This marks an unchanged print for six consecutive monetary policy meetings. The RBNZ last lowered interest rates from 2.0% to 1.75% in November last year. Interest rates are expected to stay put as economic data suggests that further evidence of inflationary trends are required.
This week's monetary policy meeting will be chaired by the acting governor of the RBNZ, Grant Spencer. The central bank is expected to maintain its bias as the markets expect to see interest rate hikes coming only in early 2019.
This aptly reflects the previous RBNZ statement which said that “Monetary policy will remain accommodative for a considerable period. Numerous uncertainties remain, and policy may need to adjust accordingly.”
The RBNZ's meeting comes following Monday's data that includes the inflation expectations for the quarter. Last week also saw the release of the ANZ business outlook survey. The data showed that confidence in the economy fell into the negative with the index at -10.11 for the month of October.
The businesses participating in the survey showed that confidence in the economic activity had also eased to the lowest levels since 2015. This came amid the uncertainty from the recently concluded elections as well.
The New Zealand dollar fell sharply as the new Labor party government was formed with the help of the populist NZ First party.
New Zealand labor market paints a robust picture
Last week, the quarterly labor market data showed a stronger than expected headline print. According to official data released by Statistics New Zealand, the unemployment rate was seen falling from 4.8% in the second quarter to 4.6% in the quarter ending September.
This was stronger than the forecasts that showed a decline to 4.7%. The September quarter unemployment report showed that lowest unemployment rate since 2008 during the height of the global financial crisis.
The labor force participation rate also edged higher from 70.1% to 71.1% marking a new record high. This came simultaneously as the employment rate ticked higher to 2.2% for the quarter. The big increase in September came about following a decline in June.
The spare capacity which highlights the underutilization rate held steady at 11.8% for the period. This was, however, down from 12.3% compared on a yearly basis for the same time period.
Although the data was robust, the labor cost index increased 1.9%. On an annual basis, the labor cost index was however down 1.6% compared to the June quarter of 1.7% decline. The data showed that inflation from labor costs remained subdued which eventually dampens the outlook for inflation.
RBNZ likely to lower GDP forecasts
Besides keeping interest rates steady, the RBNZ is also expected to publish its economic forecasts. The market expectations point to a downgrade in the New Zealand's economy during this week's release. Thus GDP, as well as housing prices, are expected to be downgraded by the RBNZ.
With the New Zealand dollar posting strong losses on the back of the election results, this is expected to give the RBNZ some breathing space, thus ensuring that rate hikes will be pushed out further.
The downgrades come amid the uncertainty in the New Zealand markets as well following the new government that is in power. The NZ First party has repeatedly made its views clear about wanting the central bank to intervene in the currency markets and its preference for a weaker exchange.
With the number uncertainties, as cited by the RBNZ's monetary policy meeting previously the Kiwi dollar could be seen weakening further as the central bank maintains a dovish view.
It Is The Best Of Times, It Is The Worst Of Times? A Bit Of Both, Maybe.
Slow start with range bound USD
A quiet start to the week as investors cautiously watching President Trump every move in Asia. With tensions so high and Trump uncanny ability to trigger controversy, traders are unwilling to further build bullish positions. On Thursday, Trump announced that he intends to nominate Fed Governor Jerome Powell as the next Chair head. Optics form eh republican held senate are that confirmations hearing would take place as soon as possible. A Powell Chair, in our view would look very similar to Yellen's. Policy continuity with a focus on “normalization” of its interest rate and balance sheet should be the dominate strategy. This should result in a move to raise short-term rates in December. Minutes from the 22nd November policy meeting should likely provide additional clarity as to the details of the debate occurring in the FOMC, specifically the reasons for weak inflation reading. Growing indication that lack of trajectory inflation is actually due to shifting structural changes would have a profound effect in the markets interpretation of other central banks suffering from soft inflation despite year of ultra-lose policy. Markets have been trading out inflation outlook, pricing in the mid and long term over the materialized data. In general, over the last 10 years, markets / economics / central bankers have been overly optimistic in expectations. The realizations that further forecast should be lower due to structural changes will have a profound effect especially in FX markets.
On the data-front, the US economy is clicking on all cylinders. Octobers NFP increased by a solid 261k, while below expectations, 3-month average trend remains above 200k new jobs. Personal spending and sentiment data remains solid while ISM manufacturing indicates health expansion in activity. Yet worryingly despite tightening labor market average hourly earnings fell 0.04% m/m, putting wage growth back to a pace of 2.4%. Decent reads but well below what could be expected given unemployment's and even historical recoveries. Finally, House Republicans released a draft of their tax reform bill on Thursday (final version will be released this week) providing the first real look at what the final version might look like. A tax bill will likely provide stocks with a boost but minor stimulate for USD and yields. With strong momentum in growth going into 4Q, traders want to see inflation for re-pricing the Fed benign rate path.
NZD loses ground as inflation expectations slide
NZD/USD paired losses on Monday morning as 2-year inflation expectations eased to 2.02% in the fourth quarter from 2.09% in the previous one. The Kiwi lost another 0.35% against the greenback and stabilised at around $0.6680. After falling as much as 5% over the last four weeks, the Kiwi has been trading with a slight uptrend bias for the last five days. Accordingly, New Zealand rates adjusted to the downside with the 10-year yield dropping to 2.759%, while the 2-year eased to 1.937%.
Although inflation expectations have dropped, the inflation outlook improved substantially as the combined effects of a weaker Kiwi and a more expansionary fiscal policy stance from the new government.
On the technical side, NZD/USD was unable to break the 0.6818 support (low from May 11th) to the downside. However, the market is expecting further downside in NZD/USD as non-commercial short speculative positions reached 11.5% of total open-interest. On the downside, the next support stands at $0.6676 (low from May 2016), while on the upside a resistance lies at around $0.72 (high from October 16th).
XAU/USD Analysis: Falls To 1,266 Amid US PMI Data
As it was expected, formation of a symmetrical triangle pattern embodied anticipation of release of the American data on Friday. As the actual results beat expectations, bears managed to strengthen the buck against the yellow metal by 0.84% just in one hour. There is a need to notice two things. First, a rebound near the 1,266.00 mark can be interpreted as a second reaction low a previously undetected junior ascending channel. This assumption implies gradual movement in the northern direction. However, in short term this recovery looks doubtful due to combined resistance that is forming from the weekly PP at 1,273.35 and the falling 55-, 100- and 200-hour SMAs. There is also a need to take into account an existence of a slope that consists of Sep 7, Oct 15 and Nov 2 maximums.
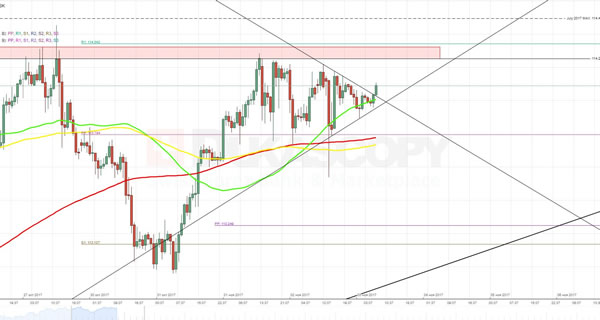
USD/JPY Analysis: Anticipates US Employment Change Release
A release of data that beat analysts’ expectations not only signified a breakout from symmetrical triangle pattern but also provided a necessary impulse to reach the maximum of July 2017 located at the 114.50 level. That fundamental event was also significant for a couple of other reasons. First of all, it became evident that the pair is moving in a new minor ascending channel. Second, an upcoming breakout from that pattern is unlikely due to pressure from the 55-, 100- and 200-hour SMAs that are rising along its southern boundary. This, in turn, implies that currency rate has a good chance to bypass the weekly R1 at 114.69 and reach a combined resistance set up by the monthly R1 and the March 2017 maximum at 115.00 and the slope that started to form in the end of 2015.
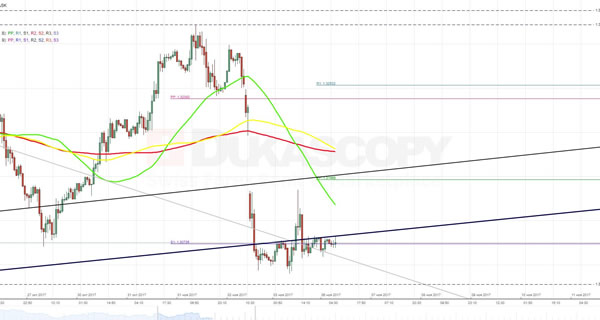
GBP/USD Analysis: Stuck At Monthly S1 At 1.3073
Initially, the Pound tried to restore some and even used a momentum provided by release of better than expected UK Services PMI to climb to the 1.3107 mark. However, the subsequent release of positive American data neutralized this attempt and returned the pair back to the monthly S1 at 1.3073.
Unless traders receive some clear signal the currency rate might continue moving in such indecisive manner for some while. Nevertheless, a pressure from the 100-day SMA on a daily chart is likely to push the pair down even further.
Although an attempt to surge to the 55-hour SMA is possible, but eventually it is still expected to slip to support area near the 1.3030 mark.
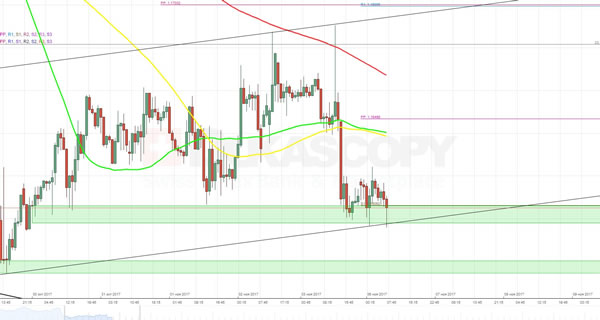
EUR/USD Analysis: Falls To 1.16 Amid Surprising US Data
A release of better that expected data on the US ISM Non-Manufacturing PMI led to sharp appreciation of the buck against the common European currency and resulted in a breakout from two junior ascending channels. An active recovery of the exchange rate seems unlikely, as the northern is contains a bunch of technical indicators, such as the weekly PP at 1.1631 and the falling 55- and 100-hour SMAs. Moreover, there is a slope on a daily chart that is likely to serve as an additional barrier. For this reason, the pair is expected to gradually slip to the bottom towards support area near the 1.1580 mark. However, for now the rate is squeezed between two vises at 1.1625 and 1.1600 and might continue this horizontal movement until catching a proper momentum.
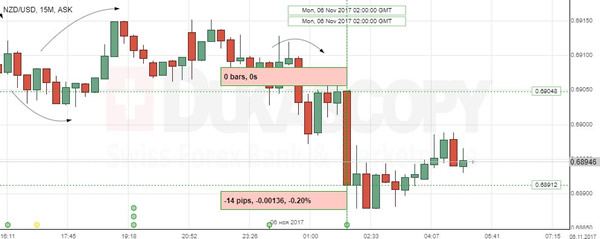
NZD/USD: NZ Inflation Expectations
The Kiwi weakened against the US Dollar after the Reserve Bank of New Zealand diminished its inflation expectations. The NZD/USD currency pair dropped 0.20% or 14 base points to the 0.6894 mark to continue gradual decrease.
The RBNZ quarterly survey showed that inflation growth is likely to remain tepid, adding to expectations for the Central Bank to keep the key interest rate at the record-low level of 1.75%. The Reserve Bank revealed that the country's businesses expect yearly inflation to grow average 1.9% over the next year, compared with a 1.8% growth projection previously. Meanwhile, the Bank’s two-year inflation forecasts fell to 2.0% from 2.1%
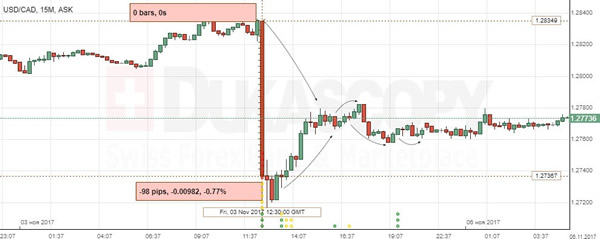
USD/CAD: Canadian Employment Change
The Canadian Dollar rose significantly against the US Dollar as the both North American countries released set of reports on Friday. The USD/CAD currency pair tumbled 98 base points or 0.77% to the 1.273, but tried to recover gradually.
Statistics Canada stated that the economy added 35.3K positions in October, mainly due to higher full-time employment, while the jobless rate rose to 6.3% as more people were seeking a job. The results will be closely watched by the Bank of Canada to decide whether to raise key interest rates again. Meanwhile, there was some strengthening in the wage growth, which could contribute to the Bank’s decision to proceed with monetary tightening.