
Sample Category Title
Trade Idea: GBP/USD – Sell at 1.3170
GBP/USD – 1.3076
New strategy :
Sell at 1.3170, Target: 1.3000, stop: 1.3230
Position: -
Target: -
Stop:-
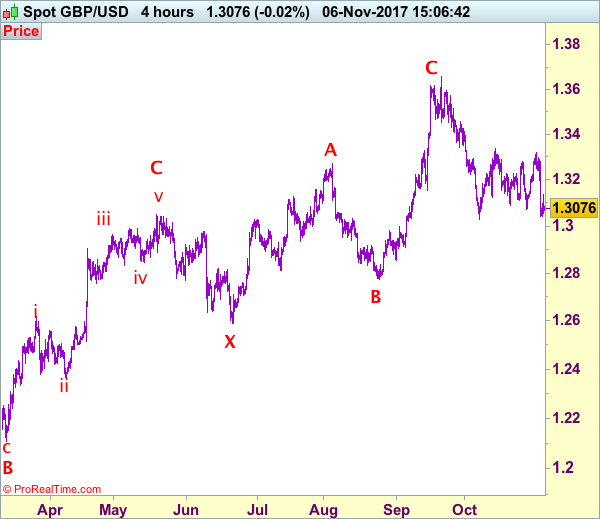
Friday’s selloff together with the breach of previous support at 1.3070 signals early erratic rise from 1.3027 has ended at 1.3338 and bearishness remains for another test of this support, break there would confirm early decline from 1.3658 top has resumed for weakness to psychological support at 1.3000, break there would encourage for further decline towards 1.2950-60 later.
In view of this, would not chase this fall here and would be prudent to sell sterling on recovery as 1.3160-70 should limit upside. Above 1.3020 would defer and prolong choppy consolidation, risk rebound to 1.3250-60 but resistance at 1.3299 should limit upside and price should falter below last week’s high at 1.3321, bring another retreat later. Our preferred count is that (pls see the attached chart) the wave IV is unfolding as a complex double three (ABC-X-ABC) correction with 2nd wave B ended at 1.2774, hence 2nd wave C could have ended at 1.3658.
Our preferred count on the daily chart is that cable's rebound from 1.3500 (wave (A) trough) is unfolding as a wave (B) with A ended at 1.7043, followed by triangle wave B and wave C as well as wave (B) has ended at 1.7192, the subsequent selloff is the larger degree wave (C) which is still unfolding with minor wave (III) of larger degree wave 3 ended at 1.1986, hence wave (IV) correction is in progress which could either be a triangle wave (IV) of a complex formation but upside should be limited to 1.3500 and price should falter well below 1.4000, bring another decline in wave (V) of 3 for weakness to 1.1500, then 1.1200.
Forex: Trump: ‘JOBS, JOBS, JOBS!’
Data released on Friday showed US job growth accelerated in October after hurricane-related disruptions in the prior month, but a sharp retreat in average earnings and an increase in the number of people leaving the workforce caused concern on the robustness of the labor market. Nonfarm payrolls increased by 261K in October as 106K leisure and hospitality workers returned to work. This was the largest gain since July 2016 but below forecasts of an increase of 310K. The data for September was revised to show a gain of 18K jobs instead of the previously reported decline of 33K. Average hourly earnings disappointed the markets, falling by 1%. The reduction results in the year-on-year increase dropping to 2.4%, the smallest since February 2016. In September earnings increased 0.5% lifting the annual increase in that month to 2.9%. Whilst the data was below forecasts, the job growth underscored the recent Fed statement that 'the labor market has continued to strengthen' and has done little to change expectations of a rate hike in December. More upbeat data came in the form of the unemployment rate at 4.1%, a rate not seen in 17 years. President Trump tweeted after the data release 'JOBS, JOBS, JOBS!'
There was more 'up-beat' jobs news on Friday, with Statistics Canada releasing data that showed the Canadian economy added 35,300 jobs in October, as the number of full-time positions swelled by 88,700, while part-time employment dropped by 53,400 jobs. The increase in jobs came as the unemployment rate increased to 6.3%, up from 6.2% in September, as more young people started looking for work. The positive news was short-lived as Statistics Canada also reported a $3.2-billion trade deficit for September compared with an initial estimate of $3.4 billion. The deficit was caused as both exports and imports dropped 0.3% – which signals demand is slowing – as many had anticipated for H2 after the stellar H1 performance.
EURUSD is little changed from Friday’s close. Currently, EURUSD is trading around 1.1612.
USDJPY is at 3+ month highs in early Monday trading at around 114.30.
GBPUSD is little changed in early Monday trading at around 1.3072.
Gold is currently trading around $1,270.
WTI is 0.5% lower in early session trading at around $55.90.
Major data releases for today:
At 08:15 GMT, Markit Economics will release Spanish Services PMI for October. Whilst not normally an impactful data release, the markets will be keen to see what impact the Catalan Independence vote has had on business sentiment in Spain. The forecast is for 55.5 down from September’s release of 56.7. A release wildly away from consensus could see EUR volatility.
At 08:55 GMT, Markit Economics will release German Services and Composite PMI for October. As the largest economy in the Eurozone, the markets will be looking for any indications that German business executives are still confident in the economy. Both releases are expected to come in unchanged with Services PMI at 55.2 and Composite PMI at 56.9. We can expect EUR volatility if the data is significantly off the consensus.
At 9:00 GMT, Markit Economics will release Eurozone Services and Composite PMI for October. Similar to the German PMI releases, the consensus is for an unchanged reading in both. Services is expected unchanged at 54.9 and Composite unchanged at 55.9. We can expect EUR volatility if the data is significantly off the consensus.
At 10:00 GMT, Eurostat will release the Year-on-Year Producer Price Index for September for the Eurozone. The consensus is suggesting a higher reading of 2.8% compared to the previous release of 2.5%. With higher prices, this upward inflationary pressure will provide more indications of a likely rate increase by the ECB sooner rather than later. Expect EUR volatility if the release is wildly different from the consensus.
Trade Idea: GBP/JPY – Sell at 150.20
GBP/JPY - 149.55
New strategy :
Sell at 150.20, Target: 148.20, Stop: 150.80
Position: -
Target: -
Stop:-
Although sterling has rebounded after finding support at 148.70 last week and consolidation above this level would be seen, as the selloff from 151.90 suggests temporary top is possibly formed there, reckon upside would be limited to 150.20-30 and bring another decline later, below said support would add credence to this view, bring retracement of recent rise to 148.00-10, then towards previous support at 147.80 but another support at 147.30 should hold from here.
In view of this, we are looking to sell sterling on further recovery as 150.20-25 should limit upside. Above previous support at 150.60-65 would defer and risk a stronger rebound to 151.10-20, however, still reckon upside would be limited to 151.55-60 and price should falter well below said resistance at 151.90 (last week’s high), bring another retreat later.
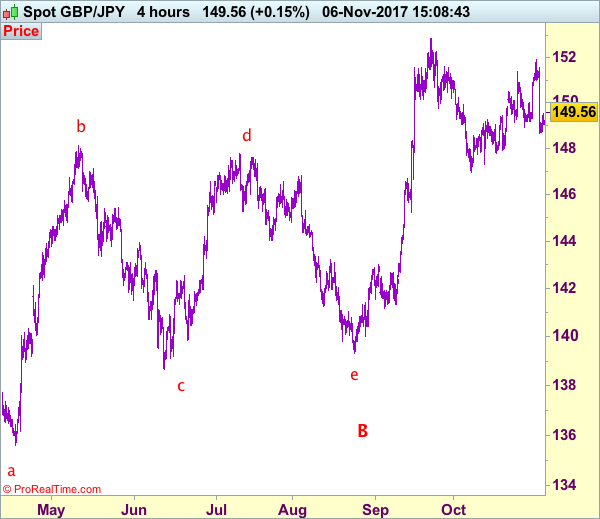
Our preferred count is that larger degree wave V with circle is unfolding from 251.12 with wave (I) 219.34, (II): 241.38 and wave (III) is subdivided into 1: 192.60, 2: 215.89 (23 Jul 2008) and wave 3 ended at 118.87 earlier in 2009. The correction from there to 162.60 is wave 4 which itself is a double three and is labeled as first a-b-c ended at 151.53, followed by wave x at 139.03, 2nd a ended at 162.60, 2nd b at 146.75 and 2nd c leg of wave 4 ended at 163.00. Therefore, the decline from 163.00 to 116.85 is now treated as wave 5 which also marked the end of larger degree wave (III), hence wave (IV) major correction has commenced for retracement of the wave (III) from 241.38 and upside target at 183.95-00 (50% Fibonacci retracement of the wave (II) from 241.38) had been met, a drop below 160.00 would suggest wave (IV) has ended at 195.85, bring decline in wave (V) for initial weakness to 130 (already met) and 120.
EUR/USD Elliott Wave Analysis
EUR/USD – 1.1609
EUR/USD: Wave (c) of 2 ended at 1.3993 and wave 3 of III has commenced for weakness to 1.0411 (1.236 of wave 1), then 1.0000.
The single currency did meet renewed selling interest at 1.1691 late last week (we recommended in our previous update to sell at 1.1665 and a short position was entered) and euro has retreated, adding credence to our bearish count that a temporary top has been made at 1.2093 earlier and downside bias remains for the erratic fall from there to bring retracement of recent rise to 1.1550, then 1.1510-15 (38.2% Fibonacci retracement of 1.0570-1.2093) but reckon downside would be limited to support at 1.1479 and 1.1330-35 (50% Fibonacci retracement) should remain intact, bring rebound later.
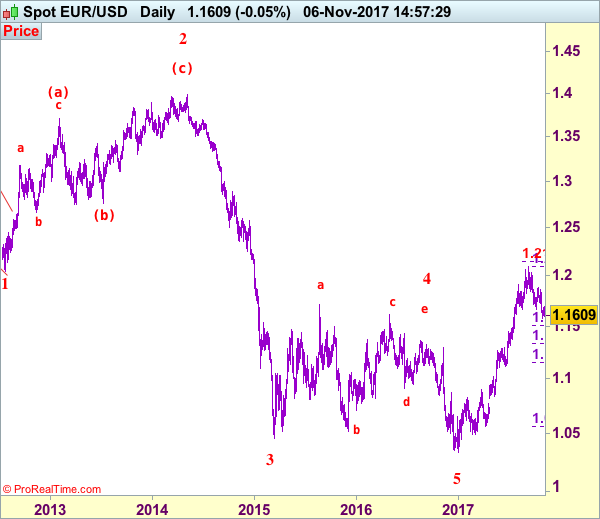
Our preferred count on the daily chart remains that a wave (II) from 1.2329 ended at 1.5145 with A-leg ended at 1.4720, followed by wave B at 1.2457, the wave C from there was also a 3 legged move and is labeled as (a): 1.3739, (b): 1.2885, the wave iii of the 5-waver (c) from 1.2885 has ended at 1.4339 and wave iv is a triangle ended at 1.3878 and wave v formed a top at 1.5145. The decline from there is a 5-waver (C) with minor wave (i) of I of (C) ended at 1.4218 with wave (ii) ended at 1.4580, wave (iii) ended at 1.3267 and wave (iv) ended at 1.3692 and wave (v) ended at 1.1876, this is also the low of wave I of (C) and wave II ended at 1.4940, hence wave III is now in progress with a diagonal wave 1 ended at 1.2042, the breach of previous support at 1.1876 (wave I trough) adds credence to our view that the wave 2 has ended at 1.3993, wave 3 has commenced for further weakness to 1.0411, then towards 1.0000.
On the upside, expect recovery to be limited to 1.1650-60 and said resistance at 1.1691 should remain intact, bring another decline. Only above previous support at 1.1725 would defer and suggest low is possibly formed instead, bring rebound to 1.1790-00 but break of said resistance at 1.1837 is needed to confirm and bring test of key resistance at 1.1880. Looking ahead, only break of 1.1880 resistance would suggest the pullback from 1.2093 has ended, bring further gain to 1.1950-60, then towards 1.2000-05. A break of resistance at 1.2034 would confirm and bring retest of 1.2093, break there would signal recent upmove from 1.0340 low has resumed for headway to 1.2150-55 (61.8% projection of 1.1119-1.1910 measuring from 1.1662), having said that, loss of upward momentum should prevent sharp move beyond 1.2200-10 and price should falter below 1.2255-60, risk from there remains for a much-needed correction to take place later.
Recommendation: Hold short entered at 1.1665 for 1.1465 with stop above 1.1735.
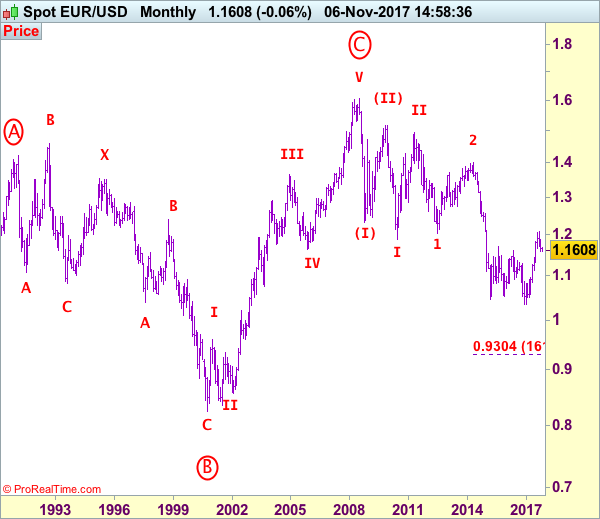
Euro's long-term uptrend started from 0.8228 (26 Oct 2000) with an impulsive structure. The rise from 0.8228 to 0.9593 (5 Jan 2001) is labeled as wave I, the retreat to 0.8352 (6 Jul 2001) is wave II and the rally to 1.3670 (31 Dec 2004) is wave III. Wave IV from there ended at 1.1640 (15 Nov 2005), the subsequent upmove to 1.6040 (July 15, 2008) is treated as wave V, the major selloff from the record high of 1.6040 to 1.2329 (October 27, 2008) signals a reversal has taken place with (I) leg ended at 1.2329 and once (II) ended at 1.5145, wave (III) itself is an extended move with I: 1.1876 and complex wave II ended at 1.4902, wave III has commenced with wave 1 and 2 ended at 1.2042 and 1.3993 respectively, wave 3 of III is now unfolding for weakness towards parity.
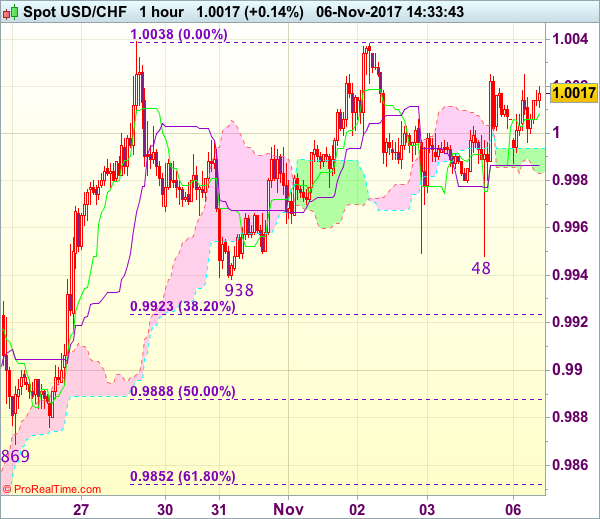
Trade Idea : USD/CHF – Hold long entered at 0.9950
USD/CHF - 1.0023
Most recent candlesticks pattern : N/A
Trend : Up
Tenkan-Sen level : 1.0009
Kijun-Sen level : 0.9987
Ichimoku cloud top : 0.9994
Ichimoku cloud bottom : 0.9983
Original strategy :
Bought at 0.9950, Target: 1.0050, Stop: 0.9930
Position : - Long at 0.9950
Target : - 1.0050
Stop : - 0.9930
New strategy :
Hold long entered at 0.9950, Target: 1.0050, Stop: 0.9950
Position : - Long at 0.9950
Target : - 1.0050
Stop : - 0.9950
As the greenback found renewed buying interest at 0.9948 and has staged another rebound, retaining our bullish view for recent rise to resume after consolidation, above said resistance at 1.0038 would confirm the rise from 0.9421 low has resumed and extend further gain to 1.0050-55, then towards 1.0075-80 but price should falter below 1.0100 chart resistance.
In view of this, we are holding on to our long position entered at 0.9950. Below said support at 0.9938-48 would abort and signal top is formed instead, risk correction to 0.9920-23 (38.2% Fibonacci retracement of 0.9737-1.0038) but 0.9885-90 (50% Fibonacci retracement) should limit downside and support at 0.9869 would remain intact.
Services PMIs Eyed As Europe Eases From Highs
- PMIs to Highlight Improving Economic Outlook Across Eurozone;
- Fed's Dudley to Speak Amid Speculation He is Due to Retire;
- Trump Asia Visit Key This Week.
European equity markets are expected to open a little lower on Monday, coming slightly off their recent highs as traders await PMI survey's from across the euro area.
The services PMIs following the strong manufacturing survey's last week which suggest activity in the region is likely to improve at a good pace in the months ahead. The improved global economic environment has been very supportive of the recovery in the eurozone and today's data from the services sector is expected to further highlight that.
Improvements in the economic outlook is expected to be accompanied by similar advances in investor confidence, with the Sentix survey seen hitting a post-financial crisis high, rising from 29.7 to 30.8. This is particularly important at a time when the central bank is taking its foot off the gas, with there so far being no knee jerk reaction in the markets similar to what we saw in the US in 2013.
This week will likely be a little quieter than last given the absence of quite so many economic events, earnings and significant announcements. That said, we will still get monetary policy decisions from the Reserve Bank of Australia and the Reserve Bank of New Zealand, as well as appearances from a variety of policy makers throughout the week.
The first of these will be William Dudley, the Federal Reserve Bank of New York President and prominent voter on the FOMC, who is scheduled to appear later today. While he is scheduled to speak about lessons from the financial crisis, it has been rumoured of the weekend that he is due to be the latest Trump-era casualty at the Fed.
Dudley is believed to be preparing to announce his retirement which would make him the third permanent member to leave his post in recent months, with Chair Janet Yellen's term coming to an end in February and vice Chair Stanley Fischer having already stepped down. Donald Trump last week confirmed Jerome Powell as Yellen's successor leaving a number of important positions to be filled, as the President shapes the Fed as per his liking.
Trump's visit to Asia will be another focal point for investors this week as he prepares for some intense discussions on trade and North Korea with some key US allies. This morning's press conference with Japanese Prime Minister went as expected, with Trump pushing for fairer trade between the two countries and both maintaining a tough, united North Korea stance.
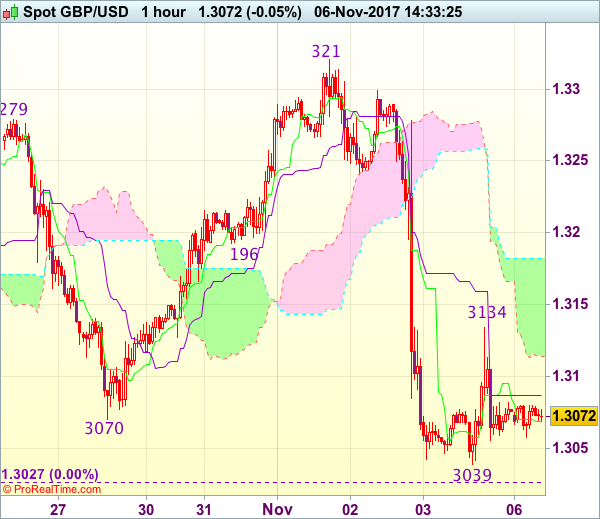
Trade Idea : GBP/USD – Sell at 1.3150
GBP/USD - 1.3071
Most recent candlesticks pattern : N/A
Trend : Near term down
Tenkan-Sen level : 1.3069
Kijun-Sen level : 1.3087
Ichimoku cloud top : 1.3182
Ichimoku cloud bottom : 1.3114
Original strategy :
Sell at 1.3150, Target: 1.3030, Stop: 1.3185
Position : -
Target : -
Stop : -
New strategy :
Sell at 1.3150, Target: 1.3030, Stop: 1.3185
Position : -
Target : -
Stop : -
As cable has remained under pressure after last week’s selloff from 1.3321 to 1.3039, adding credence to our view that early erratic rise from 1.3027 has ended and bearishness remains for further fall towards previous chart support at 1.3027, however, break there is needed to signal early downtrend has resumed for weakness to psychological support at 1.3000, then towards 1.2970-75 which is likely to hold from here due to near term oversold condition.
In view of this, would not chase this fall here and would be prudent to sell cable on recovery as 1.3150 should limit upside and bring another decline later. Above 1.3200 would defer and prolong choppy trading, risk rebound to 1.3235-40 first.
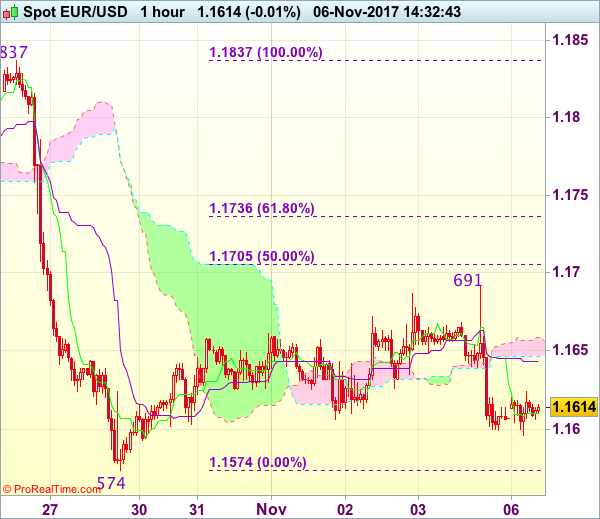
Trade Idea : EUR/USD – Hold short entered at 1.1620
EUR/USD - 1.1612
Most recent candlesticks pattern : N/A
Trend : Down
Tenkan-Sen level : 1.1610
Kijun-Sen level : 1.1644
Ichimoku cloud top : 1.1658
Ichimoku cloud bottom : 1.1647
Original strategy :
Sold at 1.1620, Target: 1.1520, Stop: 1.1655
Position : - Short at 1.1620
Target : - 1.1520
Stop : - 1.1655
New strategy :
Hold short entered at 1.1620, Target: 1.1520, Stop: 1.1655
Position : - Short at 1.1620
Target : - 1.1520
Stop : - 1.1655
The single currency dropped after meeting renewed selling interest at 1.1691, adding credence to our view that top has been formed there and consolidation with downside bias remains for weakness to previous support at 1.1574, however, break there is needed to confirm recent decline has resumed and extend fall to 1.1520-25, then 1.1500 but near term oversold condition should prevent sharp fall below latter level.
In view of this, we are holding on to our short position entered at 1.1620. Above 1.1650-55 would risk another bounce to 1.1691, however, only break there would abort and suggest further choppy trading above 1.1574 and bring a stronger rebound to 1.1700-05 but upside should be limited to previous support at 1.1725 (now resistance).
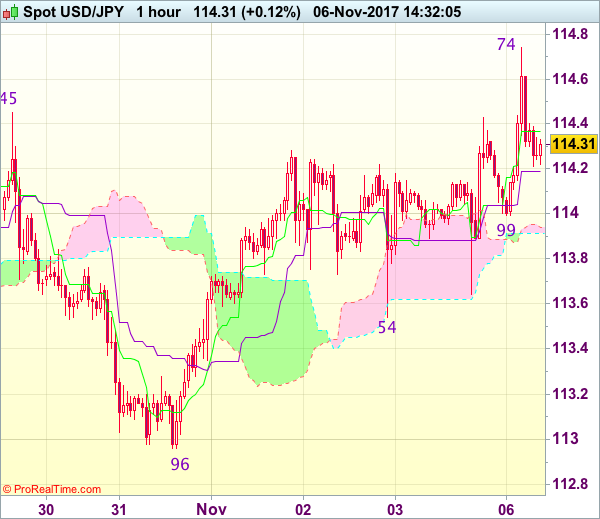
Trade Idea : USD/JPY – Buy at 113.85
USD/JPY - 114.30
Most recent candlesticks pattern : N/A
Trend : Near term up
Tenkan-Sen level : 114.37
Kijun-Sen level : 114.19
Ichimoku cloud top : 113.94
Ichimoku cloud bottom : 113.91
Original strategy :
Buy at 113.80, Target: 114.80, Stop: 113.45
Position : -
Target : -
Stop : -
New strategy :
Buy at 113.85, Target: 114.85, Stop: 113.50
Position : -
Target : -
Stop : -
Although the greenback broke above indicated previous resistance at 114.45-50, lack of follow through buying and current retreat fro 114.74 suggest consolidation below this level would be seen and pullback to 113.95-00 cannot be ruled out, however, reckon 113.75-80 would limit downside and bring another rise later, above said resistance at 114.74 would extend recent upmove from 107.32 to 115.00 but overbought condition should limit upside to another previous resistance at 115.51.
In view of this, we are looking to buy dollar on pullback as 113.80 should limit downside and bring another rise later. Below support at 113.54 would abort and prolong consolidation, risk weakness to 113.20-25, however, reckon support at 112.96 would remain intact, bring another rise later.
Aussie Dollar Trading On A Stronger Footing This Morning
For the 24 hours to 23:00 GMT, the AUD declined 0.82% against the USD and closed at 0.7648 on Friday.
LME Copper prices rose 0.9% or $59.5/MT to $6914.5/MT. Aluminium prices rose 0.6% or $13.0/MT to $2165.0/MT.
In the Asian session, at GMT0400, the pair is trading at 0.7658, with the AUD trading 0.13% higher from Friday’s close.
The pair is expected to find support at 0.7633, and a fall through could take it to the next support level of 0.7609. The pair is expected to find its first resistance at 0.7688, and a rise through could take it to the next resistance level of 0.7719.
Going forward, Australia’s AiG performance of construction index for October, due overnight, along with RBA’s interest rate decision, slated to be released tomorrow.
The currency pair is showing convergence with its 20 Hr moving average and trading below its 50 Hr moving average.
