Sample Category Title
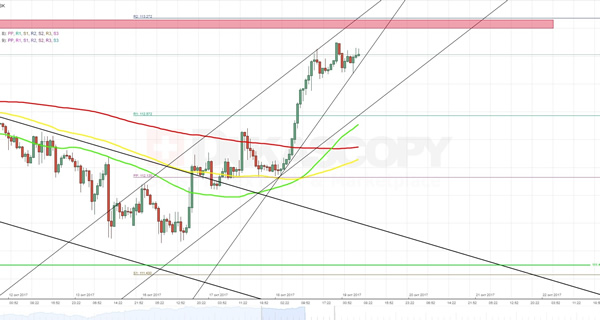
USDJPY Analysis: Rushes To The Top
In result of the previous trading session, the Dollar appreciated against the Yen by 0.82%. In result of such advance the pair has practically returned to the 113.20 level, which represented significant resistance barrier three weeks ago. As now this area is additionally protected by the weekly R2, it seems that the currency rate is going to make a rebound. This assumption is also supported by the fact that in result of the sharp surge the pair formed a short-term rising wedge. Accordingly, it is expected to make a breakout in the southern direction. Finally, there is a need to take into account that on daily chart the pair is about to reach the upper trend-line of a long-term, dominant pattern, which additionally points out on an upcoming rebound.
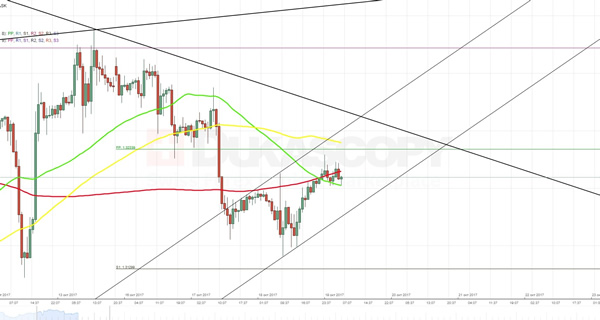
GBPUSD Analysis: Prepares For Another Data Release
Due to release of mixed British employment data, the pair did not get a impulse to make significant moves yesterday. In particular, this relates to three unsuccessful attempts made by bears to push the rate through the 38.2% Fibonacci retracement level at 1.3145. As a result, the new trading session cable started at the intersection of the 55- and 200-hour SMAs. At the moment, the further recovery of the Pound against the Dollar seems complicated, as northern direction is blocked not only by a combination of the weekly PP and the 100-hour SMA but also by the upper trend-line of a senior descending channel. However, a release of better than expected information about the retail sales might create a momentum that would help traders to push the pair either through these barriers or in the opposite direction.
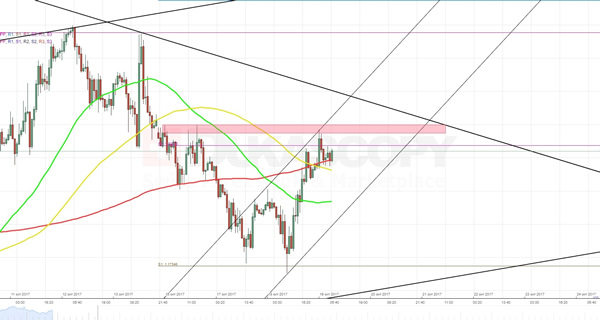
EURUSD Analysis: Fails To Slip Below Weekly S1
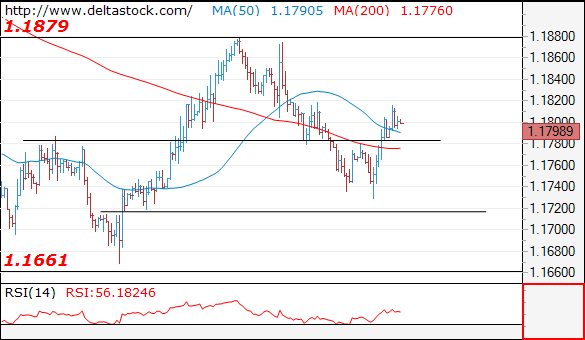
Initially the currency rate was expected to break through the weekly S1 and try to reach the 100% Fibonacci retracement level. However, a release of worse than expected American housing data gave the opposite impulse, which returned the pair back to the weekly PP at 1.1807. On the one hand, the fact that the pair two times in a row failed to slip below the 1.1735 mark and is located now above the 100- and 200-hour SMAs suggests that it might continue to climb to the top. On the other hand, the average market sentiment remains 62%. Moreover, an area near 1.1816 represents a notable resistance, which the pair might struggle to cross. Plus, the further path to the north might be also obstructed by the boundary of a descending channel and the 55-day SMA near 1.184.
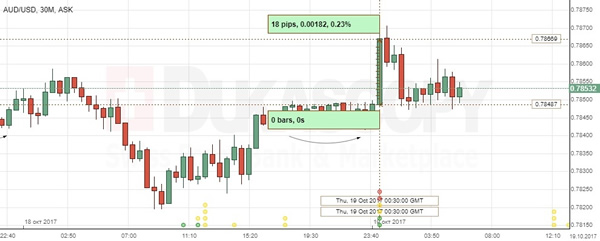
AUD/USD: AU Employment Change
The Australian Dollar jumped markedly against the Greenback, owing to strong job market figures Thursday morning. The AUD/USD exchange rate rose 0.23% or 18 base points to touch the peak of 0.7866, making attempts to continue an upward trend.
The Australian Bureau of Statistics showed that the country's labour marked faced the fastest yearly growth pace, putting the unemployment rate lower. Data showed the Australian employment climbed 19.8K in the prior month, showing the 12th straight month of gains, while unemployment rate fell modestly to 5.5% in the reported period. However, despite improvements in the job market, the pay growth is expected to remain subdued.
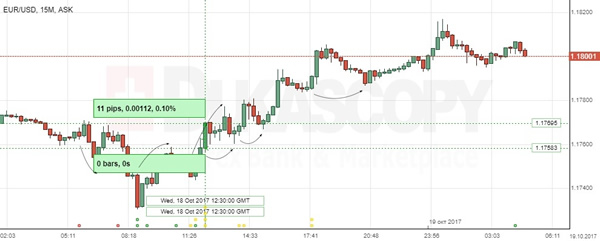
EUR/USD: US Building Permits, Housing Starts
The EUR/USD exchange rate continued gradual increase to get through the 1.1800 level in the wake of the dim US housing market data. Following the release, the Euro gained against its American rival 11 base points or 0.10% to the 1.1769 mark.
The Commerce Department revealed that building permits fell to 1.13M in the month of September, adding to concerns that the recovery of the property market was stalling. Meanwhile, homebuilding in the US dropped to the weakest level in a year in reported period, as Hurricanes Irma and Harvey caused the disruption of single-family homes construction in the South, which could drag the country's GDP growth in the September quarter.
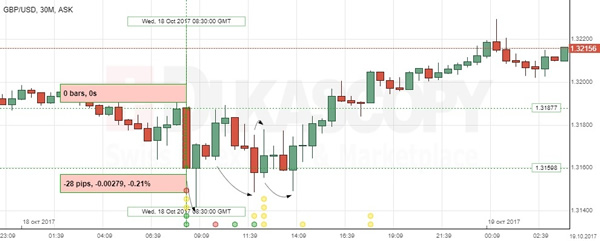
GBP/USD: UK Claimant Count Change
The Sterling was suffering the third straight day of weakness against the US Dollar on mixed job data for Britain yesterday morning. On the report, GBP/USD fell 28 pips or 0.21% to the 1.3159 mark, though the currency pair managed to return into the green area, offsetting losses to start Thursday session near the 1.3220 mark.
The Office for National Statistics' release showed that unemployment claims rose more than estimated by 1.7K in August, while the jobless rate remained unchanged at 4.3% in the same period. Relatively robust employment picture fell short to be translated into strong pay growth, which continued to squeeze the UK consumers and complicated the BoE plans to make interest rate hike.
Asian Equities Flat As China’s GDP Met Expectations
Equities across the Asian markets were trading in a tight, narrow range on Thursday, ignoring solid Chinese data and the new records on Wall Street, where the Dow Jones Industrial Average breached 23,000. FX markets are also struggling for direction, as traders look for signals from E.U. politics, and signs for who will lead the Federal Reserve.
China's economic growth meets expectations
China's GDP expanded 6.8% in the third quarter, slightly below the previous period of 6.9%, but still well above the full-year target of 6.5%. At the beginning of 2017, most of the discussion about the Chinese economy was a "soft vs. hard landing". However, the economy continues to grow at healthy levels, despite the government shifting the focus on the quality of growth vs. quantity. This gives Xi Jinping more leverage, as he seeks to grab greater power over the next five years. In other economic releases, retail sales and industrial production both beat expectations, coming at 10.3% and 6.6%, respectively. Meanwhile, investment growth dipped to 18-year low.
Will Rajoy trigger Article 155?
Euro traders are waiting to see whether Prime Minister Mariano Rajoy will trigger Article 155, if Catalan President, Carles Puigdemont, does not clarify what he meant in his speech last week. The deadline is 08:00 GMT, so expect to see some volatility in the Euro as the European trading session kicks off. It is still unclear how this story will develop, but triggering Article 155 would likely lead to the declaration of independence, and this is will undoubtedly be negative news for the single currency.
U.K. retails sales and E.U. summit
U.K. retail sales is the only tier one economic release in Europe today. Despite falling real wages, spending remained robust in the previous months. Economists expected retail sales to fall 0.1% last month, but figures from the British Retail Consortium, showed that like-for-like sales grew 1.9% in September, thus we can expect an upside surprise in today's release. However, this does not necessarily mean Sterling will rally. Brexit concerns will likely remain the primary driver when E.U. leaders meet later today. The probability of "no-deal" is increasing, and investors should be prepared for the worst. A hard Brexit scenario will not only drag Sterling lower, but it will also probably take European indices with it.
Dow above 23,000, despite Mnuchin warnings
U.S. Treasury Secretary Steve Mnuchin has warned that stocks will fall significantly, if Congress doesn't pass tax reforms. Maybe he's right. The Dow Jones Industrial Average and S&P 500 rallied more than 25% and 20%, respectively, and it's doubtful that this rally was only based on economic growth and earnings expectations. It seems the odds of tax reforms occurring this year, or in the first quarter of 2018 are 50/50, so risks are broadly symmetrical.
EUR/GBP Elliott Wave Analysis
EUR/GBP – 0.8955
Although the single currency retreated after running into resistance at 0.9033, as low has been formed at 0.8746 late last month, reckon downside would be limited to 0.8850-55 and bring another rebound later, above said resistance at 0.9033 would add credence to this view, bring a stronger rebound to 0.9050-60 and possibly 0.9080, having said that, reckon upside would be limited to previous support at 0.9115-20 and price should falter well below resistance at 0.9203, bring another decline later this month.
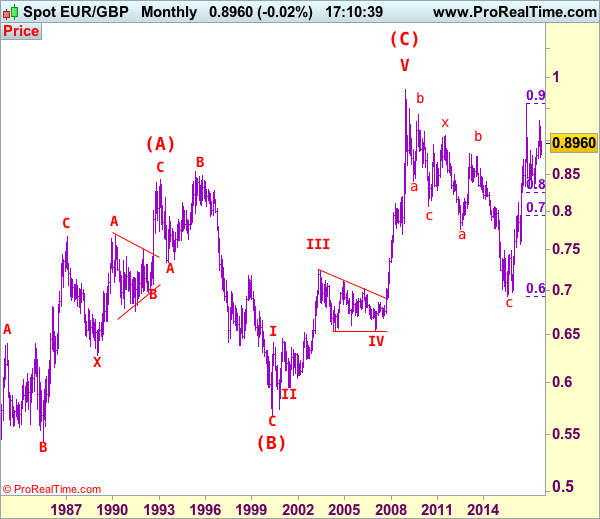
Our latest preferred count is that the wave V of a 5-wave series from 0.5682 ended at 0.9805 earlier and major from there has possibly ended at 0.8067 as A-B-C-X-A-B-C. We are keeping our view that the entire correction from 0.9805 has possibly ended at 0.7756 and as labeled as the attached daily chart and impulsive move from 0.9084 has ended at 0.6938 as a 5-waver which marked as the (C) wave, recent impulsive rise is labeled as (I) (II), (i) (ii) series, indicated upside target at 0.9084 had been met, the retreat from 0.9576 suggest wave iii ended there and next upside target for wave v of (III) should head towards 0.9700 but price should falter well below parity .
On the downside, expect downside to be limited to 0.8900 and 0.8850-55 should hold, bring another rebound later. Below 0.8800-05 would suggest the rebound from 0.8746 has ended instead, bring weakness to 0.8770-75, break there would confirm and bring retest of 0.8746, once this support is penetrated, this would signal the decline from 0.9307 top has resumed for correction of early uptrend to 0.8690-95 (61.8% Fibonacci retracement of 0.8312-0.9307) and possibly towards previous support at 0.8652.
Recommendation: Hold long entered at 0.8880 for 0.9080 with stop below 0.8780
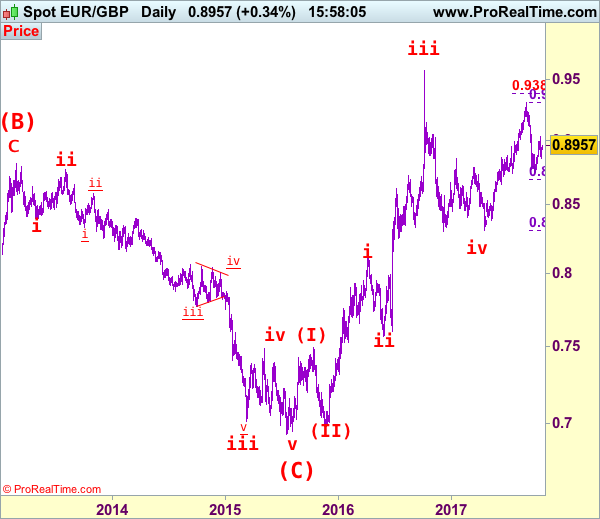
Euro's long term uptrend started in Feb 1981 at 0.5039 and is unfolding as a (A)-(B)-(C) move with (A): 0.8433 (Feb 1993), (B): 0.5682 (May 2000) and impulsive wave (C) should have ended at 0.9805 with wave III ended at 0.7254 (May 2003), triangle wave IV at 0.6536 (23 Jan 2007) and wave V as well as wave (C) has ended at 0.9805.
We are keeping an alternate count that only wave III ended at 0.9805 and the correction from there is the wave IV and has possibly ended at 0.6936, however, it is necessary to see a daily close above resistance at 0.9576 in order to change this to be the preferred count.
USD/CAD Elliott Wave Analysis
USD/CAD – 1.2460
Although the greenback continued trading with a relatively firm undertone after rebounding to 1.2599 earlier this month, a break of this level is needed to signal the corrective rise from 1.2061 low is still in progress for retracement of recent downtrend, then mild upside bias is seen for further gain towards resistance at 1.2663 but loss of near term upward momentum should limit upside to 1.2700-10 and price should falter well below resistance at 1.2778, bring retreat later.
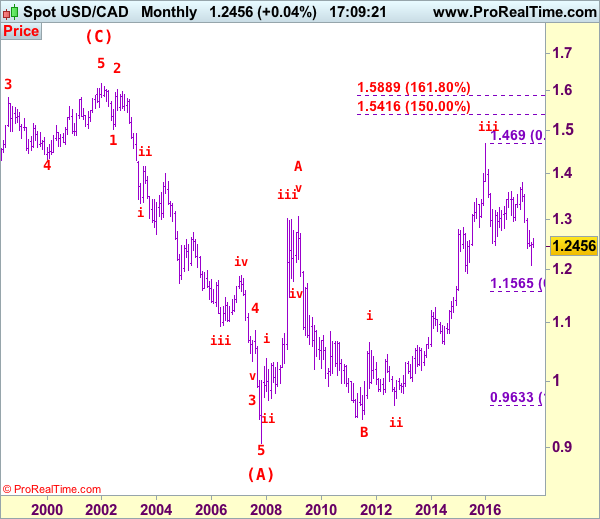
We are keeping our view that the wave b from 1.0657 (a leg top) has possibly ended at 0.9633 with (a): 0.9800, wave (b): 1.0447 and wave c at 0.9633, the subsequent rise from there is now treated as wave c exceeded indicated upside target at 1.3770-80 and 1.4000 and wave (3) has possibly ended at 1.4690 and wave (4) correction has commenced for retracement back towards 1.2000.
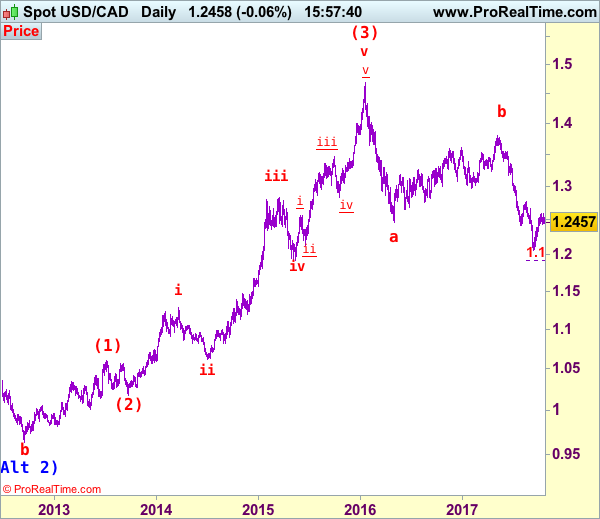
On the daily chart, our latest preferred count remains that the A of (B) rally from 0.9059 low (7 Nov 2007) unfolded into an impulsive wave with i: 0.9059-1.0380, ii ended at 0.9819, iii at 1.3019 followed by triangle wave iv at 1.2026 , then wave v formed a top at 1.3066 and also ended the wave A. The wave B is unfolding as an double three a-b-c-x-a-b-c and is sub-divided as a: 1.2192, b: 1.2716 and wave c at 1.0784, followed by wave x at 1.1725, another set of a-b-c unfolded with 2nd a at 0.9931, 2nd b at 1.0674. the 2nd c has possibly ended at 0.9407, therefore, consolidation with upside bias is seen for major correction, indicated target at 1.3900 had been met and gain to 1.4700 would follow.
On the downside, whilst initial pullback to 1.2433, then 1.2400 cannot be ruled out, reckon downside would be limited to support at 1.2336 and if our view that low has been formed at 1.2061 is correct, renewed buying interest should emerge around support at 1.2254 and bring another rebound later. Only a daily close below said support at 1.2254 would suggest the rebound from 1.2061 has ended, bring test of another previous support at 1.2197 first. We are keeping our bearish count that wave b ended at 1.3794 and wave c has commenced for further fall towards psychological support at 1.2000.
Recommendation: Buy at 1.2255 for 1.2555 with stop below 1.2155.
Longer term - The selloff from 1.6194 (21 Jan 2002) to 0.9059 (07 Nov 2007) is viewed as (A) wave which is a 5-waver as labeled on the monthly chart as below, the subsequently rally is labeled as (B) with impulsive A leg of (B) ended at 1.3066, wave B of (B) is unfolding which has either ended at 0.9407 or would extend one more fall but downside should be limited to 0.9200 and 0.9000 should hold.
Forex Technical Analysis: EUR/USD, USD/JPY, GBP/USD
EUR/USD
Current level - 1.1798
The intraday bias is positive above 1.1780 static support, but my outlook is rather counter-trend, for a reversal and another downswing towards 1.1720 target mark.
| Resistance | Support | ||
| intraday | intraweek | intraday | intraweek |
| 1.1820 | 1.1940 | 1.1780 | 1.1660 |
| 1.1880 | 1.2030 | 1.1720 | 1.1480 |
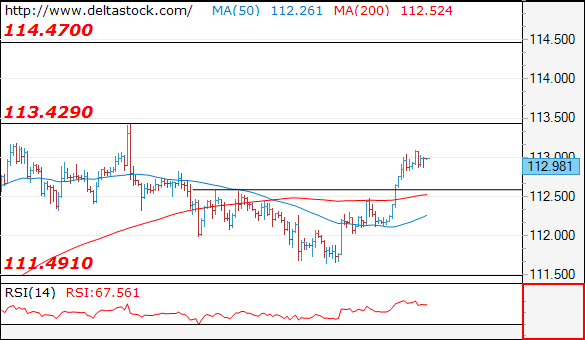
USD/JPY
Current level - 112.98
The bias remains positive, for a rise towards 113.40, en route to 114.50. Key support lies at 112.60.
| Resistance | Support | ||
| intraday | intraweek | intraday | intraweek |
| 113.40 | 114.50 | 112.60 | 111.00 |
| 114.50 | 114.50 | 111.50 | 107.30 |
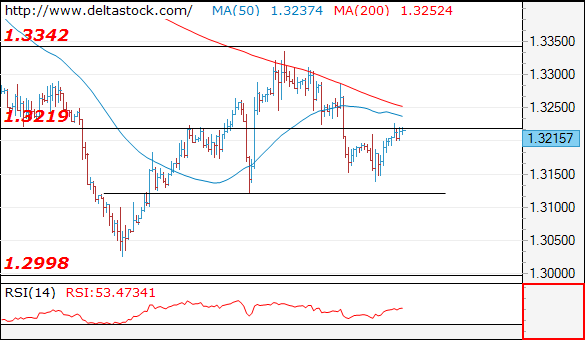
GBP/USD
Current level - 1.3215
Still in the consolidation range between 1.3220 and 1.3120 and I favor a break on the downside, towards 1.3000 area.
| Resistance | Support | ||
| intraday | intraweek | intraday | intraweek |
| 1.3220 | 1.3340 | 1.3220 | 1.2910 |
| 1.3340 | 1.3650 | 1.3120 | 1.2760 |