
Sample Category Title
Trade Idea: GBP/USD – Hold short entered at 1.3315
GBP/USD – 1.3192
Original strategy :
Sold at 1.3315, Target:1.3115, Stop: 1.3290
Position: - Short at 1.3315
Target: - 1.3115
Stop: - 1.3290
New strategy :
Hold short entered at 1.3315, Target:1.3115, Stop: 1.3290
Position: - Short at 1.3315
Target: - 1.3115
Stop:- 1.3290
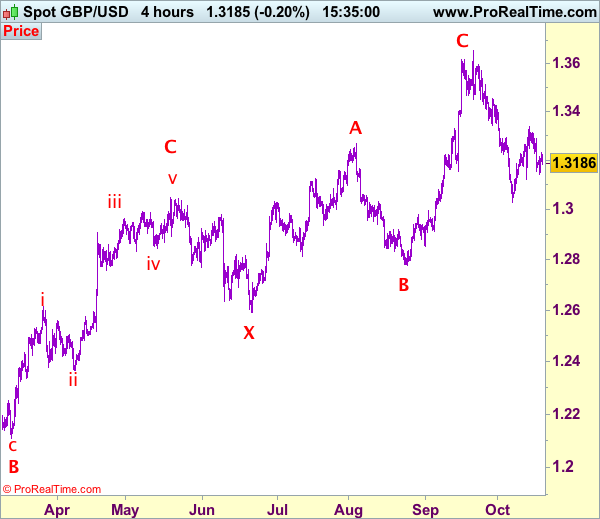
Although cable found support at 1.3140 yesterday and recovered, if our view that top has been formed at 1.3338 late last week is correct, upside should be limited and price should falter well below indicated resistance at 1.3287 and bring another decline to 1.3140, then test of indicated support at 1.3121, however, break there is needed to signal the rebound from 1.3027 has ended, bring further fall to 1.3065-75, then retest of said support at 1.3027.
In view of this, we are holding on to our short position entered at 1.3315. Only above indicated resistance at 1.3312-15 would risk test of said resistance at 1.3338 (last week’s high), break there would abort and signal low has been formed at 1.3027 instead, bring at least a correction of the fall from 1.3658 top to 1.3390-00 later. Our preferred count is that (pls see the attached chart) the wave IV is unfolding as a complex double three (ABC-X-ABC) correction with 2nd wave B ended at 1.2774, hence 2nd wave C could have ended at 1.3658.
Our preferred count on the daily chart is that cable's rebound from 1.3500 (wave (A) trough) is unfolding as a wave (B) with A ended at 1.7043, followed by triangle wave B and wave C as well as wave (B) has ended at 1.7192, the subsequent selloff is the larger degree wave (C) which is still unfolding with minor wave (III) of larger degree wave 3 ended at 1.1986, hence wave (IV) correction is in progress which could either be a triangle wave (IV) of a complex formation but upside should be limited to 1.3500 and price should falter well below 1.4000, bring another decline in wave (V) of 3 for weakness to 1.1500, then 1.1200.
Trade Idea: GBP/JPY – Stand aside
GBP/JPY - 148.82
New strategy :
Stand aside
Position: -
Target: -
Stop:-
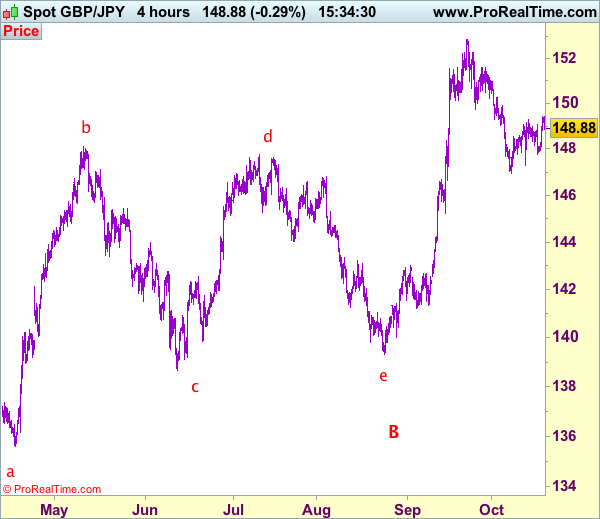
Despite intra-day marginal rise to 149.44, lack of follow thorough buying and current retreat suggest consolidation would be seen and pullback to 148.40-45 cannot be ruled out, however, reckon downside would be limited to 148.00 and support at 147.80 should hold, bring further consolidation. Above said resistance at 149.44 would signal the erratic rise from 146.95 is still in progress for retracement of the fall from 152.85 to 149.90-00 and possibly test of resistance at 150.25 but still reckon upside would be limited to 150.90-00 and bring another decline later.
On the downside, only a break below said support at 147.78 would shift risk to downside and signal the rebound from 146.95 has ended, bring weakness to another previous support at 147.30, below would confirm and then retest of 146.95 would follow. Looking ahead, once this level is penetrated, this would confirm the fall from 152.85 top has resumed for retracement of recent upmove to 146.60-65 and then 146.00, having said that, loss of momentum should limit downside and previous support at 145.25 should remain intact.
Our preferred count is that larger degree wave V with circle is unfolding from 251.12 with wave (I) 219.34, (II): 241.38 and wave (III) is subdivided into 1: 192.60, 2: 215.89 (23 Jul 2008) and wave 3 ended at 118.87 earlier in 2009. The correction from there to 162.60 is wave 4 which itself is a double three and is labeled as first a-b-c ended at 151.53, followed by wave x at 139.03, 2nd a ended at 162.60, 2nd b at 146.75 and 2nd c leg of wave 4 ended at 163.00. Therefore, the decline from 163.00 to 116.85 is now treated as wave 5 which also marked the end of larger degree wave (III), hence wave (IV) major correction has commenced for retracement of the wave (III) from 241.38 and upside target at 183.95-00 (50% Fibonacci retracement of the wave (II) from 241.38) had been met, a drop below 160.00 would suggest wave (IV) has ended at 195.85, bring decline in wave (V) for initial weakness to 130 (already met) and 120.
Trade Idea: EUR/JPY – Stand aside
EUR/JPY - 133.21
Original strategy:
Sold at 132.90, Target: 130.90, Stop: 133.50
Position: - Short at 132.90
Target: - 130.90
Stop: - 133.50
New strategy :
Stand aside
Position: -
Target: -
Stop:-
Euro’s rise from 131.66 turned out to be much stronger than expected and indicated resistance at 133.50 was penetrated, dampening our bearishness and upside risk remains for further gain to 133.90-00, however, only break of previous resistance at 134.41 would confirm early upmove has resumed and extend headway to 135.00-10 and later towards 135.50-60.
In view of this, would not chase this rise here and would be prudent to stand aside for now. below 132.50-60 would suggest the rebound from 131.66 has ended instead, bring weakness to previous resistance at 132.38 but only break there would add credence to this view and revive bearishness for weakness to 132.00, then test of 131.84 support but said support at 131.66 should hold from here.
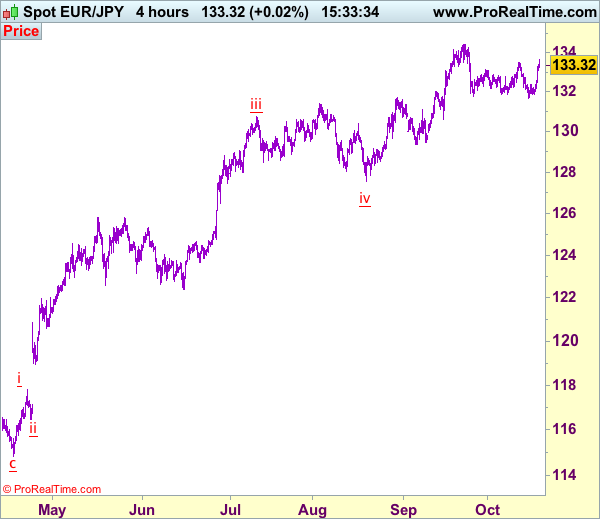
Our latest preferred count is that wave (ii) is ABC-X-ABC which ended at 123.33 and wave (iii) is unfolding with wave iii ended at 100.77, followed by wave iv at 111.57 and wave v as well as the wave (iii) has ended at 97.04, followed by wave (iv) at 111.43 and wave (v) has ended at 94.12 which is also the end of the larger degree v, this also implied the major wave (C) has also ended there, hence major correction has commenced from there with (A) leg unfolding in its lower degree wave c which has possibly ended at 145.69. Under this count, A-B-C wave (B) has commenced with A leg ended at 136.23, wave B at 143.79 and wave C has possibly ended at 149.79.
Our larger degree count is that the decline from 139.26 is wave (C) and is sub-divided into a diagonal triangle i-ii-iii-iv-v with wave i - 105.44, wave ii- 123.33, wave iii - 97.03, wave iv - 111.43, followed by the final wave v as well as the end of wave (C) at 94.12, this also mark the bottom of larger degree wave B. Under this count, major rise in wave C has commenced as an impulsive wave with minor wave III ended at 145.69, wave V is still in progress for further gain to 150.00. Having said that, this so-called wave V could well be the first leg of larger degree 5-waver wave C and this wave C should bring at least a retest of wave A top at 169.97 (July 2008).
Trade Idea: AUD/USD – Hold short entered at 0.7875
AUD/USD – 0.783365
Original strategy:
Sold at 0.7875, Target: 0.7700, Stop: 0.7900
Position: - Short at 0.7875
Target: - 0.7700
Stop:- 0.7935
New strategy :
Hold short entered at 0.7875, Target: 0.7700, Stop: 0.7890
Position: - Short at 0.7875
Target: - 0.7700
Stop:- 0.7890
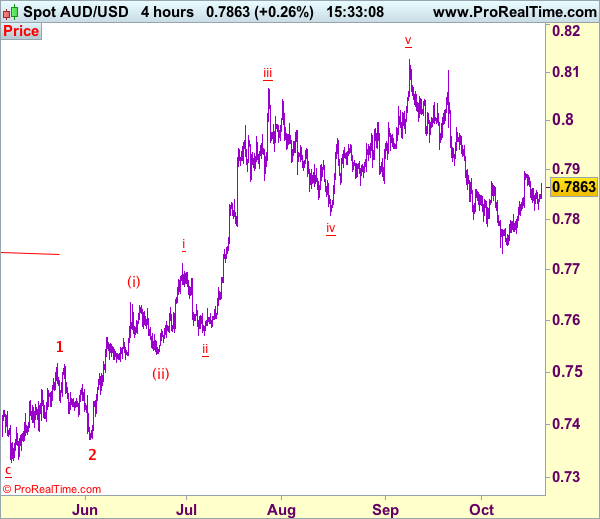
Aussie found support at 0.7818 and has rebounded again today, suggesting caution on our short position entered at 0.7875 but as long as indicated resistance at 0.7897 (last week’s high) holds, prospect of another retreat remains, below said support at 0.7818 would retain bearishness and bring weakness to 0.7800, break there would add credence to our view that top has been formed at 0.7897, bring test of 0.7770-75, then retest of said support at 0.7733, below there would signal recent fall from 0.8125 top has resumed for weakness to 0.7700-10 and later towards 0.7660-65.
In view of this, we are holding on to our short position entered at 0.7875. Only above previous support at 0.7908 (now resistance) would defer and risk a stronger rebound to 0.7950 but resistance at 0.7986 should remain intact and bring another decline later.
On the 4-hour chart, recent upmove from 0.7329 is unfolding as an impulsive rise with wave 3 as well as smaller degree wave (iii) extending, only minor wave v of (iii) has ended at 0.8125, hence bullishness remains for this move to extend headway to 0.8200, then towards 0.8300, however, reckon upside would be limited to 0.8400 and the final wave 5 should falter below 0.8500, bring correction later.
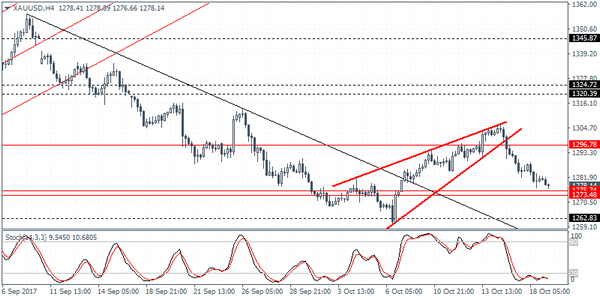
XAUUSD Intraday Analysis
XAUUSD (1287.14): Gold prices were seen extending the declines yesterday as price approaches the support level of 1275 - 1274. The declines come following the breakdown from the rising wedge pattern and the test of support will complete the measured move. From the support level, gold prices could be seen establishing support which could see an upside bounce in prices. Resistance at 1296 will be in focus as a result, and a breakout above this resistance level is required to post further gains.
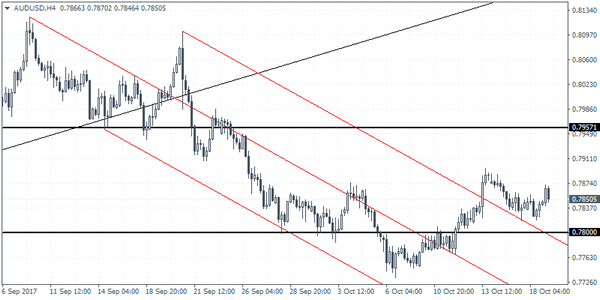
AUDUSD Intraday Analysis
AUDUSD (0.7850): The AUDUSD was seen giving back the gains yesterday and today's price action saw prices rallying briefly. With the breakout from the falling median line, we do expect AUDUSD to push higher. However, in the near term, the downside could see prices retesting the recently broken resistance level at 0.7800. Establishing support at this price level could potentially signal a correction to the upside with 0.7957 as the eventual target. In the event that the support fails to hold near 0.7800, the bias will shift to the downside with AUDUSD likely to post further declines.
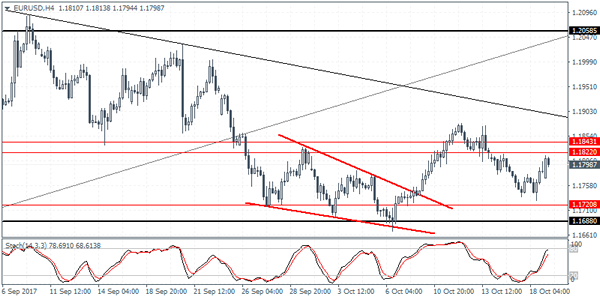
EURUSD Intraday Analysis
EURUSD (1.1798): The EURUSD managed to close on a bullish note as the common currency was seen pushing to make further gains in the early trading session today. Price action managed to recover most of the declines in the past days as the EURUSD approaches the key resistance level of 1.1822. However, as long as price action is subdued below this resistance level, the bias remains to the downside. Support at 1.1720 will be a key level for the EURUSD. A breakdown below this level could suggest further declines. However, we expect the sideways range to be maintained in the near term.
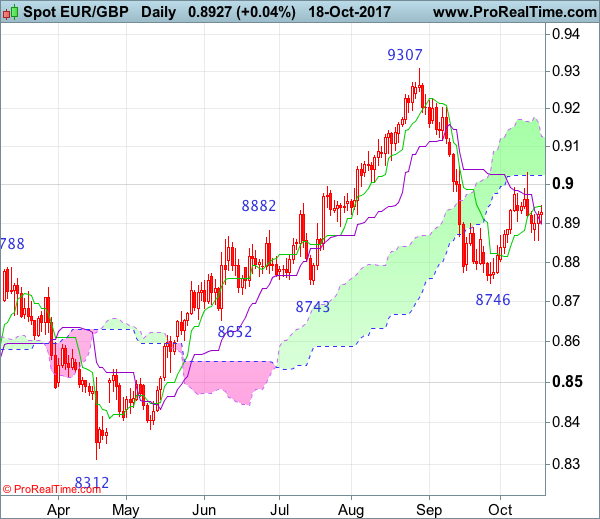
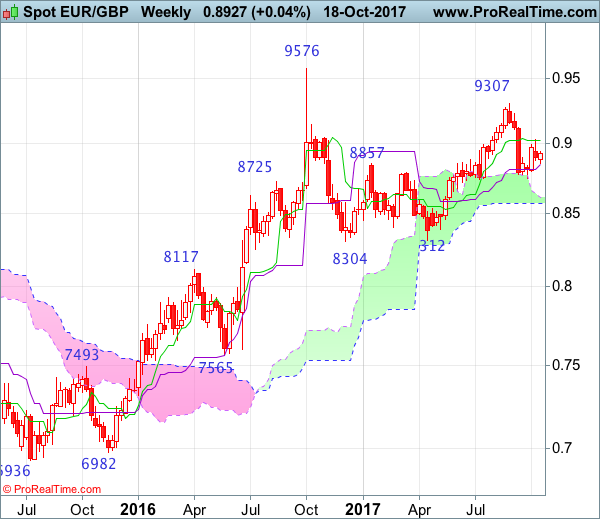
EUR/GBP Candlesticks and Ichimoku Analysis
Weekly
• Last Candlesticks pattern: N/A
• ime of formation: N/A
• Trend bias: Near term up
Daily
• Last Candlesticks pattern: Shooting star
• Time of formation: 29 Aug 2017
• Trend bias: Down
EURGBP – 0.8954
Although the single currency rose to as high as 0.9033 late last week, the subsequent retreat suggests top is possibly formed there and consolidation with mild downside bias is seen for weakness to 0.8855-60, then towards 0.8800 but break of latter level is needed to signal the rebound from 0.8746 has ended, bring retest of this level later. Looking ahead, only a drop below 0.8746 would signal early fall from 0.9307 top has resumed and extend weakness towards 0.8690-95 (61.8% Fibonacci retracement of 0.8312-0.9307) but previous support at 0.8652 would hold.
On the upside, whilst initial recovery to 0.8990-00 cannot be ruled out, reckon said resistance at 0.9033 would cap upside and bring further consolidation. Only break there would suggest a temporary low has been formed at 0.8746, bring a stronger rebound to 0.9050-60, however, reckon upside would be limited to 0.9110-15 and as top has been formed at 0.9307, reckon upside would be limited to 0.9150 and price should falter below 0.9203, bring another leg of corrective decline later this month.
Recommendation: Stand aside for this week.
On the weekly chart, despite last week’s brief bounce to 0.9033, the subsequent retreat formed a black candlestick with a long upper shadow (a shooting star alike), suggesting the recovery from 0.8746 has possibly ended there and consolidation with mild downside bias is seen for weakness to 0.8800-05, however, break there is needed to signal another leg of decline from0.9307 top is underway for test of said support at 0.8746, break there would bring retracement of early upmove to 0.8690-95 (61.8% Fibonacci retracement of 0.8312-0.9307) and possibly support at 0.8562 but reckon downside would be limited to the lower Kumo (now at 0.8571) and previous resistance at 0.8531 should turn into support and contain euro’s downside.
On the upside, expect recovery to be limited to 0.9000 and said resistance at 0.9033 should hold, bring further consolidation, break of 0.9033 would suggest the retreat from 0.9307 has possibly ended, bring recovery to 0.9060-70, however, if our view that top has been formed at 0.9307 is correct, upside would be limited to 0.9120-25 and price should falter well below 0.9203, bring another leg of decline later this month.
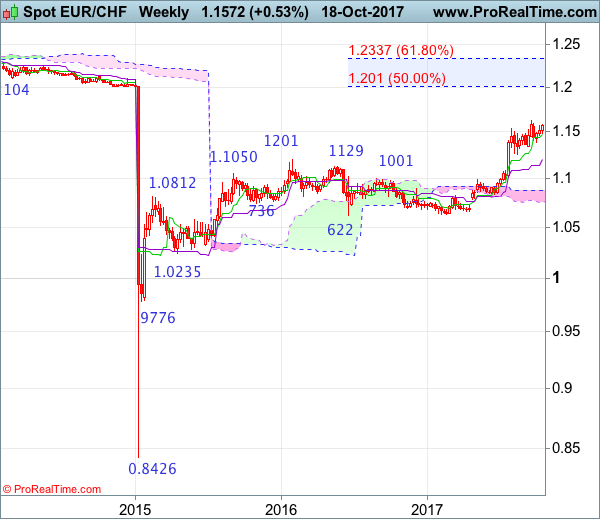
EUR/CHF Candlesticks and Ichimoku Analysis
Weekly
• Last Candlesticks pattern: Long white candlestick
• Time of formation: 24 Jul 2017
• Trend bias: Up
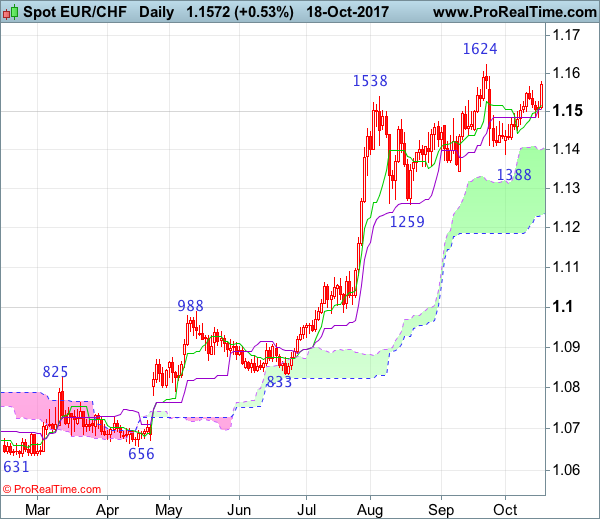
Daily
• Last Candlesticks pattern: Morning doji
• Time of formation: 25 Jul 2017
• Trend bias: Up
EUR/CHF – 1.1570
As the single currency found renewed buying interest at 1.1485 and has risen again, suggesting near term upside risk remains for the rebound from 1.1388 to extend gain towards recent high at 1.1624, however, break there is needed to signal recent upmove has resumed and extend gain towards 1.1695-00 (61.8% projection of 1.0833-1.1538 measuring from 1.1260), having said that, loss of upward momentum should prevent sharp move beyond 1.1770-80 and reckon 1.1800-10 would hold from here, risk from there is seen for a retreat to take place later.
On the downside, below said support at 1.1485 would prolong consolidation and bring weakness to the upper Kumo (now at 1.1402), however, break of support at 1.1388 is needed to revive our bearishness and signal a temporary top has been formed at 1.1624, bring retracement of recent upmove to support at 1.1345, then towards 1.1300 but another previous support at 1.1259 should hold from here and euro shall head north again from there.
Recommendation: Exit short entered at 1.1520 for 1.1320 with stop above 1.1620.
On the weekly chart, although euro has continued edging higher after finding support at 1.1388, as long as last month’s high at 1.1624 holds, further consolidation would be seen and prospect of another retreat remains, below 1.1485 would bring weakness towards 1.1388, however, break there is needed to suggest a temporary top is possibly formed, bring test of 1.1345 support, once this level is penetrated, this would provide confirmation, bring retracement of recent rise to 1.1300, then towards another previous support at 1.1259 but price should stay above the Kijun-Sen (now at 1.1140) and bring rebound later.
On the upside, only break of said last month’s high at 1.1624 would signal the major rise from 0.8426 low has once again resumed and extend headway to 1.1695-00 (61.8% projection of 1.0833-1.1538 measuring from 1.1260), then towards 1.1760-70 but overbought condition should prevent sharp move beyond 1.1840-50 and reckon 1.1900-10 would hold from here, risk from there has increased for a retreat to take place later.
Australia Unemployment Rate Falls To 5.5%
The monthly employment report from Australia released earlier today showed that the unemployment rate fell to 5.5% in September and down from 5.6% seen the month before. In the monthly employment change, the economy was seen adding 19.8k jobs, which was higher than the estimated 14.1k. Previous month's figures were adjusted down to show 52k jobs being added, down from 54.2k.
Data from China showed that the GDP registered a 6.8% expansion in the third quarter. This was in line with estimates, and the data comes as the China party congress gets underway.
The US dollar was seen stalling after data released yesterday showed that building permits and housing starts rose less than expected.
Looking ahead, economic data includes the UK's retail sales figures which are expected to show a decline of 0.1% on the month. The US trading session will see the weekly unemployment claims followed by the Philly Fed manufacturing index.