
Sample Category Title
Markets Will Continue To Watch The Developments In Catalonia
Market movers today
Today we have only second tier data releases, with the US Empire manufacturing PMI being the most interesting.
Markets will continue to watch the developments in Catalonia, with a deadline set by the Spanish PM Rajoy to the Catalan president Puigdemont expiring today, regarding clarification of his independence declaration.
Later in the week, we have China's Communist party congress kicking-off, which will have important implications for the future reform progress in China or hear our short video on the congress on YouTube. Chinese President Xi Jinping gives his opening speech on Wednesday.
UK. PM Theresa May is in Brussels meeting with the EU's chief Brexit negotiat or Michel Barnier and head of EU commission Jean-Claude Juncker trying to unlock the Brexit negotiations ahead of the EU summit later this week.
Furthermore, markets will continue to scrutinise central bank speakers during the week for any hints on ECB, Fed and BoE policy direction in 2018.
Selected market news
Over the weekend, a bunch of central comments from the IMF gathering. Fed's Yellen reiterated 'my best guess is that these soft (inflation) readings will not persist' supporting our view that the Fed is hiking in December despite another lower-than-expected US CPI inflation print published Friday, see FOMC minutes. The main argument is still that strong growth will tighten the labour market further, which will eventually push wage growth higher, and hence inflation. On the ECB, all comments echoed the recent communication confirming that the council is moving towards the point that next week's QE extension will be a 'lower for longer ' one. In short , it appears that the ECB has managed to pre-announce the bulk of next week's decision and a 50% reduction in the QE purchases to 30bn is probably market consensus by now.
While central banks are turning more hawkish, they are only doing so slowly due to continuing low inflation. This in combination with the strong global business cycle and low risks are good for equities and Asian stocks are up this morning (also European and US stock futures are point ing higher). Brent oil is trading higher at USD57.9 per barrel, as fight ing between Iraq and Kurdish forces has broken out . Overnight , Chinese CPI inflation in September was 1.6% as expected (down from 1.8% in August ), while PPI inflation rose to 6.9% from 6.3%, which is the highest since April.
In Austria, the general election result Sunday confirmed the anticipated strong result for the right wing parties with the People Party led by Kurtz set to take power (possibly supported by the populist Freedom Party).
In Germany, the social democrats (SPD) surprisingly won the local election in Lower Saxony ahead of Angela Merkel's government coalition talks this week and some argue that the result is another sign of the fall in Merkel's popularity, see FT.
Currencies: Dollar ‘Survives’ Mixed US Data
Sunrise Market Commentary
- Rates: Thin eco calendar suggests directionless action
Confident comments by heavyweight central bankers on inflation and higher oil prices hang in the balance with election outcomes and the approaching Catalan deadline for the Bund this morning. We still shun Spanish assets because of the binary risk while the October 26 ECB meeting and a thin calendar could keep investors side-lines this week. - Currencies: Dollar 'survives' mixed US data
A soft USD CPI weighed temporary on the dollar on Friday, but part of the loss was reversed later indicating some USD resilience. The eco calendar will probably only be of second tier importance for USD trading. Yellen keeping the door open for a December rate hike helps to prevent further USD losses. Uncertainty on Catalonia might be slightly euro negative.
The Sunrise Headlines
- US stocks started strong on Friday, supported by strong US retail sales, but gains evaporated into the close. Nasdaq outperformed with a new record close. Asian bourses gais more than 0.5% overnight with China lagging.
- Austria's far-right nationalist Freedom party has scored its best result in a national election for two decades (26%) and is likely to join the country's next government with the mainstream conservative People's party (31.6%)
- Germany's Social Democrats have won a surprise victory in regional elections in Lower Saxony, in a blow to Angela Merkel's conservatives days before they launch delicate talks in Berlin on forming a three-way coalition government.
- Fed Chair Yellen kept the door open for another increase in short-term interest rates this year, but sounded a note of caution on still weak inflation in the US and abroad.
- China's factory prices jumped more than estimated in September (6.9% Y/Y), as domestic demand remained resilient and the government continued to reduce excess industrial capacity. Consumer price gains matched projections (1.6% Y/Y).
- Oil markets jumped this morning on concerns over potential renewed US sanctions against Iran as well as conflict in Iraq, while an explosion at a US oil rig and reduced exploration activity supported prices there.
- Today's eco calendar is very thin with only EMU trade balance and US empire manufacturing. Catalan President Puigdemont has a Madrid-imposed deadline to clarify the region's independence stance
Currencies: Dollar 'Survives' Mixed US Data
USD 'survives' soft US CPI
US data dominated global FX markets on Friday. Retail sales were strong, but inflation was slightly softer than expected. The latter initially was the more important factor, weighing on the dollar. EUR/USD jumped to the 1.1875 area. However, the dollar this time showed quite some resilience, especially against the euro. A very strong Michigan consumer confidence supported an intraday USD rebound. EUR/USD finished the session at 1.1820, even marginally lower from Thursday. USD/JPY finished the day at 111.82 (compared to 112.28 on Thursday).
The risk rally continues overnight as most Asian equity indices show solid gains. Major central bankers met in Washington this weekend. They saw a further improvement in the global economy. Yellen reiterated that she expects soft inflation readings not to persist. Also ECB top-policy makers expect inflation to pick up. The BoJ still indicates to pursue aggressive monetary easing, but BoJ Kuroda warned that markets might be too complacent when pricing geopolitical risks. USD/JPY profits only modestly from CB signals of ongoing policy divergence between the US/EMU and Japan or from the risk rally. USD/JPY trades near 112. The dollar is better bid against the euro. EUR/USD trades in the low 1.18 area.
The October NY Fed Empire State manufacturing survey is the only important eco release today. The headline index stood at a very high 24.4 in September. Consensus expects a modest decline to 20.5. We expect the October business surveys to remain strong, but have no good arguments to distance us from consensus. Later this week, the US eco calendar is rather light. Housing data recently showed signs of peaking. Will this be confirmed? Few Fed governors are scheduled to speak. The Eurozone eco calendar contains only second tier releases this week. The ECB black-out period before the October 26 meeting kicks in on Thursday, but ECB Constancio (Tuesday), Draghi, Praet and Coeuré (Wednesday) still appear in public. Political developments are plentiful. Catalonia has to respond to Madrid's ultimatum and the EU Summit (Thursday-Friday) will discuss the Brexit negotiations. In the US, the tax reform processes will be closely followed, as well as the Nafta re-negotiation.
The eco data will probably only be of second tier importance today. The dollar showed quite some resilience after an initial negative reaction to Friday's US CPI. The ST picture of EUR/USD remains neutral, but Friday's price action might give EUR/USD bears some confidence
The reaction could have been more negative for the dollar. There is plenty of event risk. Catalonia is the first in row and could be slightly negative for the euro. We start the week with a neutral-to-tentatively negative bias for EUR/USD. The day-to-day picture of USD/JPY is less convincing.
From a technical point of view, EUR/USD dropped below the 1.1823/ 1.2070 consolidation pattern last week, but no real test of the 1.1662 support occurred. Last week, the pair even returned (temporary?) above the 1.1823 previous range bottom, which was disappointing for EUR/USD bears. Friday's US data were unable to give clear guidance. We maintain a cautious sell-on upticks bias. However, the pair needs to drop below the 1.1670/62 support to really give comfort to EUR/USD bears. The USD/JPY momentum was constructive in September. The pair regained 110.67/95 (previous resistance), a short-term positive. The 114.49 correction top is the next important resistance. The rally clearly lost momentum last week. A break beyond 114.49 looks ever more difficult.
EUR/USD: Friday's US data give no clear guidance. Dollar shows tentative signs of resilience.
EUR/GBP
EUR/GBP drifting back south, below 0.89
Thursday's roller-coaster ride of sterling finally turned out in favour of the UK currency. (FX) markets still saw the glass half full rather than half empty on Friday on headlines that the EU considers a transition period, something the UK is aiming for. Enthusiasm eased later in the session on comments from Germany and EU Juncker who highlighted that the Brexit process remains extremely difficult. EUR/GBP rebounded (temporary?) back above 0.89, but sterling maintained most of Thursday's rebound. EUR/GBP finished the session at 0.8898. Cable spiked north of 1.33, partially due to USD weakness after the 'soft' US inflation, but closed the session at 1.3285.
There are no important UK eco data today. Global factors and headlines/rumours on Brexit might dominate sterling trading. A series of key eco data later this week might decide on the viability of a BoE rate hike in the near future. In a day-to-day perspective, euro softness due to Catalan uncertainty might weigh on EUR/GBP.
EUR/GBP staged a strong uptrend since April to set a top at 0.9307 late August. UK price data and hawkish BoE comments reinforced a sterling rebound. Medium term, we maintain a EUR/GBP buy-on-dips approach as we expect the mix of euro strength and sterling softness to persist. The prospect of (limited) withdrawal of BoE stimulus triggered a good sterling countermove, but this rebound has run its course. EUR/GBP supports at 0.8743 and 0.8652 are difficult to break. We look to buy EUR/GBP on dips. The recent rebound above 0.89 improved the ST technical picture of EUR/GBP, but for now there were no convincing follow-through gains. EUR/GBP 0.9026 is the 50% retracement of the recent countermove.
EUR/GBP rebound loses momentum
EUR/USD Elliott Wave Analysis
EUR/USD – 1.1800
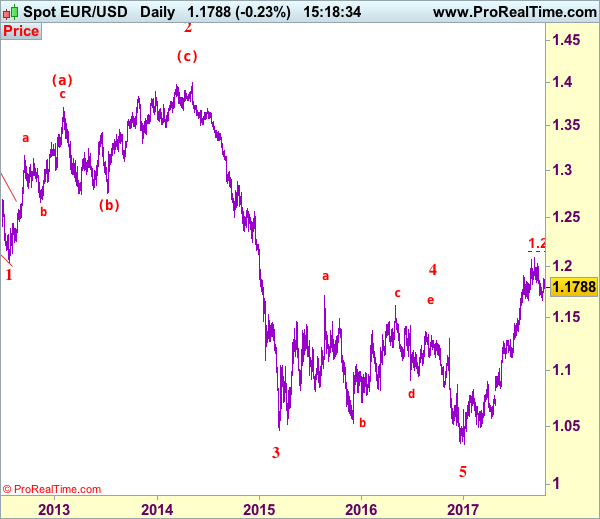
EUR/USD: Wave (c) of 2 ended at 1.3993 and wave 3 of III has commenced for weakness to 1.0411 (1.236 of wave 1), then 1.0000.
Although the single fell to as low as 1.1669 earlier this month, as euro found good support there and has staged a strong rebound, suggesting the pullback from 1.2093 has possibly ended there, hence consolidation with upside bias is seen for further gain to 1.1900-10, then 1.1950-60, however, reckon upside would be limited to 1.2005 and bring further consolidation. Only break of resistance at 1.2034 would confirm and bring retest of 1.2093, break there would confirm recent upmove from 1.0340 low has resumed for headway to 1.2150-55 (61.8% projection of 1.1119-1.1910 measuring from 1.1662), having said that, loss of upward momentum should prevent sharp move beyond 1.2200-10 and price should falter below 1.2255-60, risk from there remains for a much-needed correction to take place later.
Our preferred count on the daily chart remains that a wave (II) from 1.2329 ended at 1.5145 with A-leg ended at 1.4720, followed by wave B at 1.2457, the wave C from there was also a 3 legged move and is labeled as (a): 1.3739, (b): 1.2885, the wave iii of the 5-waver (c) from 1.2885 has ended at 1.4339 and wave iv is a triangle ended at 1.3878 and wave v formed a top at 1.5145. The decline from there is a 5-waver (C) with minor wave (i) of I of (C) ended at 1.4218 with wave (ii) ended at 1.4580, wave (iii) ended at 1.3267 and wave (iv) ended at 1.3692 and wave (v) ended at 1.1876, this is also the low of wave I of (C) and wave II ended at 1.4940, hence wave III is now in progress with a diagonal wave 1 ended at 1.2042, the breach of previous support at 1.1876 (wave I trough) adds credence to our view that the wave 2 has ended at 1.3993, wave 3 has commenced for further weakness to 1.0411, then towards 1.0000.
On the downside, expect pullback to be limited to 1.1770-75 and price should stay well above said support at 1.1669, bring another rise later. A drop below 1.1669 would signal the corrective fall from 1.2093 top is still in progress for retracement of recent rise to previous support at 1.1662 (previous 4th of a lesser degree), break there would extend weakness to 1.1600-10 and possibly 1.1550-60 but reckon downside would be limited to 1.1500 and support at 1.1479 should remain intact, bring rebound later.
Recommendation: Buy at 1.1765 for 1.1965 with stop below 1.1665.
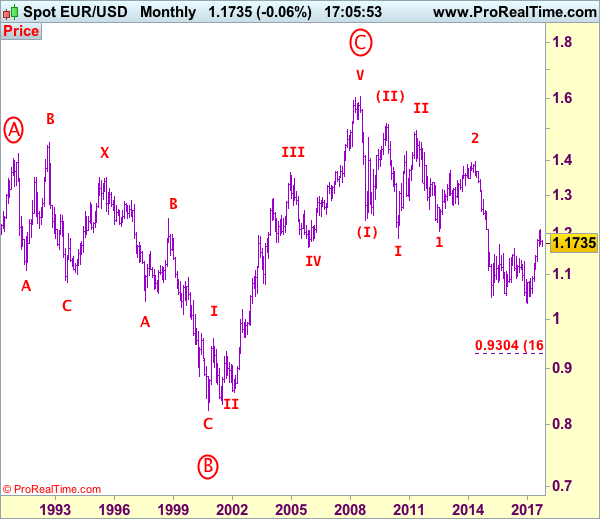
Euro's long-term uptrend started from 0.8228 (26 Oct 2000) with an impulsive structure. The rise from 0.8228 to 0.9593 (5 Jan 2001) is labeled as wave I, the retreat to 0.8352 (6 Jul 2001) is wave II and the rally to 1.3670 (31 Dec 2004) is wave III. Wave IV from there ended at 1.1640 (15 Nov 2005), the subsequent upmove to 1.6040 (July 15, 2008) is treated as wave V, the major selloff from the record high of 1.6040 to 1.2329 (October 27, 2008) signals a reversal has taken place with (I) leg ended at 1.2329 and once (II) ended at 1.5145, wave (III) itself is an extended move with I: 1.1876 and complex wave II ended at 1.4902, wave III has commenced with wave 1 and 2 ended at 1.2042 and 1.3993 respectively, wave 3 of III is now unfolding for weakness towards parity.
USD/JPY Elliott Wave Analysis
USD/JPY - 111.85
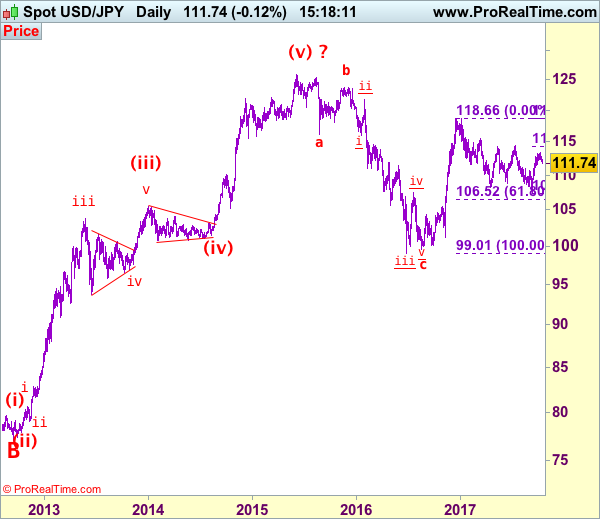
USD/JPY – Wave V of larger degree circle V has possibly ended at 75.31 and major correction has commenced and already met indicated target at 125.00.
Dollar’s retreat after early brief rise to 113.44 has retained our view that consolidation below this level would be seen and initial downside bias remains for correction to previous support at 111.47, however, reckon downside would be limited and renewed buying interest should emerge around 111.10-15 and bring another rise later, above resistance at 112.83 would signal the retreat from 113.44 has ended and bring retest of this resistance, break there would signal the rise from 107;32 low has resumed and extend further gain to 114.00, then towards 114.30-35 (61.8% Fibonacci retracement of 118.66-107.32 but still reckon resistance at 114.50 would hold on first testing and price should falter below 115.00, bring retreat later.
Our preferred count is that, triangle wave IV (with circle) ended at 101.45 and the circle wave V brought dollar down to the record low of 75.31 in 2011 and the subsequent rebound signal major correction has commenced with A leg ended at 84.19, followed by wave B at 77.14 and impulsive wave C is now unfolding (indicated upside target at 125.00 had been met) for gain towards 127.00 level. In the event dollar drops below support at 99.01, this would confirm medium term decline from 125.86 top (2015 high) has resumed for subsequent weakness to 98.00 and possibly 97.00.
Under this count, this wave C is unfolding as impulsive waves with (1) (2), 1 2 ended at 80.67, 79.07, 82.84 and 81.69 respectively, hence the extended wave 3 has ended at 103.74 and wave 4 correction of recent upmove should bring weakness to 92.57, then towards 90.88 but psychological support at 90.00 should limit downside and bring another rally later in wave 5, indicated target at 125.00 had been met and gain to 127.00 cannot be ruled out but reckon price would falter below 130.00.
On the downside, whilst pullback to 111.47 support is likely, reckon another support at 111.11 would limit downside and bring another rise to aforesaid upside targets later. A daily close below 111.11 would defer and risk weakness to 110.50-60, then towards 110.00 but support at 109.55 should remain intact. Only a drop below strong support at 109.55 would abort and suggest the rebound from 107.32 has ended instead, risk weakness to 109.00 and possibly 108.50-60 but price should stay well above said support at 107.32 and bring another rebound later.
Recommendation: Buy at 111.15 for 113.15 with stop below 110.15.
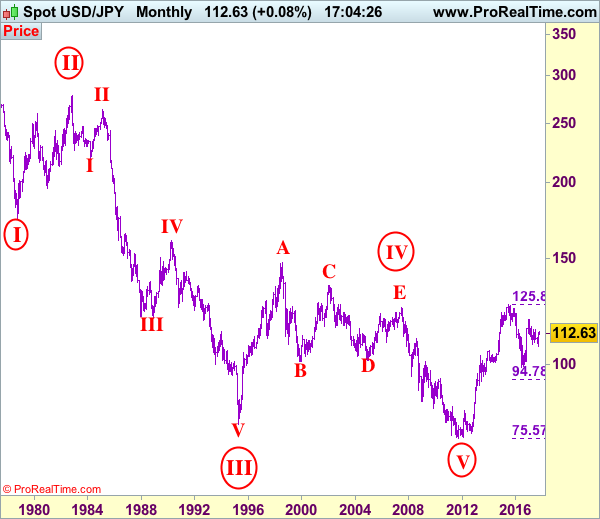
On the monthly chart, we have changed our preferred count that an impulsive wave is unfolding with major wave III with circle ended at 79.75, then followed by wave IV with circle and is labeled as a triangle with A: 147.64 (11 August, 1998), B: 101.25, C: 135.20, D: 101.67 and E leg ended at 124.14 to end the wave IV with circle. Hence, wave V with circle commenced from there and hit a record low of 75.31, however, the subsequent strong rebound signals this circle wave V has possibly ended there, hence gain to (indicated upside target at 122.00 and 125.00 had been met), the retreat from 125.86 suggests wave A of major correction has ended there and wave B correction back to 99.00, then 95.00 would be seen, however, reckon downside would be limited to 90.00, bring another rebound in wave C next year.
Trade Idea: GBP/USD – Hold short entered at 1.3315
GBP/USD – 1.3284
Original strategy :
Sold at 1.3315, Target:1.3115, Stop: 1.3375
Position: - Short at 1.3315
Target: - 1.3115
Stop: - 1.3375
New strategy :
Hold short entered at 1.3315, Target:1.3115, Stop: 1.3375
Position: - Short at 1.3315
Target: - 1.3115
Stop:- 1.3375
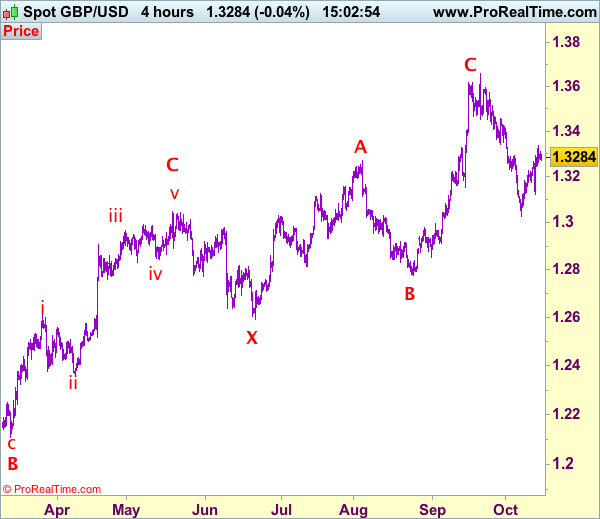
Although cable rose to as high as 1.3338 on Friday, the subsequent retreat has retained our near term bearishness and as long as resistance at 1.3338-43 holds, mild downside bias remains for another retreat, below 1.3245 would bring weakness to 1.3195-00 but only break of said support at 1.3121 would signal the rebound from 1.3027 has ended, bring weakness to 1.3065-75, then retest of said support at 1.3027.
In view of this, we are holding on to our short position entered at 1.3315. Above previous support at 1.3343 would abort and signal low has been formed instead, bring at least a correction of the fall from 1.3658 top to 1.3390-00 later. Our preferred count is that (pls see the attached chart) the wave IV is unfolding as a complex double three (ABC-X-ABC) correction with 2nd wave B ended at 1.2774, hence 2nd wave C could have ended at 1.3658.
Our preferred count on the daily chart is that cable's rebound from 1.3500 (wave (A) trough) is unfolding as a wave (B) with A ended at 1.7043, followed by triangle wave B and wave C as well as wave (B) has ended at 1.7192, the subsequent selloff is the larger degree wave (C) which is still unfolding with minor wave (III) of larger degree wave 3 ended at 1.1986, hence wave (IV) correction is in progress which could either be a triangle wave (IV) of a complex formation but upside should be limited to 1.3500 and price should falter well below 1.4000, bring another decline in wave (V) of 3 for weakness to 1.1500, then 1.1200.
Trade Idea: GBP/JPY – Stand aside
GBP/JPY - 148.55
New strategy :
Stand aside
Position: -
Target: -
Stop:-
As sterling found good support at 147.30 and rebounded late last week, suggesting further consolidation above 146.95 support would be seen and upside risk remains for the rebound from 146.95 to bring retracement of the fall from 152.85 to 149.90-00 and possibly test of resistance at 150.25 but still reckon upside would be limited to 150.90-00 and bring another decline next week.
On the downside, expect pullback to be limited to 148.00 and bring another rebound. Below 147.95-00 would suggest top is possibly formed, bring weakness towards said support at 147.30 but break there is needed to revive bearishness and bring retest of 146.95. Looking ahead, once this level is penetrated, this would confirm the fall from 152.85 top has resumed for retracement of recent upmove to 146.60-65 and then 146.00, having said that, loss of momentum should limit downside and previous support at 145.25 should remain intact.
Our preferred count is that larger degree wave V with circle is unfolding from 251.12 with wave (I) 219.34, (II): 241.38 and wave (III) is subdivided into 1: 192.60, 2: 215.89 (23 Jul 2008) and wave 3 ended at 118.87 earlier in 2009. The correction from there to 162.60 is wave 4 which itself is a double three and is labeled as first a-b-c ended at 151.53, followed by wave x at 139.03, 2nd a ended at 162.60, 2nd b at 146.75 and 2nd c leg of wave 4 ended at 163.00. Therefore, the decline from 163.00 to 116.85 is now treated as wave 5 which also marked the end of larger degree wave (III), hence wave (IV) major correction has commenced for retracement of the wave (III) from 241.38 and upside target at 183.95-00 (50% Fibonacci retracement of the wave (II) from 241.38) had been met, a drop below 160.00 would suggest wave (IV) has ended at 195.85, bring decline in wave (V) for initial weakness to 130 (already met) and 120.

Trade Idea: EUR/JPY – Sell at 132.70
EUR/JPY - 132.55
Original strategy:
Sell at 132.95, Target: 130.95, Stop: 133.55
Position: -
Target: -
Stop: -
New strategy :
Sell at 132.70, Target: 130.95, Stop: 133.30
Position: -
Target: -
Stop:-
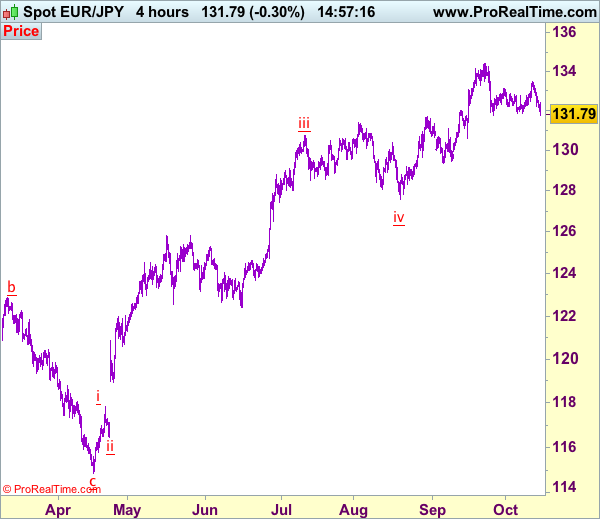
As the single currency has dropped again after brief recovery, suggesting the decline from 134.41 top is still in progress and bearishness remains for this move to bring retracement of recent upmove, hence further fall to 131.35-40, then 130.95-00 would be seen, however, near term oversold condition should limit downside to support at 130.62 and reckon psychological support at 130.00 would remain intact.
In view of this, we are looking to reinstate short on recovery as 132.70-75 should limit upside. Only above indicated resistance at 133.50 would abort and risk further gain towards 134.00 but only break there would signal the correction from 134.41 has ended at 131.75, bring retest of this recent high. Once this level is penetrated, this would confirm recent uptrend has resumed and extend headway to 135.00-10 and later 135.50-60.
Our latest preferred count is that wave (ii) is ABC-X-ABC which ended at 123.33 and wave (iii) is unfolding with wave iii ended at 100.77, followed by wave iv at 111.57 and wave v as well as the wave (iii) has ended at 97.04, followed by wave (iv) at 111.43 and wave (v) has ended at 94.12 which is also the end of the larger degree v, this also implied the major wave (C) has also ended there, hence major correction has commenced from there with (A) leg unfolding in its lower degree wave c which has possibly ended at 145.69. Under this count, A-B-C wave (B) has commenced with A leg ended at 136.23, wave B at 143.79 and wave C has possibly ended at 149.79.
Our larger degree count is that the decline from 139.26 is wave (C) and is sub-divided into a diagonal triangle i-ii-iii-iv-v with wave i - 105.44, wave ii- 123.33, wave iii - 97.03, wave iv - 111.43, followed by the final wave v as well as the end of wave (C) at 94.12, this also mark the bottom of larger degree wave B. Under this count, major rise in wave C has commenced as an impulsive wave with minor wave III ended at 145.69, wave V is still in progress for further gain to 150.00. Having said that, this so-called wave V could well be the first leg of larger degree 5-waver wave C and this wave C should bring at least a retest of wave A top at 169.97 (July 2008).
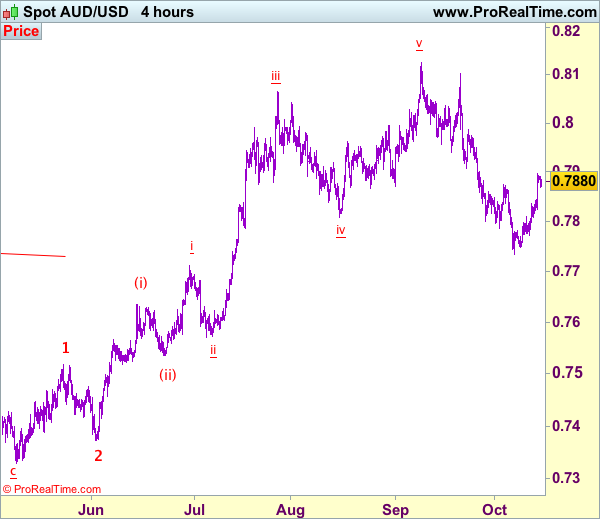
Trade Idea: AUD/USD – Hold short entered at 0.7875
AUD/USD – 0.7878
Original strategy:
Sold at 0.7875, Target: 0.7700, Stop: 0.7935
Position: - Short at 0.7875
Target: - 0.7700
Stop:- 0.7935
New strategy :
Hold short entered at 0.7875, Target: 0.7700, Stop: 0.7935
Position: - Short at 0.7875
Target: - 0.7700
Stop:- 0.7935
Friday’s late rise suggests the rebound from last week’s low of 0.7733 is still in progress and near term upside risk remains for marginal gain, however, as this move is viewed as retracement of recent decline, reckon upside would be limited and bring retreat later, below 0.7800 would bring test of 0.7770-75, break there would signal top is formed, then retest of said support at 0.7733 would follow, below there would confirm recent fall from 0.8125 top has resumed for weakness to 0.7700-10 and later towards 0.7660-65.
In view of this, we are holding on to our short position entered at 0.7875. Above previous support at 0.7908 (now resistance) would defer and risk a stronger rebound to 0.7950 but resistance at 0.7986 should remain intact and bring another decline later.
On the 4-hour chart, recent upmove from 0.7329 is unfolding as an impulsive rise with wave 3 as well as smaller degree wave (iii) extending, only minor wave v of (iii) has ended at 0.8125, hence bullishness remains for this move to extend headway to 0.8200, then towards 0.8300, however, reckon upside would be limited to 0.8400 and the final wave 5 should falter below 0.8500, bring correction later.
EUR/USD Candlesticks and Ichimoku Analysis
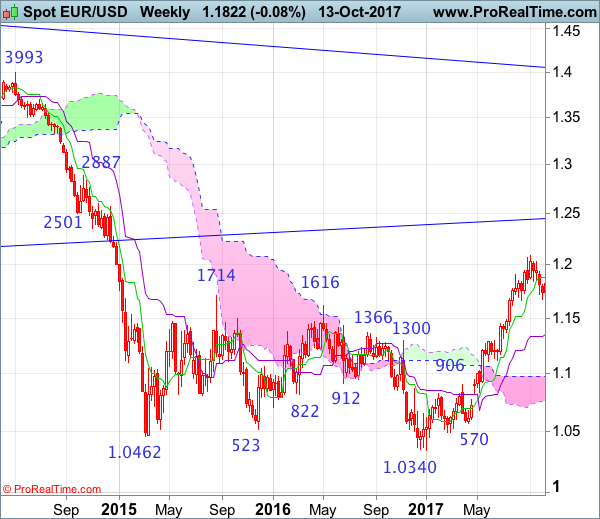
Weekly
• Last Candlesticks pattern: Shooting star
• Time of formation: 31 Jul 2017
• Trend bias: Near term up
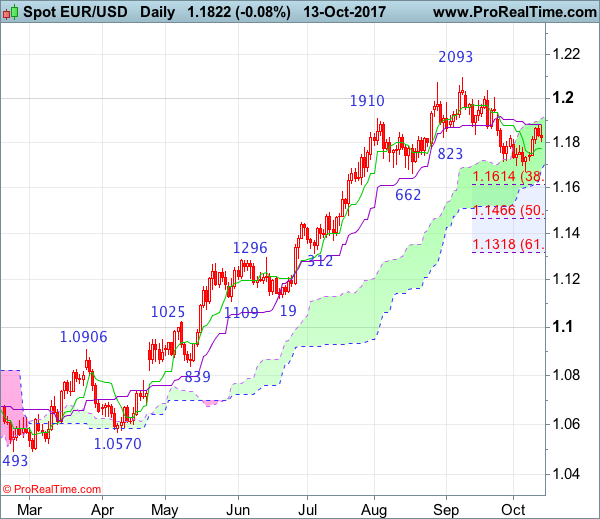
Daily
• Last Candlesticks pattern: Shooting star
• Time of formation: 2 Aug 2017
• Trend bias: Up
EUR/USD – 1.1800
The single currency found good support at 1.1659 earlier this month and has staged a strong rebound, adding credence to our view that the fall from 1.2093 has formed a temporary low there and consolidation with mild upside bias is seen for test of 1.1875-80 (current level of the Kijun-Sen and last week’s high), however, break there is needed to retain bullishness and extend the rise from 1.1669 low to 1.1935-40, having said that, as broad outlook remains consolidative, reckon indicated resistance at 1.2005 would limit upside and price should falter below 1.2035, bring another retreat later.
On the downside, although initial pullback to the Tenkan-Sen (now at 1.1775) cannot be ruled out, reckon 1.1755-60 would hold and bring another rebound later. Only a drop below indicated support at 1.1662-69 would abort and signal the corrective decline from 1.2093 top is still in progress for retracement of early upmove to 1.1595-00, break there would bring subsequent fall to 1.1550, then towards 1.1500, having said that, previous support at 1.1479 should limit downside and 1.1466 (50% Fibonacci retracement of 1.0839-1.2093) should hold on first testing.
Recommendation: Buy at 1.1775 for 1.1975 with stop below 1.1675.
On the weekly chart, as euro has rebounded last week after finding support at 1.1669 and a white candlestick was formed, suggesting consolidation above this level would be seen with mild upside bias for gain to 1.1935-40, however, break of 1.2037 resistance is needed to retain bullishness and signal the pullback from 1.2093 has ended, bring retest of this level later. A break above there would extend recent rise from 1.0340 low to 1.2160-70 (50% Fibonacci retracement of 1.3993-1.0340) but loss of upward momentum should limit upside to 1.2220-30 and reckon 1.2300-10 would hold from here, price should falter well below 1.2390-00, bring another retreat later
On the downside, expect pullback to be limited to 1.1770-75 and last week’s ow at 1.1719 should remain intact, bring another rebound later. Only a drop below said support at 1.1669 would signal a temporary top has been formed at 1.2093, bring retracement of recent rise to 1.1610-15 (38.2% Fibonacci retracement of 1.0839-1.2093) and possibly towards 1.1550, having said that, downside should be limited to 1.1510-20 and 1.1460-70 (50% Fibonacci retracement) should remain intact, price should stay well above the Kijun-Sen (now at 1.1348, bring another rise.
USD/JPY Candlesticks and Ichimoku Analysis
Weekly
• Last Candlesticks pattern: Dark cloud cover
• Time of formation: 10 Jul 2017
• Trend bias: Down
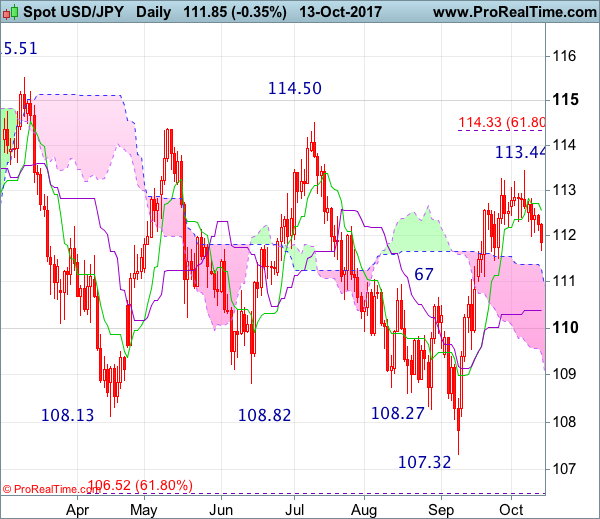
Daily
• Last Candlesticks pattern: Evening doji
• Time of formation: 7 Aug 2017
• Trend bias: Down
USD/JPY – 111.85
The greenback only recovered to 112.83 before retreating again (missed our short entry at 113.10), adding credence to our view that a temporary top has possibly been formed at 113.44 earlier this month and consolidation with mild downside bias remains for test of support at 111.47, however, break there is needed to provide confirmation, bring retracement of recent rise to 111.10-15, having said that, reckon downside would be limited to the Kijun-Sen (now at 110.38) and 110.00 should hold, price should stay well above previous support at 109.55, bring rebound later.
On the upside, whilst recovery to 112.25-30 is likely, reckon the Tenkan-Sen (now at 112.57) would limit upside and resistance at 112.83 should hold, bring another retreat later. A daily close above 112.83 would bring retest of 113.44 but break there is needed to signal the rise from 107.32 low has resumed for correction of recent entire decline from 118.66, then gain to 114.00 and possibly towards 114.30-35 (61.8% Fibonacci retracement of 118.66-107.32) would follow, however, loss of upward momentum should prevent sharp move beyond resistance at 114.50 and price should falter well below 115.00.
Recommendation : Sell at 112.70 for 110.70 with stop above 113.70
On the weekly chart, after forming a doji star at 113.44, last week black candlestick adds credence to our view that a minor top is possibly formed there and consolidation with mild downside bias remains for weakness to support at 111.47, then test of the Kijun-Sen (now at 110.91), however, only a weekly close below there would confirm and bring retracement of the rise from 107.32 to the Tenkan-Sen (now at 110.38) and then 109.90-95 but still reckon support at 109.55 would contain downside and bring another rise later.
On the upside, expect recovery to be limited to 112.80-85 and bring another retreat. Above said resistance at 113.44 would extend the aforesaid rise from 107.32 to 114.00, then 114.30-35 (61.8% Fibonacci retracement) but resistance at 114.50 should limit upside and psychological level at 115.00 should hold from here, bring retreat later.