Sample Category Title
Pound Trading Marginally Lower This Morning
For the 24 hours to 23:00 GMT, the GBP rose 0.23% against the USD and closed at 1.3292 on Friday, on expectations that the UK could be offered a two-year Brexit transition deal.
In the Asian session, at GMT0300, the pair is trading at 1.3291, with the GBP trading a tad lower against the USD from Friday’s close.
Overnight data showed that UK’s Rightmove house price index rebounded 1.1% MoM in October. The price index had fallen 1.2% in the previous month.
The pair is expected to find support at 1.3247, and a fall through could take it to the next support level of 1.3202. The pair is expected to find its first resistance at 1.3337, and a rise through could take it to the next resistance level of 1.3382.
With no macroeconomic releases in the UK today, investor sentiment would be governed by global macroeconomic events.
The currency pair is showing convergence with its 20 Hr moving average and trading above its 50 Hr moving average.

Japanese Yen Trading On A Weaker Footing In The Asian Session
For the 24 hours to 23:00 GMT, the USD declined 0.35% against the JPY and closed at 111.88 on Friday.
In the Asian session, at GMT0300, the pair is trading at 112, with the USD trading 0.11% higher against the JPY from Friday’s close.
Early morning data indicated that Japan’s final industrial production rebounded less than initially estimated by 2.0% on a monthly basis in August, while the preliminary figures had recorded a rise of 2.1%. Industrial production had dropped 0.8% in the prior month.
The pair is expected to find support at 111.7, and a fall through could take it to the next support level of 111.41. The pair is expected to find its first resistance at 112.28, and a rise through could take it to the next resistance level of 112.57.
The currency pair is showing convergence with its 20 Hr moving average and trading below its 50 Hr moving average.

Swiss Franc Reverses Its Gains This Morning
For the 24 hours to 23:00 GMT, the USD declined 0.11% against the CHF and closed at 0.9743 on Friday.
On the data front, Switzerland’s producer and import price index recorded a rise of 0.5% on a monthly basis in September, more than market consensus for a gain of 0.3%. In the prior month, the index had registered a rise of 0.3%.
In the Asian session, at GMT0300, the pair is trading at 0.9757, with the USD trading 0.14% higher against the CHF from Friday’s close.
The pair is expected to find support at 0.9717, and a fall through could take it to the next support level of 0.9678. The pair is expected to find its first resistance at 0.9784, and a rise through could take it to the next resistance level of 0.9812.
The currency pair is trading above its 20 Hr and 50 Hr moving averages.

Loonie Trading A Tad Lower This Morning
For the 24 hours to 23:00 GMT, the USD slightly rose against the CAD and closed at 1.2479 on Friday.
In the Asian session, at GMT0300, the pair is trading at 1.2484, with the USD trading marginally higher against the CAD from Friday’s close.
The pair is expected to find support at 1.2451, and a fall through could take it to the next support level of 1.2419. The pair is expected to find its first resistance at 1.2518, and a rise through could take it to the next resistance level of 1.2553.
Moving ahead, the Bank of Canada’s (BoC) business outlook survey report for the third quarter, scheduled to release later in the day, will be on investors’ radar.
The currency pair is showing convergence with its 20 Hr moving average and trading above its 50 Hr moving average.

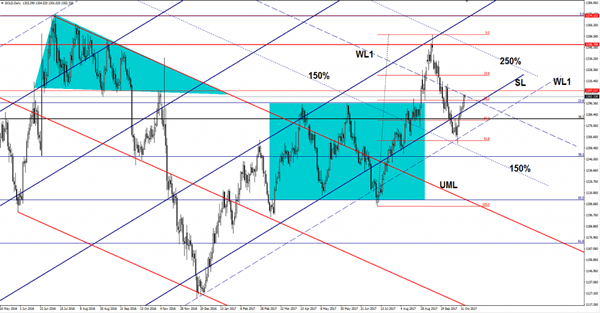
Gold Facing A Tough Resistance
Price decreased a little today after the Friday's impressive rally, but the bias remains bullish on the short term. It could climb much higher on the short term if will have enough energy to close above the WL1 of the descending pitchfork. Gold has climbed much above the $1300 per ounce, signaling that the bulls are still very strong on the short term.
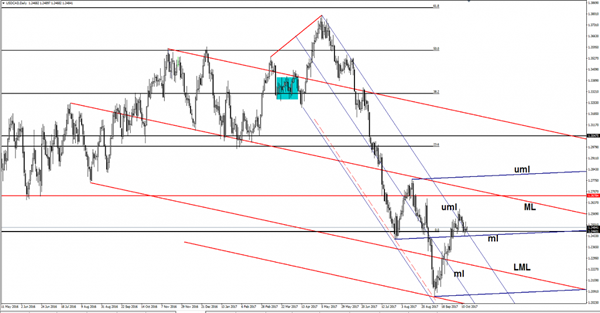
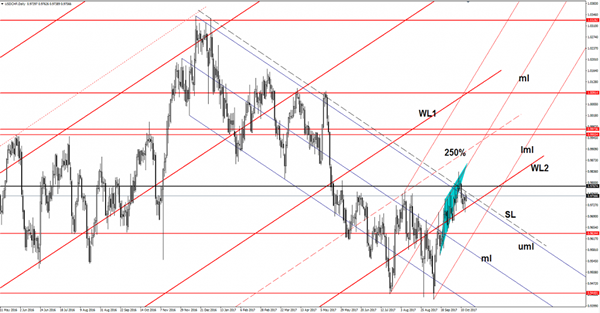
USD/CAD Buying Opportunity?
The USD/CAD increased and looks poised to start another upside momentum. Technically, it should climb much higher after the false breakdown below the upper median line (uml) of the minor descending pitchfork and after the retest of the median line (ml) of the minor blue ascending pitchfork. The bulls could take the lead again after the failure to close on the median line (ml).
USD/CHF Trading In The Green
The USD/CHF increased in the early morning and tries to take out an important resistance level. Price surged as the USDX has managed to increase a little as well. The dollar index maintains a bullish perspective on the short term despite the minor drop.
USDX was expected to drop after the false breakout above the 93.81 static resistance, but failed to approach and reach the 92.49 static support, signaling that the bulls could take the lead again very soon.
The dollar index failed to retest a dynamic support as well, showing a minor oversold on the Daily chart. The greenback decreased a little on Friday as the US data have disappointed, but a USDX’s increase will force the USD to pick up again. Technically, the USDX is expected to increase and to jump above the 93.81 major static resistance.
Price increased as is very close to erase the Friday’s losses. Right now is pressuring the upper median line (uml) of the descending pitchfork and could hit the outside sliding line again. Technically, it could breakout above the sliding line (SL) after the false breakdown below the WL2 and after the failure to close on this major dynamic support.
Resistance can be found at the 0.9787 level as well, so only a valid breakout above this level will confirm a further increase in the upcoming period. On the other hand, a drop will be validated after the valid breakdown below the WL2 of the ascending pitchfork.
GBP/USD Daily Outlook
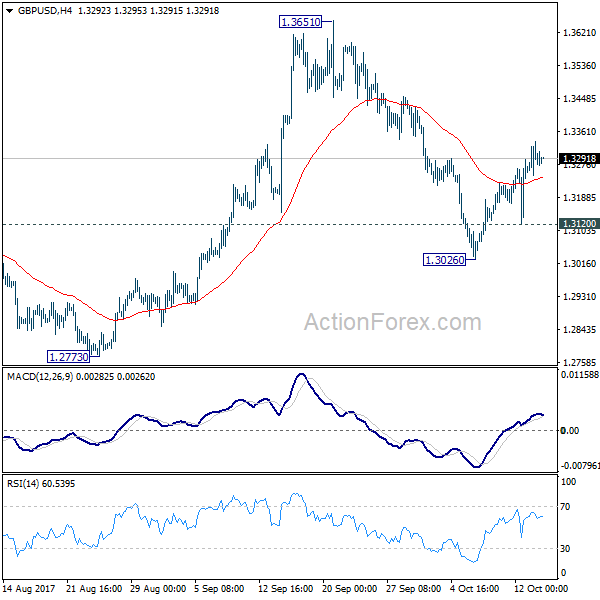
Daily Pivots: (S1) 1.3239; (P) 1.3288; (R1) 1.3331; More....
Intraday bias in GBP/USD remains mildly on the upside. Rebound from 1.3026 would target 1.3651 resistance. Break there will resume medium term rise from 1.1946 and target 1.3835 key resistance next. On the downside, below 1.3120 minor support will resume the fall from 1.3651 through 1.3026 instead.
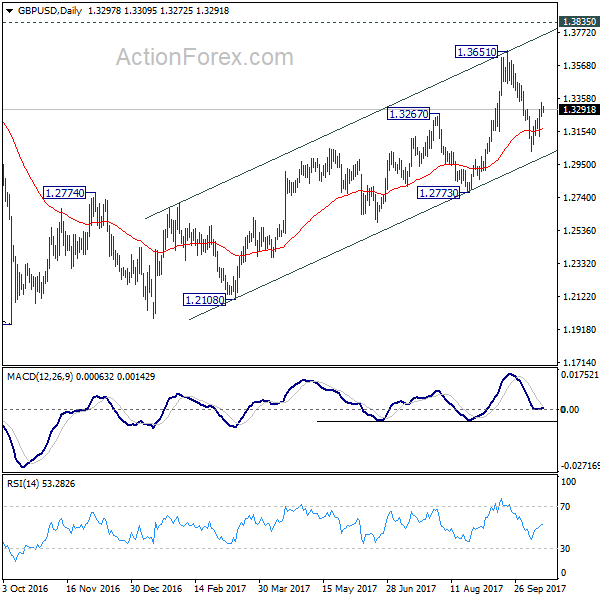
In the bigger picture, while the medium term rebound from 1.1946 was strong, GBP/USD hit strong resistance from the long term falling trend line. Outlook is turned a bit mixed and we'll turn neutral first. On the downside, decisive break of 1.2773 key support will argue that rebound from 1.1946 has completed. The corrective structure of rise from 1.1946 to 1.3651 will in turn suggest that long term down trend is now completed. Break of 1.1946 low should then be seen. On the upside, break of 1.3835 support turned resistance will revive the case of trend reversal and target 38.2% retracement of 2.1161 (2007 high) to 1.1946 (2016 low) at 1.5466.
EUR/USD Daily Outlook
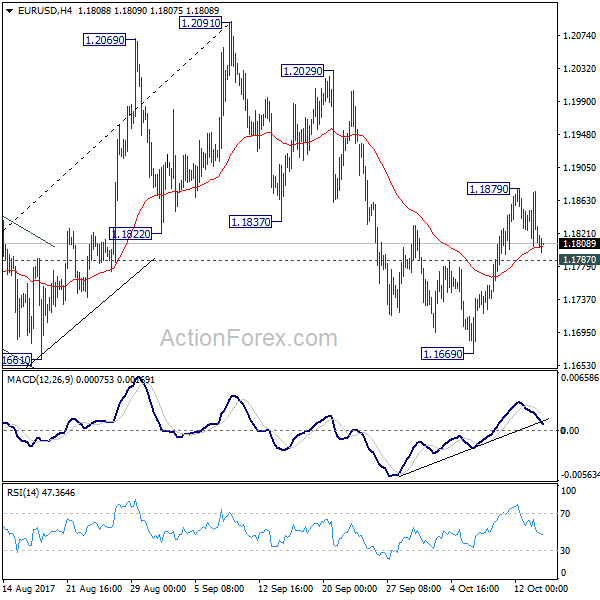
Daily Pivots: (S1) 1.1789; (P) 1.1832 (R1) 1.1860; More...
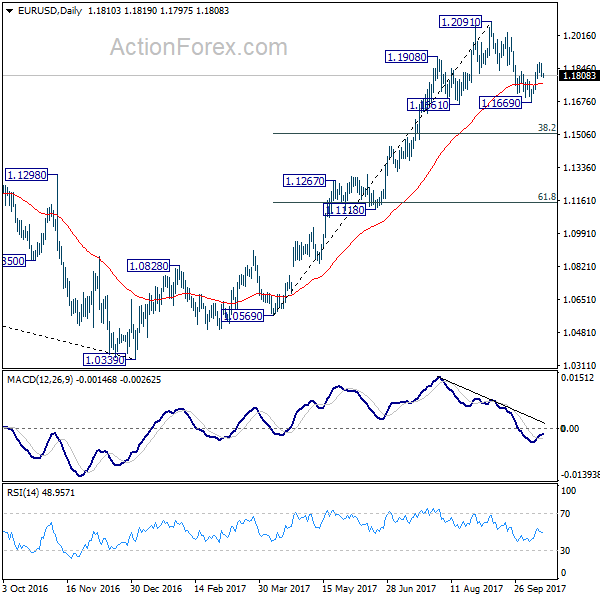
Intraday bias in EUR/USD remains neutral for the moment. At this point, we're slightly favoring the case that pull back from 1.2091 has completed at 1.1669, ahead of 1.1661 support. Above 1.1879 will turn bias back to the upside for retesting 1.2091 high. However, break of 1.1787 will dampen this view. Intraday bias will be turned back to the downside through 1.1669 low. Correction from 1.2091 would then extend to 38.2% retracement of 1.0569 to 1.2091 at 1.1510 and completes there.
In the bigger picture, rise from medium term bottom at 1.0339 is not finished yet. It's expected to continue after pull back from 1.2091 completes. And, next target will be 38.2% retracement of 1.6039 (2008 high) to 1.0339 (2017 low) at 1.2516. However, it should be noted that there is no confirmation of trend reversal yet. That is, such rebound from 1.0399 could be a correction. And the long term fall from 1.6039 (2008 high) could resume. Hence, we'd be cautious on strong resistance from 1.2516 to limit upside.
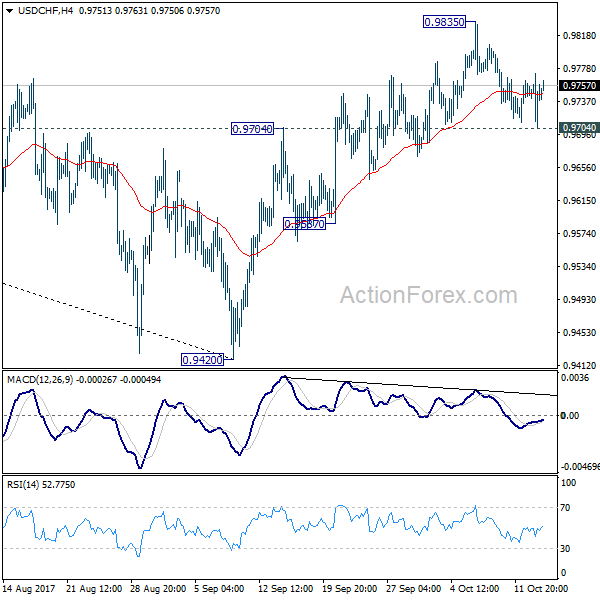
USD/CHF Daily Outlook
Daily Pivots: (S1) 0.9707; (P) 0.9739; (R1) 0.9774; More....
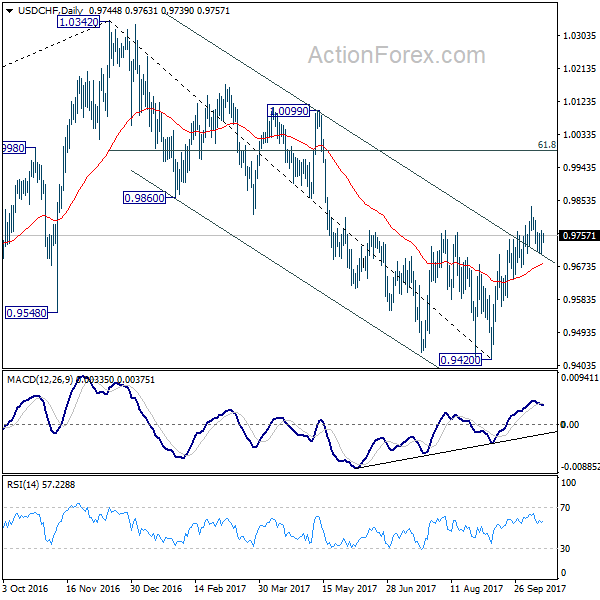
Intraday bias in USD/CHF remains neutral with focus on 0.9704 resistance turned support. Considering bearish divergence condition in 4 hour MACD, break of 0.9704 will argue that rebound from 0.9420 has completed. This will also mixed up the near term outlook and turn bias back to the downside for 0.9587 support. On the upside, break of 0.9835 will extend the rebound to 61.8% retracement of 1.0342 to 0.9420 at 0.9990.
In the bigger picture, current development suggests that USD/CHF has defended 0.9443 (2016 low) key support level again. Rise from 0.9420 could develop into a medium term move and target a test on 1.0342 high. This represents the upper end of a long term range that started back in 2015. On the downside, break of 0.9587 support is now needed to indicate completion of the rise from 0.9420. Otherwise, further rally will remain in favor in medium term.