Sample Category Title
GBP/JPY Weekly Outlook
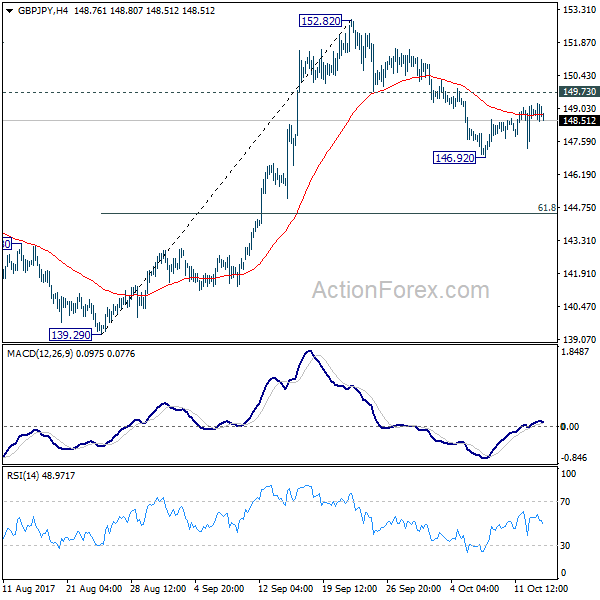
GBP/JPY edged lower to 146.92 last week but recovered since then. Initial bias stays neutral this week first. Another decline is expected with 149.73 resistance intact. Below 146.92 will target 61.8% retracement of 139.29 to 152.82 at 144.45. Such decline is seen as a correction and we'd look for strong support from 144.45 to bring rebound. On the upside, break of 149.73 support turned resistance will argue that the pull back is completed and turn bias back to the upside for retesting 152.82 high. However, sustained break of 144.45 will put 139.29 key support in focus.
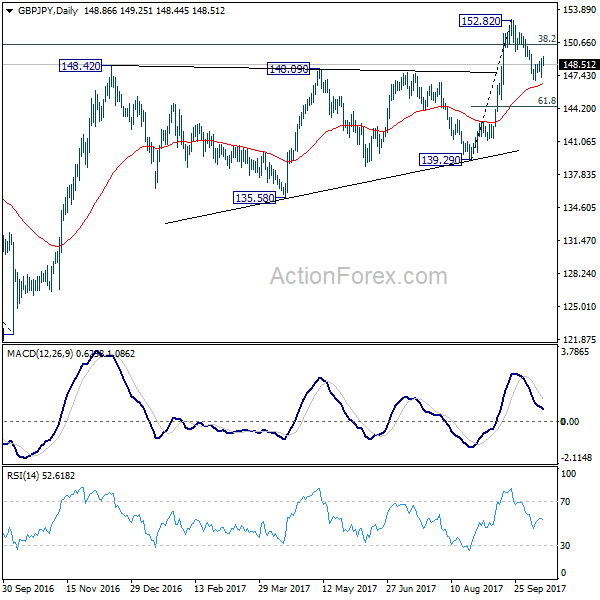
In the bigger picture, medium term rebound from 122.36 is still expected to resume after corrective pull back from 152.82 completes. Firm break of 38.2% retracement of 196.85 to 122.36 at 150.43 will carry long term bullish implications. In that case, GBP/JPY could target 61.8% retracement at 167.78. However, break of 139.29 will indicate rejection from 150.43 key fibonacci level. And the three wave corrective structure of rebound from 122.36 will argue that larger down trend is resuming for a new low below 122.26.
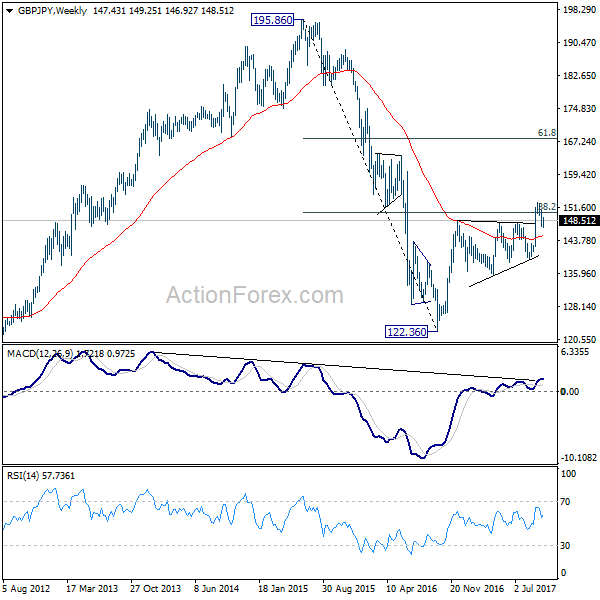
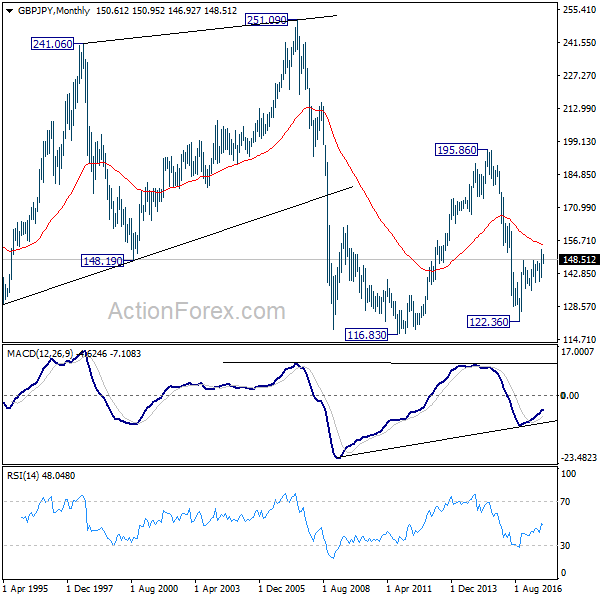
In the longer term picture, current rebound argues that the down trend from 195.86 (2015 high) has already completed at 122.36. Focus is now on 55 month EMA (now at 155.14). Firm break there will suggest that rise form 122.36 is developing into a long term move that target 195.86 again. And, price actions from 116.83 (2011 low) is indeed a sideway pattern that could last more than a decade. However, firm break of 139.29 will suggests that the long term down trend is still in progress and could break 116.83 low ahead.
EUR/JPY Weekly Outlook
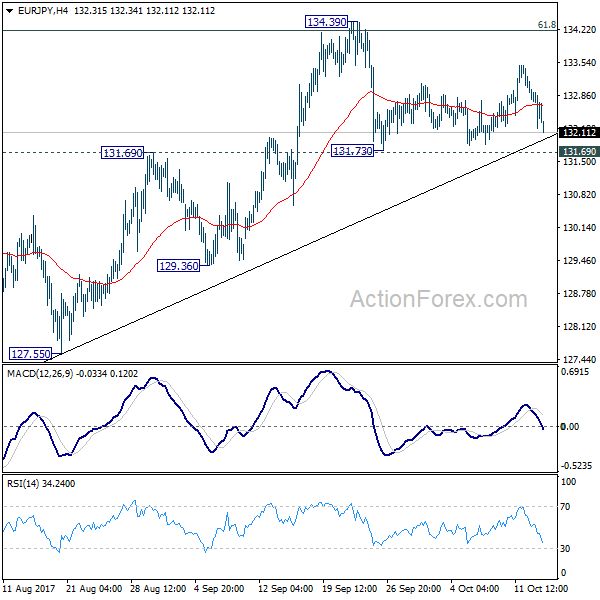
EUR/JPY stayed in range of 131.69/134.39 last week and outlook is unchanged. But it's getting more likely that 134.39 is a medium term top and a downside breakout could be seen soon. Initial bias remains neutral this week with focus on 131.69 support. Decisive break there will an early sign of medium term reversal and will target 127.55 key support level. On the upside, firm break of 134.39 is needed to confirm up trend resumption. Otherwise, more corrective trading would be seen.
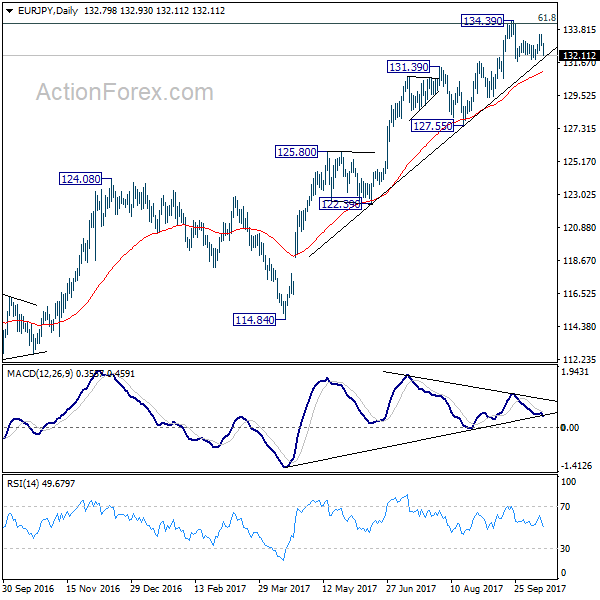
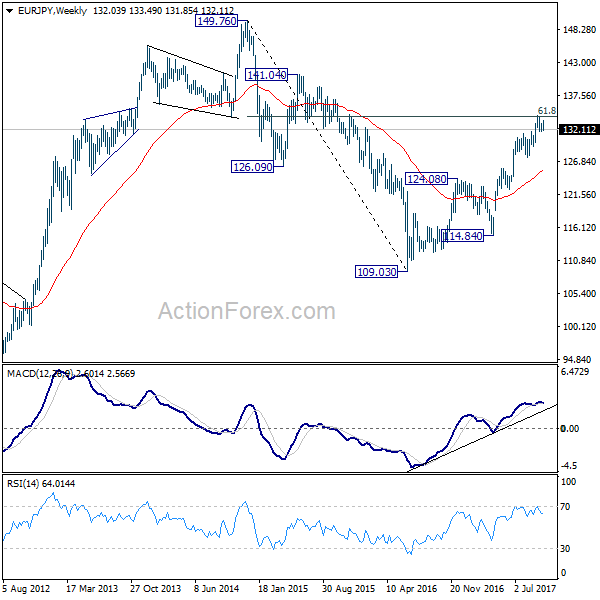
In the bigger picture, medium term rise from 109.03 (2016 low) is seen as at the same degree as the down trend from 149.76 (2014 high) to 109.03 (2016 low). 61.8% retracement of 149.76 to 109.03 at 134.20 is already met. Sustained break there will pave the way to key long term resistance zone at 141.04/149.76. However, break of 127.55 support will argue that the medium term trend has reversal and will turn outlook bearish for deeper fall.
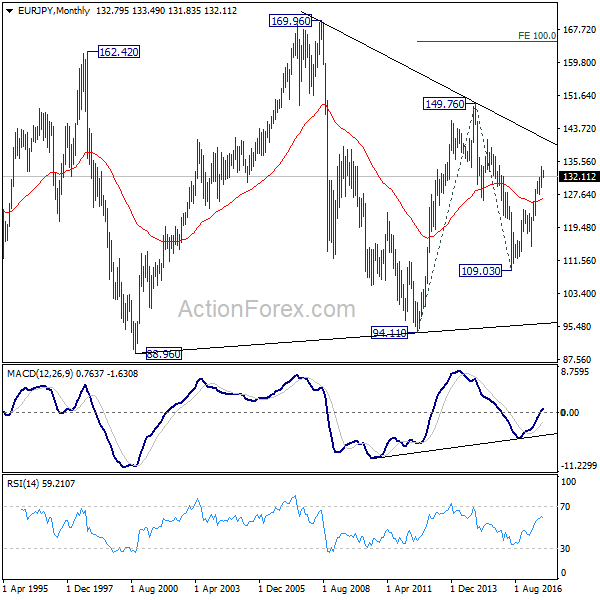
In the long term picture, at this point, there is no clear indication that rise from 109.03 is resuming that from 94.11. Hence, we'd be cautious on topping below 149.76 to extend range trading. Nonetheless, firm break of 149.76 will indicates strong underlying buying. In such case, EUR/JPY will target 100% projection of 94.11 to 149.76 from 109.03 at 164.68.
EUR/GBP Weekly Outlook
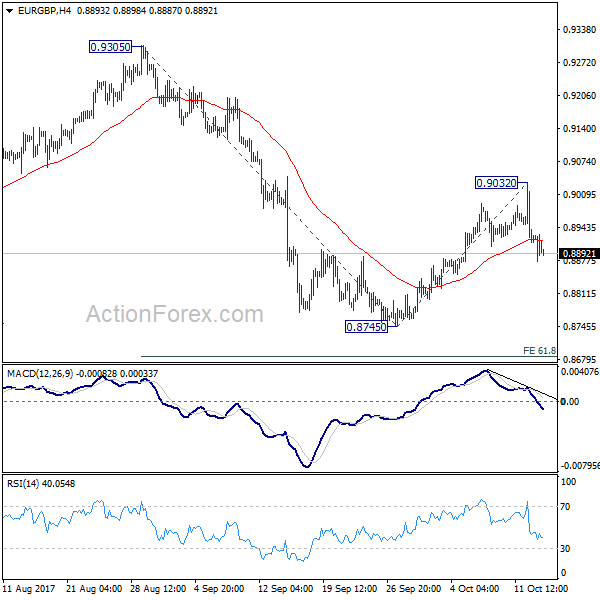
EUR/GBP's rebound from 0.8745 extended to 0.9032 last week but dropped sharply since then. The development suggests that such recovery is completed and fall from 0.9305 is resuming. Initial bias stays on the downside this week for 0.8754 first. Break will target 61.8% projection of 0.9305 to 0.8745 from 0.9032 at 0.8686. On the upside, break of 0.9032 is needed to confirm resumption of the rebound. Otherwise, risk will stay on the downside in near term.
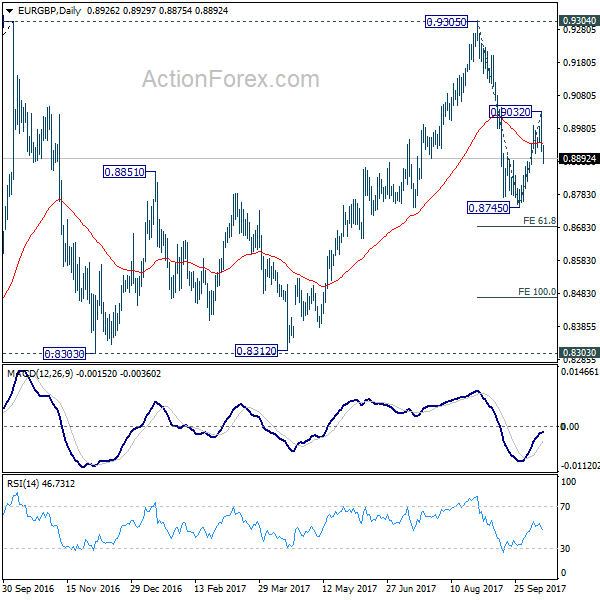
In the bigger picture, there are various ways to interpret price actions from 0.9304 high. But after all, firm break of 0.9304/5 is needed to confirm up trend resumption. Otherwise, range trading will continue with risk of another fall. And in that case, EUR/GBP could have a retest on 0.8303. But we'd expect strong support from 0.8116 cluster support (50% retracement of 0.6935 to 0.9304 at 0.8120) to contain downside.
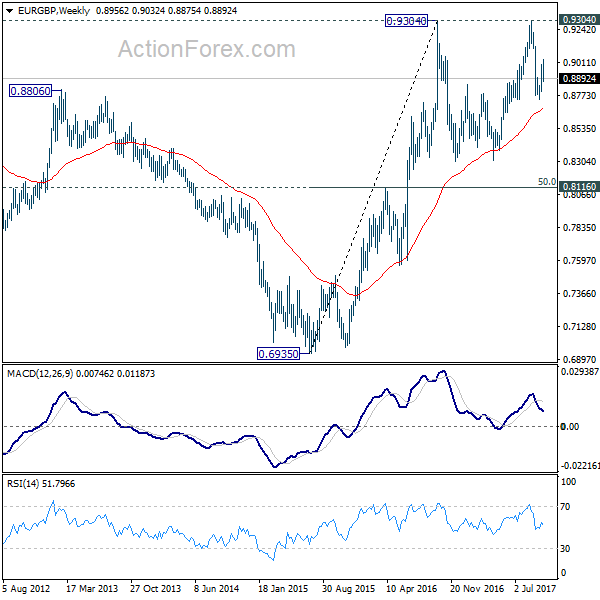
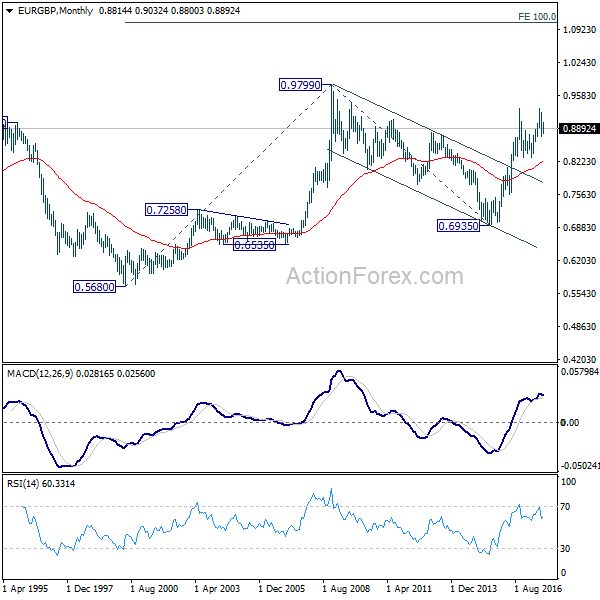
In the long term picture, firstly, price action from 0.9799 (2008 high) is seen as a long term corrective pattern and should have completed at 0.6935 (2015 low). Secondly, rise from 0.6935 is likely resuming up trend from 0.5680 (2000 low). Thirdly, this is supported by the impulsive structure of the rise from 0.6935 to 0.9304. Hence, after the correction from 0.9304 completes, we'd expect another medium term up trend through 0.9799 to 100% projection of 0.5680 to 0.9799 from 0.6935 at 1.1054.
EUR/AUD Weekly Outlook
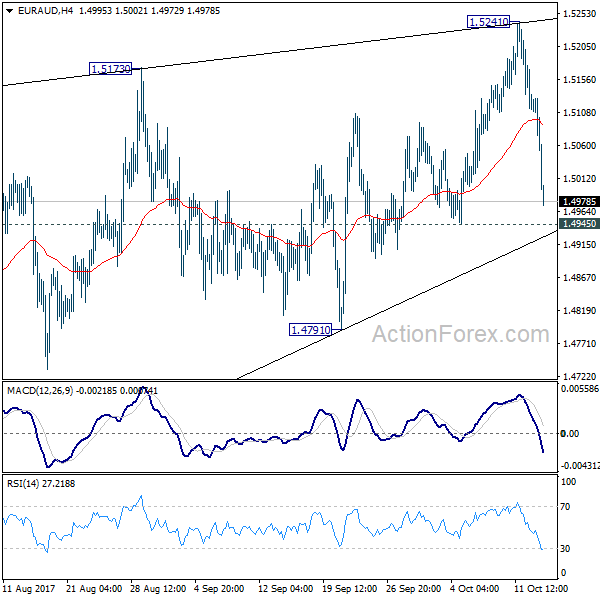
EUR/AUD rose to 1.5241 last week. But it failed to sustain above 1.5226 resistance and reversed. The development argues that consolidation pattern from 1.5226 is still unfolding with fall from 1.5241 as the third leg. Initial bias remains on the downside for 1.4945 support first. Break there should affirm this case and send EUR/AUD through 1.4791 to 1.4421 support cluster support (50% retracement of 1.3624 to 1.5226 at 1.4425). We'd expect strong support from there to bring rebound.
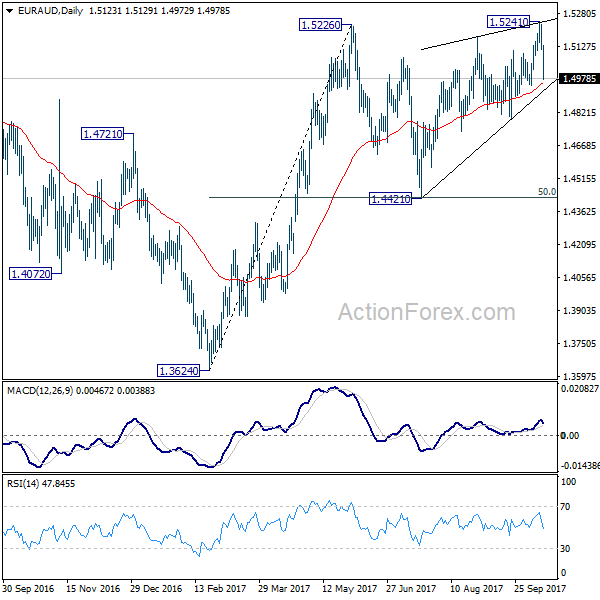
In the bigger picture, we're holding on to the view that corrective decline from 1.6587 medium term top has completed at 1.3624. Rise from 1.3624 is expected to extend to retest 1.6587. The corrective structure of the price actions from 1.5226 is affirming this view. Sustained trading above 1.5226 will target a test on 1.6587 key resistance. However, break of 1.4421 support will dampen our view and would drag EUR/AUD lower to retest key support zone around 1.3624.
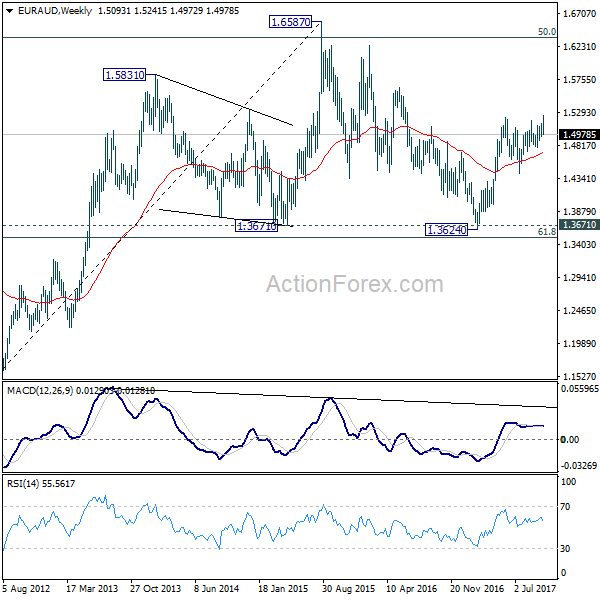
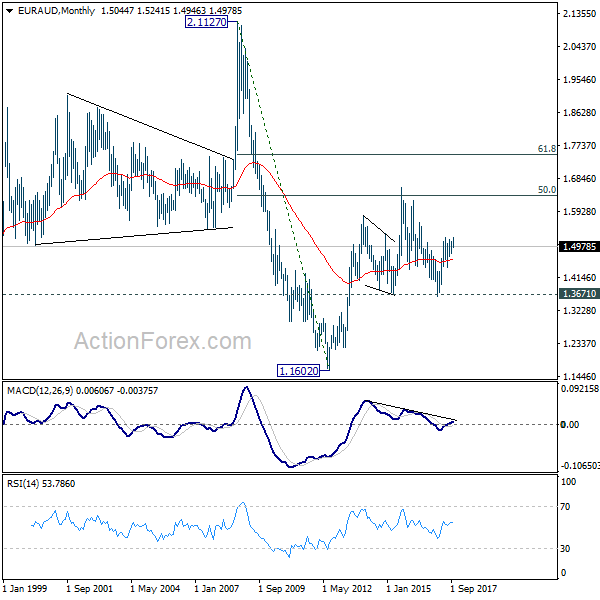
In the longer term picture, the rise from 1.1602 long term bottom isn't over yet. We'll keep monitoring the development but there is prospect of extending the rise to 61.8% retracement of 2.1127 to 1.1602 at 1.7488 and above. However, sustained trading below 1.3671 should confirm trend reversal and target 1.1602 long term bottom again.
EUR/CHF Weekly Outlook
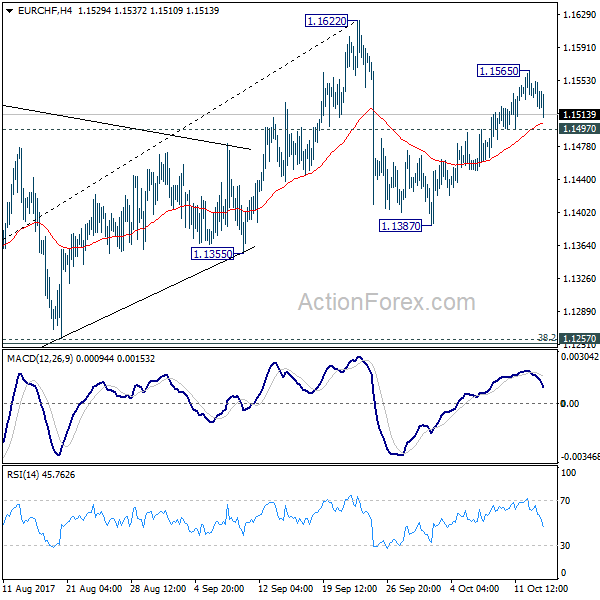
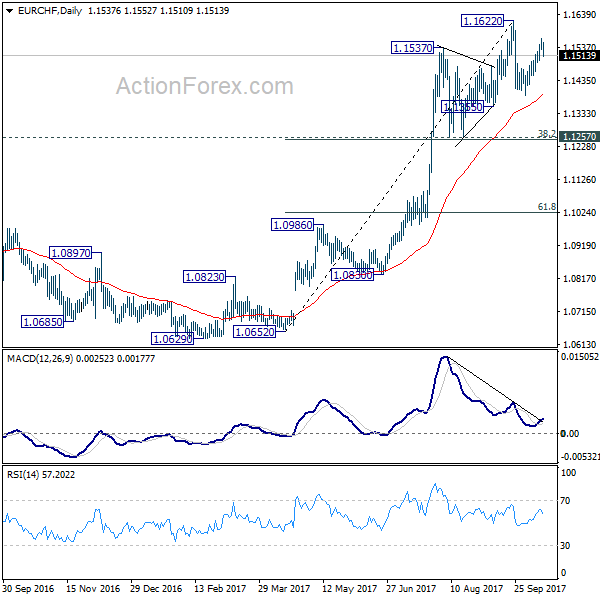
EUR/CHF recovered further to 1.1565 last week but lost momentum since then. Initial bias is neutral this week first. Overall, price actions from 1.1622 are developing into corrective pattern. In case of another rise, upside will be limited by 1.1622 to bring another fall to extend the pattern. On the downside below 1.1497 minor support will likely start the third leg through 1.1387 support. But in that case, strong support in expect at 1.1257 cluster support (38.2% retracement of 1.0652 to 1.1622 at 1.1251) to contain downside and bring rebound.
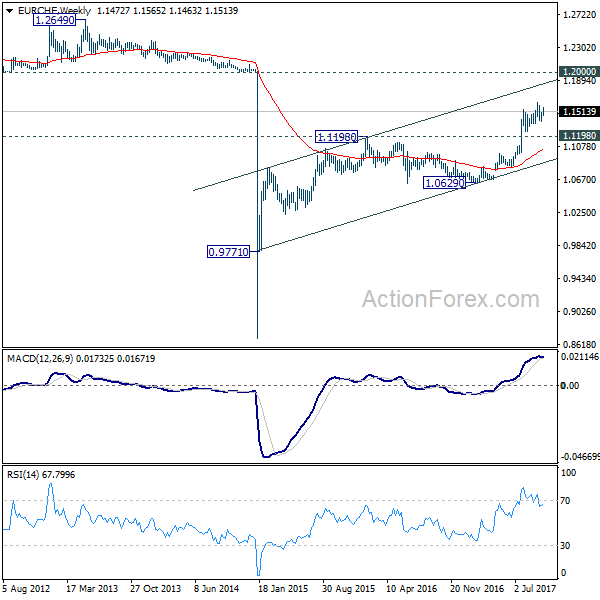
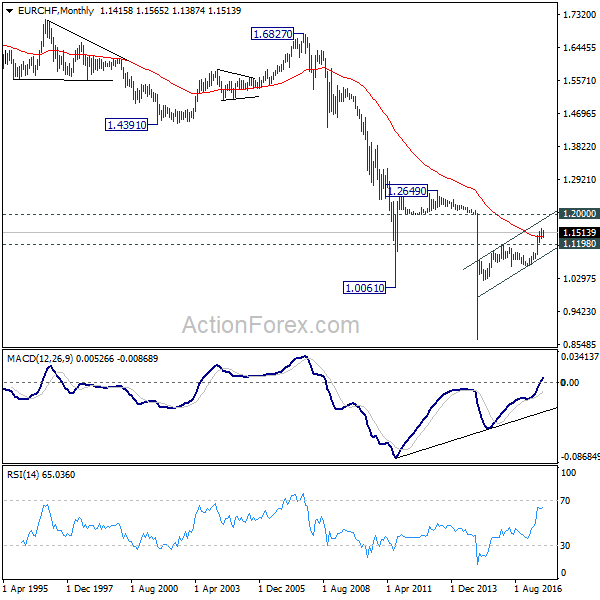
In the bigger picture, long term rise from SNB spike low back in 2015 is still in progress. EUR/CHF should now be heading back to prior SNB imposed floor at 1.2000. For now, this will be the favored case as long as 1.1198 resistance turned support holds.
Dollar and Yields Tumbled on Sluggish Inflation, Sterling Emerged as Strongest after a Week of Roller-Coaster Ride
It has been a rather volatile week. We were partly correct in expecting strong impact from politics on the markets. But the reactions to central bank news and economic data surprised us. Dollar was clearly weighed down by FOMC minutes and CPI miss and ended as the weakest one. Meanwhile, Euro reversed early gains and ended mixed on rumors about ECB's tapering plan. There was practical no impacts from US President Donald Trump, North Korea and not even Catalonia. Markets also ignored UK Prime Minister Theresa May. Nonetheless, politics did play a role in the extraordinary volatile in Sterling, which ended as the strongest one. Aussie and Kiwi followed as boosted by China data.
Dollar and treasury yields were under selling pressure from the slightly more dovish than expected FOMC minutes. Selloff then accelerated after CPI miss. The key takeaways of the FOMC minutes are that while Fed is still on track for a December hike, policy makers are getting more cautious regarding inflation. "members 'continued to project that inflation would edge higher in the next couple of years". Note that the phrase 'edge high' is less hawkish that the term 'increase' used in July. And, "several" would see if the incoming economic data would increased their confidence that inflation will return to target. Also, "a few" indicated that additional increases in the federal funds rate should be "deferred" until incoming information confirmed that the low readings on inflation this year were not likely to persist.
Later on Friday, economic data showed headline CPI rose 0.5% mom, 2.2% yoy in Septembers, up from 0.4% mom, 1.9% yoy in August, but missed expectation of 0.6% mom, 2.3% yoy. Core CPI rose 0.1% mom, 1.7% yoy, comparing to August's 0.2% mom, 1.7% yoy. More importantly, core CPI missed consensus of 0.2% mom, 1.8% yoy. The data raised some doubt if the sluggishness in underlying inflation is transitory or persistent.
10 year yield's sharp fall last week argues that rebound from 2.034 has already completed at 2.402, after breaking 2.396 resistance briefly. The development also raised the chance that medium term correction from 2.621 is not finished yet. Initial bias is on the downside this week for 55 day EMA (now at 2.258) first. Sustained break there could then pave the way to retest 2.034 low.
The decline in Dollar index was less serious, thanks to Euro's own weakness. Still, last week's decline argue that rebound from 91.01 is possibly completed at 94.26. That's after failing to sustain above 94.26 resistance as well 55 day EMA. Deeper decline is now in favor this week for retesting 91.01 support. Firm break there will resume medium term down trend from 103.82. Nonetheless, firm break of 93.14/26 will confirm trend reversal and turn outlook bullish.
Euro ended mixed as markets unhappy with ECB news
Euro originally on track for a strong week. But it was then weighed down by report of ECB's tapering. There was no confirmation on what the central bank would do yet as officials declined to comment. But it's reported that ECB is going to half asset purchase target. That is, from the current pace of EUR 60B per month to EUR 30B per month, starting January. The program could extend till September while ECB would keep option open for further extension. That news was indeed consistent with what chief economic Peter Praet has repeatedly mentioned. And that's in line with analysts expectations too. But the markets seemed dissatisfied with it. Euro ended the week mixed.
Sterling volatile on Brexit news, ended as strongest
Sterling was very volatile last week on news regarding Brexit. The Pound suffered steep selloff after the fifth round of Brexit negotiations ended with "deadlocks" on the issue of the divorce bill. But it then quickly rebounded after a German newspaper Handelsblatt quoted unnamed source that EU could give a 2 year Brexit extension to UK under the conditions that the latter will fullfil all obligations as a member country. However, UK will be required to give up its voting rights.
Also, it's reported that a draft paper was submitted to the 27 EU states by European Council President Donald Tusk. The paper indicates that free trade talks could start as soon as December. It's near impossible that EU officials will give a "go" signal for trade discussion at the October 19/20 summit due to lack of "sufficient progress" in the negotiations. But opening up the case for start trade agreements in December could give UK the "carrots" for being more decisive on closing issues like the divorce bill.
Pound ended the week as the strongest one, surprisingly.
Aussie and Kiwi lifted by China trade data
Strength in Sterling was followed by Aussie and Kiwi, as the second and third strongest ones. Central bank outlook shouldn't be the driving force behind the rebound. Instead, solid China data seemed to have played an important role. China's trade surplus surprisingly narrowed to a 6-month low of US 28.5B in September. Export grew 8.1% yoy while imports grew a stellar 18.7% yoy. The stronger-than-expected imports growth underpinned domestic economic strength. Meanwhile, China's iron ore imports jumped 11% yoy in September to a fresh record of 103M. The previous record of 96.5M tones was made in March. The data gave a strongest boost to Aussie, and to slightly lesser extent Kiwi.
Trading strategies
Regarding trading strategies, we're holding on to CAD/JPY long (bought at 89.90). The cross dipped mildly last week. But the corrective look of price actions from 91.62 affirms our bullish view. We'll hold on to the position with stop at 88.50. Break of 91.62 will extend to the rise to our first target of 61.8% retracement of 106.48 to 74.80 at 94.37 and above.
We also bought EUR/AUD on break of 1.5173 last week. But the sharp decline after failing to sustain above 1.5241 invalidates our bullish view. We'll get out of the position at market this week.
USD/JPY Weekly Outlook
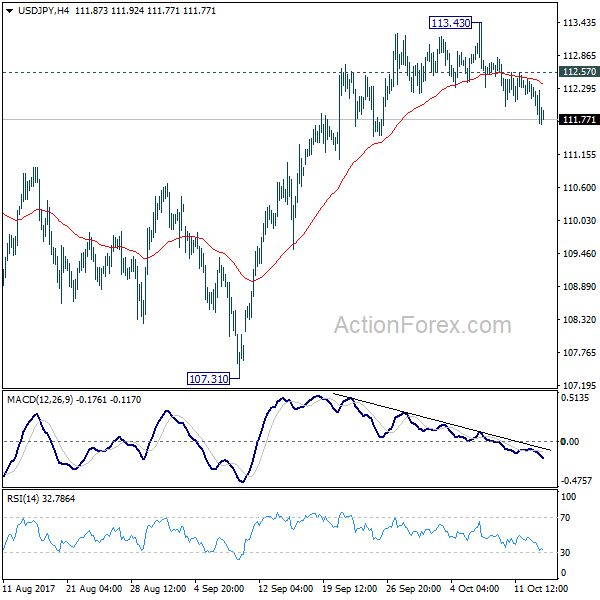
USD/JPY's decline last week indicates short term topping at 113.43. That was on bearish divergence condition in 4 hour MACD, after failing to sustain above medium term falling trend line. The development argues that rebound from 107.31 could have completed already. And fall from 113.43 might be another leg of medium term correction from 118.65. Initial bias stays on the downside this week for 55 day EMA (now at 111.37) first. Sustained break will target 107.31 low and below. In that case, we'd expect strong support from 61.8% retracement of 98.97 to 118.65 at 106.48 to contain downside and bring rebound. On the upside, above 112.57 minor resistance will turn intraday bias neutral first. But risk will stays on the downside as long as 113.43 resistance holds.
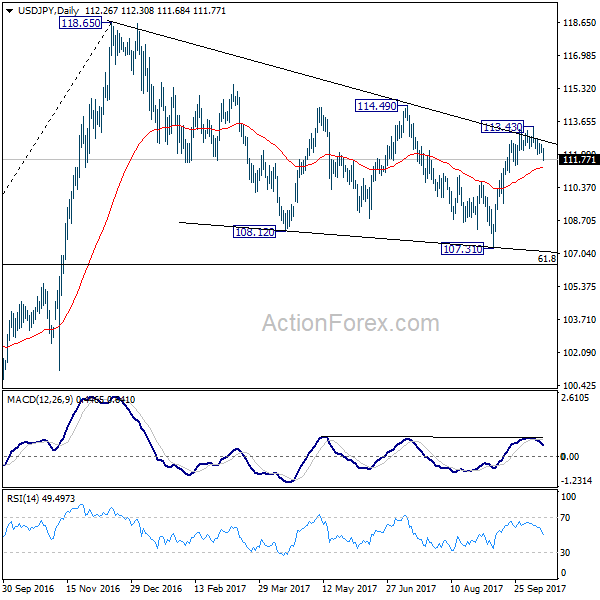
In the bigger picture, rise from 98.97 (2016 low) is seen as the second leg of the corrective pattern from 125.85 (2015 high). It's unclear whether this second leg has completed at 118.65 or not. But medium term outlook will be mildly bearish as long as 114.49 resistance holds. And, there is prospect of breaking 98.97 ahead. Meanwhile, break of 114.49 will bring retest of 125.85 high. But even in that case, we don't expect a break there on first attempt.
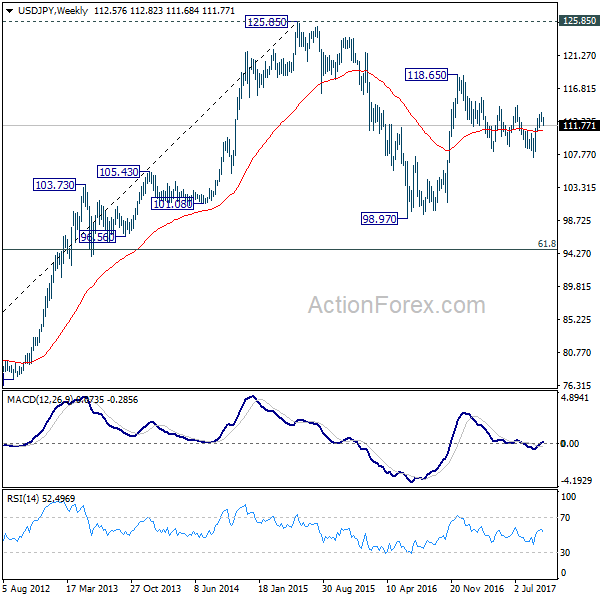
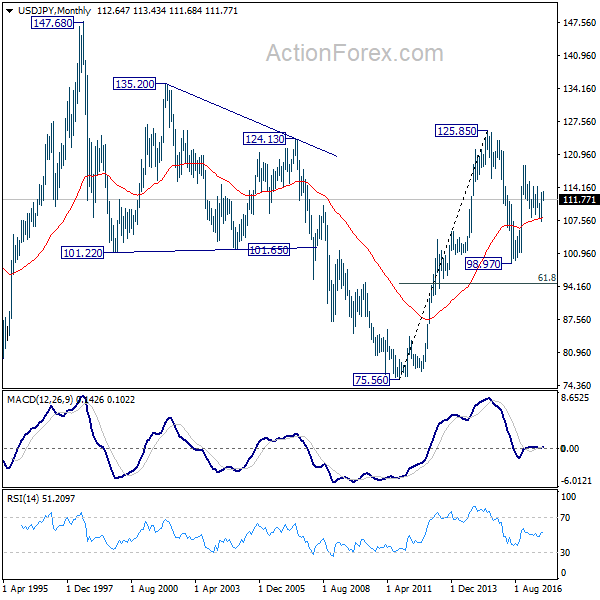
In the long term picture, the rise from 75.56 (2011 low) long term bottom to 125.85 top is viewed as an impulsive move, no change in this view. Price actions from 125.85 are seen as a corrective move which could still extend. In case of deeper fall, downside should be contained by 61.8% retracement of 75.56 to 125.85 at 94.77. Up trend from 75.56 is expected to resume at a later stage for above 135.20/147.68 resistance zone.