
Sample Category Title
Trade Idea Wrap-up: USD/JPY – Hold short entered at 112.25
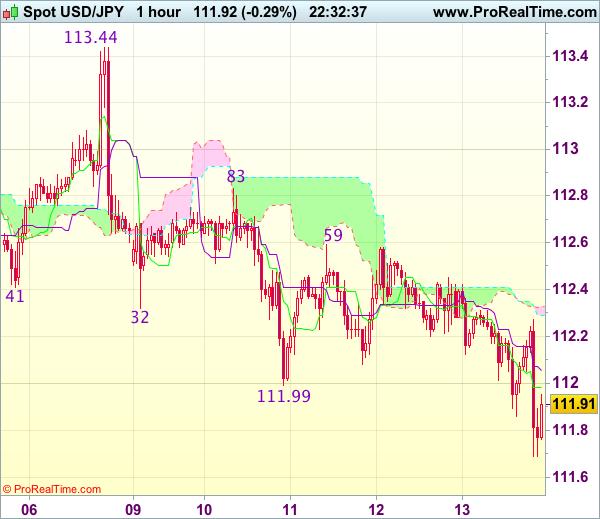
USD/JPY - 111.80
Most recent candlesticks pattern : N/A
Trend : Near term down
Tenkan-Sen level : 111.98
Kijun-Sen level : 112.06
Ichimoku cloud top : 112.33
Ichimoku cloud bottom : 112.29
Original strategy :
Sold at 112.25, Target: 111.25, Stop: 112.25
Position : - Short at 112.25
Target : - 111.25
Stop : - 112.25
New strategy :
Hold short entered at 112.25, Target: 111.25, Stop: 112.25
Position : - Short at 112.25
Target : - 111.25
Stop : - 112.25
As dollar has remained under pressure after breaking below this week’s low at 111.99, adding credence to our bearishness and signaling the fall from 113.44 top is still in progress, hence downside bias remains for this move to extend weakness to 111.70-75 (100% projection of 113.44-112.32 measuring from 112.83), below there would bring subsequent decline to 111.47 support but oversold condition would limit downside and reckon 111.11 support would remain intact.
In view of this, we are holding on to our short position entered at 112.25. Only above resistance at 112.59 would abort and signal low is formed instead, risk a stronger rebound to indicated resistance level at 112.83.
Through Hurricane Effects, CPI Inflation Looked Anemic
Consumer prices rose 0.5 percent in September as gasoline prices surged in the wake of recent hurricanes. Core inflation rose less than expected and suggests the trend in inflation remains rather tepid.
Here Comes the Story of the Hurricane
As was widely expected, the Consumer Price Index posted one of its largest monthly gains of recent years in September amid a jump in energy prices. The combination of refinery outages following Hurricane Harvey and millions of Floridians hitting the road to avoid the path of Hurricane Irma sent gasoline prices up 13.1 percent in September. All told, gasoline accounted for about three-quarters of the headline's 0.5 percent increase last month.
Beyond energy, however, the effects of Harvey and Irma appeared much more modest. Replacement demand for autos following the storms was not enough to arrest the slide in prices that has been in train since early this year. Despite a 12-year high in new vehicle sales, prices slid 0.4 percent. Used vehicle prices were also down (0.2 percent), although the drops in August and September were the smallest of this year.
Hotel prices may have gotten a lift from the large-scale evacuations, but the 1.5 percent rise in September does not look unusually large relative to the swings in recent months; the lodging away from home index has swung by a greater magnitude in four of the previous five months.
Excluding food and energy, the core index suggests the trend in inflation remains weak relative to the start of the year. Core inflation rose 0.1 percent, which was enough to bring the 3-month annualized rate up to 2.0 percent. While that is above the current year-ago rate and points to the 12-month change edging a bit higher in the coming months, it continues to run below the roughly 2.2 percent pace of late last year.
Core services rose more moderately in September (up 0.2 percent) amid more subdued gains in shelter costs, medical care, and transportation. Meanwhile, core goods prices fell for a seventh consecutive month due to the aforementioned declines in prices for autos, but also apparel, prescription drugs and household furnishings.
Transitory or Persistent Is Still an Open Question for the Fed
At a time when the Fed is closely examining all inflation data for clues about whether the slowdown that began last spring is likely to be temporary or persistent, today's CPI report does not provide much comfort. As indicated in the statement and minutes following the September meeting, FOMC members expected to see inflation lifted temporarily by the hurricane-related bump in gasoline and other items last month. Yet the modest increase in core inflation is likely to keep many Fed officials concerned about the near-term path of inflation and whether another rate hike will be warranted in December. Fortunately for the data-dependent Fed, there will be two more CPI and PCE inflation reports before the December decision, meaning there is still time for greater clarity to emerge.
Trade Idea: EUR/GBP – Stand aside
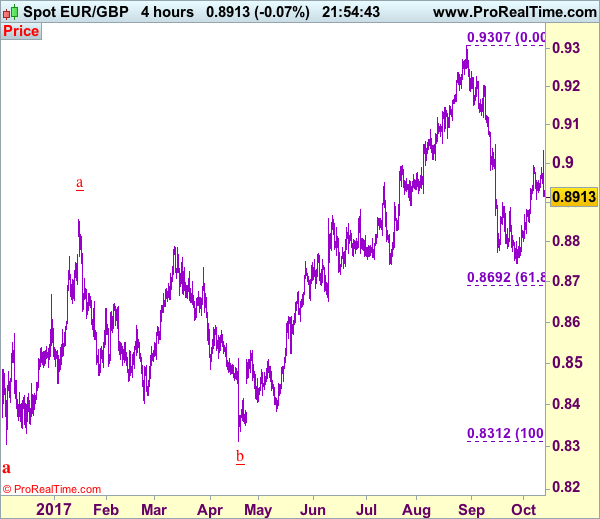
EUR/GBP - 0.8913
Original strategy :
Bought at 0.8985, stopped at 0.8945
Position : - Long at 0.8985
Target : -
Stop : - 0.8945
New strategy :
Stand aside
Position : -
Target : -
Stop : -
Despite yesterday’s brief rise to 0.9033, the subsequent much stronger-than-expected retreat signals top has been formed there an consolidation with mild downside bias is seen, below 0.8875-80 would bring test of support at 0.8850 but break there is needed to add credence to this view and suggest the rebound from 0.8746 low has ended, bring further fall to 0.8800-10.
In view of this, would not chase this fall here and would be prudent to stand aside in the meantime. Above 0.8930-35 would bring recovery to 0.8955-60 but upside should be limited to 0.8985-90, price should falter well below said resistance at 0.9033, bring another selloff next week.
Our preferred count is that, after forming a major top at 0.9805 (wave V), (A)-(B)-(C) correction is unfolding with (A) leg ended at 0.8400 (A: 0.8637, B: 0.9491 and 5-waver C ended at 0.8400. Wave (B) has ended at 0.9413 and impulsive wave (C) has either ended at 0.8067 or may extend one more fall to 0.8000 before prospect of another rally. Current breach of indicated resistance at 0.9043 confirms our view that the (C) leg has ended and bring stronger rebound towards 0.9150/54, then towards 0.9240/50.
Spot Gold above $1300 on Disappointing US Inflation Data
Spot Gold surged after disappointing US inflation data and cracked psychological $1300, posting new high at $1302, the highest since 26 Sep. The metal extended its steep ascend from $1260 into sixth straight day, retracing over 76.4% of $1313/$1260 downleg. Gold advanced on weaker dollar last week, with another sign of weak US inflation, which reduces hopes of rate hike in December and boosts US interest rate-change sensitive gold. Spot Gold is on track for strong weekly close (the first bullish week after being in red for one month) and reversal pattern is forming on weekly chart, which would further boost metal's price. Close above $1297 (Fibo 38.2% of $1357/$1260 descend) will generate bullish signal for further advance which now eyes strong barrier at $1309 (daily cloud top/Kijun-sen line), break of which will be another strong bullish signal. Meanwhile, the rally may take a breather, which is indicated by overbought slow stochastic on daily chart, but so far without firmer signal. Broken 55SMA offers solid support at $1295 which should contain dips, guarding 20SMA pivot at $1288.
Res: 1302; 1309; 1313; 1316
Sup: 1297; 1295; 1288; 1281
Trade Idea: USD/CAD – Buy at 1.2395
USD/CAD - 1.2480
Trend: Down
Original strategy :
Buy at 1.2395, Target: 1.2595, Stop: 1.2335
Position: -
Target: -
Stop: -
New strategy :
Buy at 1.2395, Target: 1.2595, Stop: 1.2335
Position: -
Target: -
Stop:-
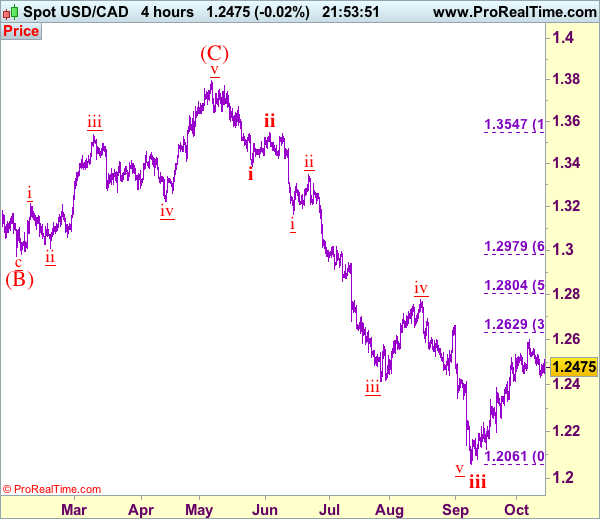
Although the greenback found support at 1.2433 earlier this week and recovered, reckon upside would be limited to 1.2531 and near term downside risk remains for the corrective decline from 1.2599 top to bring retracement of recent upmove to 1.2415 but reckon 1.2390-95 would limit downside and bring another rebound later, above 1.2531 resistance would suggest low is formed, bring further gain to 1.2555-60, break there would signal the pullback from 1.2599 has ended, bring retest of this level, above there would extend the rise from 1.2061 low (wave iii trough) towards previous resistance at 1.2663 but upside should be limited to 1.2700 and price should falter well below another previous resistance at 1.2778.
In view of this, would not chase this rise here and would be prudent to buy again on pullback as 1.2395-00 should limit downside. Below 1.2395-00 would bring correction back to 1.2350-55 but reckon indicated support at 1.2313 would hold. Only a drop below 1.2313 would abort and signal the aforesaid rise from 1.2061 has ended, bring further fall to 1.2254 support, however, reckon downside would be limited to another previous support at 1.2197, bring rebound later. We are keeping our count that wave v as well as wave (C) ended at 1.3794 and impulsive wave (i ii, i ii) is now unfolding with minor wave iii ended at 1.2414, followed by wave iv correction ended at 1.2778, wave v has reached our indicated downside target at 1.2100 and may extend to 1.2000.
To recap, wave B from 1.3066 is unfolding as an a-b-c and is sub-divided as a: 1.2192, b: 1.2716 and wave c is a 5-waver with i: 1.1983, ii: 1.2506, extended wave iii with minor iii at 1.0206, wave iv ended at 1.0781 and wave v as well as wave iii has ended at 0.9931, hence the subsequent choppy trading is the wave iv which is unfolding as (a)-(b)-(c) with (a) leg of iv ended at 1.0854, followed by (b) leg at 1.0108 and (c) leg as well as the wave iv ended at 1.0674. The wave v is sub-divided by minor wave (i): 0.9980, (ii): 1.0374, (iii): 0.9446, (iv): 0.9913 and (v) as well as v has possibly ended at 0.9407, therefore, consolidation with upside bias is seen for major correction, indicated target at 1.3700 and 1.4000 had been met and further gain to 1.4700 would be seen later.
US: Retail & Food Service Sales End Q3 with a Bang
Retail sales ended the third quarter with a bang, increasing 1.6 percent in September. This will give a boost to personal consumption expenditures, which started the third quarter on a weak note.
Strong Auto Sales Drive September Retail Growth
Retail and food services sales surged 1.6 percent in September, a bit slower than the 1.7 percent estimated by consensus but still very strong to close the third quarter on a positive note. Excluding automobile sales, which surged 3.6 percent during the month, retail and food services sales also increased a strong 1.0 percent compared to August. Meanwhile, gasoline sales also rose strongly, up 5.8 percent during the month as gasoline prices increased considerably due to the effects of the hurricane in Texas that affected some refineries in the Houston region.
Another strong sector of retail in September was building material & garden equipment & supplies dealers, which increased 2.1 percent in the month. On the other hand, food & beverage stores sales were up 0.8 percent with grocery store sales improving 1.0 percent. Clothing & clothing accessories stores sales inched up 0.4 percent while general merchandise stores sales were up 0.3 percent. However, within general merchandise stores sales, department store sales were lower once again, this time by 0.4 percent. Miscellaneous store retailers' sales were also down in the month, by 0.6 percent. Other weak sectors during September were sporting goods, hobby, book & music stores' sales, down 0.2 percent; health & personal care stores' sales, down 0.4 percent; electronics & appliance stores' sales down 1.1 percent and furniture & home furniture stores' sales down 0.4 percent.
Meanwhile, non-store retailers' sales were up 0.5 percent in the month while on the service side of the retail report, food services & drinking places' sales increased 0.8 percent.
Overall, the retail & food services report for September was strong but it was also a mixed bag in terms of sector performance with very strong sectors, i.e., autos and gasoline sales, as well as very weak sectors, i.e., electronics & appliance stores' sales, etc.
Control Group Sales Recovers in September
Perhaps the best news in this retail sales report was the recovery in control group sales, which is a sector that goes into the calculation of personal consumption expenditures. Control group sales' was up 0.4 percent in September and was upwardly revised to 0.0 percent in August after a very strong 0.7 percent increase in July. This means that personal consumption expenditures (PCE) growth will remain relatively strong in the third quarter of the year even though it may not repeat the strength we saw in the second quarter of the year.
The implications are that either the consumer continued to bring down savings and/or increased credit use in order to support higher PCE growth in the face of a still weak performance by personal income during the third quarter of the year.
US: Core Inflation Disappoints Once Again
Once again, higher energy prices pushed up the headline consumer price index (CPI) in September. The index jumped up 0.5% on the month in line with expectations. As a result, inflation on a year-on-year basis also moved up to 2.2% in September from 1.9% in August.
Similar to August, a 6.1% month-on-month (m/m) pop in energy prices helped lift headline inflation. Refinery shutdowns related to Hurricane Harvey reduced the supply of gasoline, and prices at the pump rose 13.1% in September. Despite speculation about higher food prices, the food index only rose 0.1% in September, and is only up 1.2% on the year.
Core inflation rose a disappointing 0.1% m/m in September, which leaves the year-on-year pace unchanged for the fifth month in a row, at 1.7%.
Both core goods (-0.2% m/m) and core services (-0.2% m/m) prices lost momentum. Underneath the surface, the shelter index continued to increase (+0.3%), and the indexes for motor vehicle insurance (+0.5%), recreation (+0.2%), education (+0.3%), and wireless telephone services (+0.4%) also rose. However, these increases more than offset declines in the indexes for new vehicles (-0.4%), household furnishings and operations (-0.3%), medical care (-0.1%), and used cars and trucks (-0.2%).
The BLS noted that new vehicle prices are now 1% lower than they were a year ago, the largest 12-month decline since the recession.
The BLS cited that Hurricane Irma had a small impact on data collection in some areas of Florida in September.
Key Implications
Well, this is disappointing. Another 0.1% monthly increase in core inflation adds to worries about when the soft spot in U.S. inflation will end. Notably, core services inflation held up a bit better than core goods where price deflation accelerated. It may be that the impact of the past appreciation of the U.S. dollar is taking longer to abate than previously expected. Moreover, the loss of momentum in auto sales, which is clearly putting downward pressure on prices, isn't helping.
We continue to expect that those exchange rate impacts will ebb, and goods prices should help lift inflation higher over the coming two years. And, as slack in the domestic economy diminishes further, services prices are also likely to perk up. However, this process is taking longer than previously expected, which reduces our confidence in a December rate hike somewhat.
Energy Price Jump Pushed U.S. CPI Higher in September
Highlights:
- Year-over-year growth in the all-items index jumped above a 2% rate - to 2.2% - for the first time since April, but almost entirely because of a surge in gasoline prices tied to production disruptions from Hurricane Harvey
- Gasoline prices jumped 13.1% on a month-over-month basis and were up 19.3% from a year ago.
- Excluding food & energy prices, 'core' CPI inched up 0.1% on a month-over-month basis and the year-over-year rate held steady at 1.7% for a fifth consecutive month.
Our Take:
A jump in energy prices was almost entirely responsible for the rise in the headline year-over-year rate to back above a 2% rate in September. Gasoline prices surged 13% higher on a month-over-month basis in September, and were up almost 20% from a year ago, as production disruptions at petroleum refineries in the U.S. gulf coast region tied to Hurricane Harvey hit gasoline supply. Most of that increase should ultimately prove transitory as production recovers.
Outside of the energy component, trends were little changed. Core - ex-food & energy - price growth held steady at 1.7% on a year-over-year basis for a fifth consecutive month. The year-over-year increase would look stronger if not for an unusually large decline in telecommunication prices earlier this year and the Fed will likely take some comfort from the fact that the pace of growth is no longer slowing. The economic backdrop still looks solid and labour markets are increasingly tight so it is more likely that underlying inflation pressures will move higher than lower going forward. With most (non-price) indicators suggesting that the U.S. economy is quite close to capacity, we continue to think that more interest rate hikes will be warranted. Nonetheless, near-term inflation pressures still look relatively benign, so we also continue to expect the pace of increases will be very gradual.
EURGBP Remains Vulnerable To The Downside On Bear Pressure
EURGBP- The cross remains biased to downside as it followed through lower on the back of its Thursday losses during Friday trading session today. Support lies at the 0.8850 level where a violation will turn focus to the 0.8800 level. A break will expose the 0.8750 level. Its daily RSI is bearish and pointing lower suggesting more weakness. Resistance resides at the 0.8950 level where a violation if seen will turn risk towards the 0.9000 level. Further up, resistance resides at 0.9050 level followed by the 0.9100 level. All in all, EURGBP remains biased to the downside.
US: Retail Sales Surge in September as Hurricane Rebuilding Gets Under Way
Retail sales surged 1.6% in September according to the advance Census Bureau report. While this was slightly shy of expectations for a 1.7% rise, upward revisions to August sales - which are now reported to have declined by 0.1% instead of a 0.2% decline - more than made up for the miss.
Sales at motor vehicle & parts dealers (+3.6%) helped lift the headline - a fact telegraphed in the strong unit sales number earlier this month - with gasoline station sales rising by a whopping 5.8% as fuel was replenished after shortages and its price rose. Excluding autos and gas, retail sales were up 0.5% on the month, beating expectations and following an upwardly revised gain of 0.1% (previously reported as 0.1% decline).
Building materials (2.1%) had a great month as rebuilding got underway, as did eating and drinking places (+0.8%). Excluding gas, autos, building materials, and food services, the so-called 'control group' used in calculating GDP was up 0.4% on the month - right on consensus. About half of the categories in the control group rose, with groceries (+0.8%), clothing (+0.4%), merchandise (+0.3%) and non-store retailers (+0.5%) leading the gains. On the other hand, spending on electronics (-1.1%), miscellaneous (-0.6%), health and personal care (-0.4%), furniture (-0.4%) and sporting goods (-0.2%) pulled back on the month.
Key Implications
This was a solid report all things considered. The headline suggests that rebuilding has already started, with activity likely to pull back somewhat, but still remain elevated for several months. Despite the headline print falling slightly shy of expectations, revisions to previous month's sales more than made up for miss. Together with the relatively muted price changes in core goods released in this morning's CPI report, the retail report suggests a slightly stronger Q3 consumption profile of just above 2% and a great hand-off into the fourth quarter when consumption should accelerate closer to 3%.
While the strength in building materials, gasoline, autos, and furniture is likely to fade towards the end of the year and dissipate altogether next year, we expect the consumer will continue to be the main engine of growth for the American economy. This will be supported by the rising income, as the ever improving labor market continues to generate jobs while tighter conditions drive up wages.
The strength of this report is likely going to be seen through by the Fed, with FOMC members expecting distortions from Hurricane activity to be transitory and not materially affecting the economy's path beyond the near-term. Having said that, while the relatively healthy retail sales report may be viewed constructively as far as another rate hike in December, this morning's weak CPI data will be viewed as an argument to be patient.