Sample Category Title
USD/CHF Strong Bounce Within Uptrend Channel
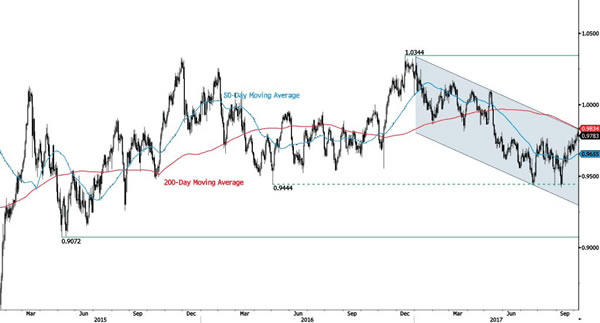
USD/CHF is trading higher within short-term uptrend channel. Demand has been increasing since September. Closest resistance is given at 0.9808 (30/05/2017 high). There are nonetheless decent downside risks. Strong support is given at 0.9421 (03/05/2017). Expected to show continued bullish pressures.
In the long-term, the pair is still trading in range since 2011 despite some turmoil when the SNB unpegged the CHF. Key support can be found 0.8986 (30/01/2015 low). The technical structure favours nonetheless a long term bullish bias since the unpeg in January 2015.
USD/JPY Lack Of Follow-Through
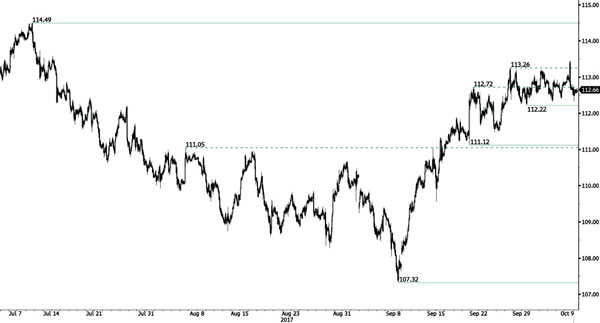
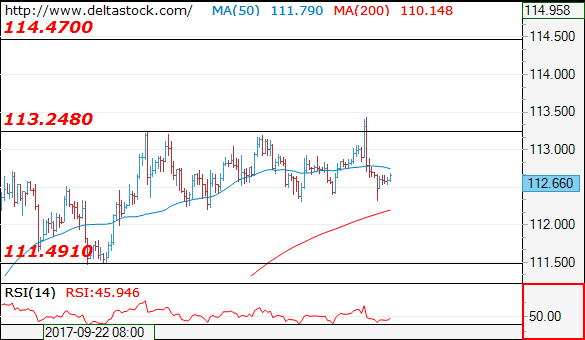
USD/JPY has broken resistance given at 113.26 (27/09/2017 low) before bouncing lower. Strong support is located at a distance at 111.12 (20/09/2017 low). The pair is trading in a range above hourly support at 112.22 (29/09/2017 low). Downside risks are nonetheless rising as markets may soon take some short-term profit.
We favor a long-term bearish bias. Support is now given at 99.02 (10/08/2013 low). A gradual rise towards the major resistance at 125.86 (05/06/2015 high) seems unlikely. Expected to decline further support at 93.79 (13/06/2013 low).
GBP/USD Bouncing Higher Within Downtrend Channel
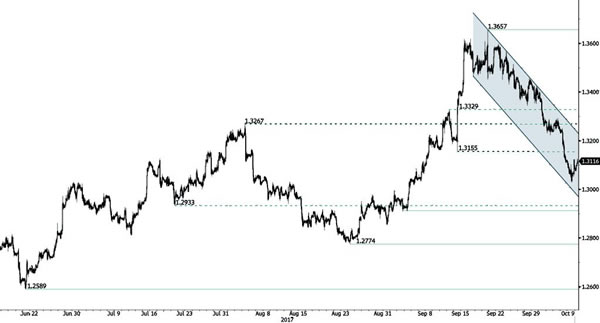
GBP/USD is consolidating higher within downtrend channel. The pair lies in a downtrend channel since the pair has topped 1.3657 (20/09/2017 high). Expected to show continued bearish pressures. Wide-open for further decrease.
The long-term technical pattern is reversing. The Brexit vote had paved the way for further decline. Long-term support can be found at 1.1841 (07/10/2017 low). Long-term resistance given around 1.35 is at stake and indicates a long-term reversal in the negative trend. Yet, it is very unlikely at the moment.
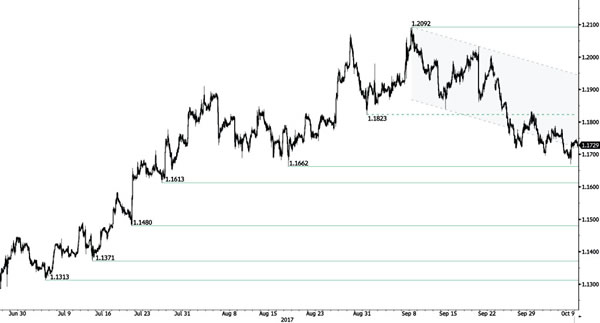
EUR/USD Ready For Further Downside
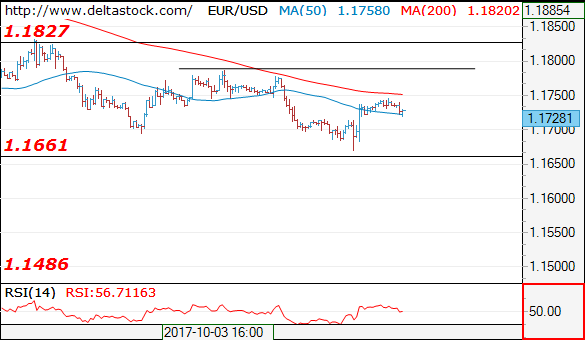
EUR/USD is way into a bearish trend. Hourly resistance can be found at 1.1833 (29/09/2017 high). Strong support is given at a distance at 1.1662 (17/08/2017 low). Expected to show continued short-term bearish pressures.
In the longer term, the momentum is now turning largely positive. We favour a continued bullish bias. Key resistance is holding at 1.2252 (25/12/2014 high) while strong support lies at 1.0341 (03/01/2017 low).
Sterling Haunted By Political Uncertainty, Slow Brexit Talks And Unsustainable BOE Rate Hike
British pound's post-BOE rally has more than evaporated over the past two weeks. Political uncertainties and the lack of progress in Brexit negotiations are the key reasons driving sterling lower. Despite mounting pressure on PM Theresa May to step down, we believe it would be hard to materialize as there lacks charismatic leaders within the Conservative Party and the move might trigger a snap election and a Labor government. Progress of Brexit talks has remained slow. The next round of talk in Phase I would begin this week, amidst EU Parliament's overwhelming vote that previous talks has not brought sufficient progress. EU member states are due to vote next week to decide whether the talk can progress to the next phase. It is getting likely that BOE would increase the Bank rate by +25 bps in November. However, we do not consider this as the beginning of a tightening cycle as UK's macroeconomic developments remains fragile.
May to Step Down?
PM Theresa May is facing increasing pressure to resignation after her Conservative conference speech last week. It is widely believed that the key problem is not the content of the speech, but the way of delivery. It was reported that 30 of the Conservative MPs have agreed to sign a letter demanding her to step down. Under Conservative Party rules, 15% of its MPs, i.e.: 48 out of the current 316 MPs, are needed to trigger a confidence of leadership vote. It is undeniable that May has been losing support both in the party and amongst the general public. However, we doubt if she would be replaced in the medium-term. First, it is highly uncertain that who would succeed May after she quits. There lacks charismatic political leaders within Tories. The latest poll shows that Boris Johnson, Jacob Rees-Mogg and David Davis are the top 3 potential candidates. However, we believe the majority of MPs do not prefer someone that are considered 'radical' or 'extreme' which might further delay the Brexit progress. Second, it is a real concern that May's resignation, which could eventually lead a snap election and a Labor government. According to Yougov's survey on October 4-5, 42% of Britons would vote for Labors if there were are general election held tomorrow, compared with 40% for Tories. Indeed, support for Labours has been above that for Tories since the snap election in June. Yet, May still makes a better PM than Jeremy Corbyn (36%:33%), as suggested in the latest poll. We do not think Tories would take the risk to pave the way for another snap election.
Lackluster Brexit Talks
Another issue weighing on sterling is the lack of progress in Brexit negotiation. Last week, the EU parliament voted 557-92 to decided that Brexit talks have not made 'sufficient progress' on Phase I which includes negotiations on citizens rights, the financial settlement and Ireland. As such, the parties would be unable to move on to Phase II, which involves the most controversial negotiations of trade and transitional agreement. The next round (Phase I) of Brexit talks should start this week, while the European Council summit will take place on October 19-20, when member states will vote to decide if 'sufficient progress' has been made in Phase I negotiations.
BOE
The market has priced in a 69% chance of a BOE rate hike in November as the central bank warned in September that the market had underestimated the rate hike schedule and as UK's CPI jumped to +2.9% in August. Even if BOE announces a +25 bps rate hike next month, we still would not consider it as the beginning of the tightening cycle. It is unwarranted by the macroeconomic developments in the country. A long pause is expected after the first rate hike in over a decade.
UK's services PMI recovered to 53.6 in September, from a 11-month low of 53.2 a month ago. However, new business growth eased to a 13-month low. Construction PMI showed a slump to 48.1 in September. This is the first time for construction activities to fall to contraction since August 2016. Manufacturing PMI slipped -0.8 point to 55.9 last month. According to survey agency IHS Markit, 'the three PMI surveys put the economy on course for another subdued 0.3% expansion in the third quarter, but the fourth quarter could see even slower growth'.
Forex Technical Analysis: EUR/USD, USD/JPY, GBP/USD
EUR/USD
Current level - 1.1728
The intraday bias is positive above 1.1713, for a test of 1.1830 major resistance. Key support lies at 1.1660.
| Resistance | Support | ||
| intraday | intraweek | intraday | intraweek |
| 1.1750 | 1.1830 | 1.1660 | 1.1660 |
| 1.1830 | 1.2070 | 1.1540 | 1.1480 |
USD/JPY
Current level - 112.66
My outlook is bearish below 112.90, for a slide towards 112.00 area.
| Resistance | Support | ||
| intraday | intraweek | intraday | intraweek |
| 112.90 | 113.80 | 112.30 | 111.50 |
| 113.80 | 114.50 | 111.50 | 107.30 |
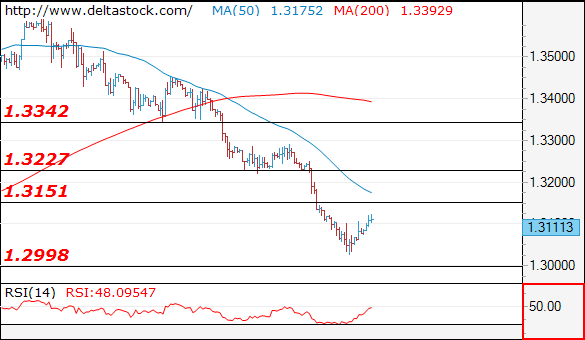
GBP/USD
Current level - 1.3113
The reversal above 1.3000 signals a positive outlook, for a test of 1.3150. An eventual violation of the latter will challenge 1.3220 zone.
| Resistance | Support | ||
| intraday | intraweek | intraday | intraweek |
| 1.3150 | 1.3340 | 1.3000 | 1.2910 |
| 1.3220 | 1.3650 | 1.2910 | 1.2760 |
Technical Outlook: SPOT GOLD Extends Recovery On Safe-Haven Buying After Daily Cloud Base Contained Larger Bears
Spot Gold starts the week in positive tone and rose to $1285 so far, after renewed geopolitical tensions over North Korea sparked fresh risk aversion.
The yellow metal extends recovery from last Friday after downtrend from $1357 (08 Sep peak) was contained by daily Ichimoku cloud base at $1265.
Fresh recovery extension generated bullish signal on break above initial barriers at $1278 (falling 10SMA / Tenkan-sen) which could extend recovery through $1292 (4-hr cloud top) and expose key near-term barrier at $1297 (daily cloud top / Fibo 38.2% of $1357/$1260 downleg). Sustained break here is needed to sideline underlying bears and signal stronger recovery.
Broken 100SMA offers strong support at $1273 which is expected to keep the downside protected.
Res: 1285, 1292, 1297, 1300
Sup: 1278, 1275, 1273, 1266
Technical Outlook: AUDUSD Remains In Red After Break Below Daily Cloud, Weak Chinese Data Weigh
The Aussie dollar remains in red on Monday, under pressure from downbeat Chinese Services PMI data but so far holding above Friday's spike low at 0.7732.
The pair holds in red for four consecutive weeks, with break below thick daily cloud last week seen as strong bearish signal for further extension of current wave C of five-wave sequence from 0.8124, which hit its 200% Fibonacci expansion on Friday and could travel to its FE 238.2% at 0.7665, which is reinforced by 200SMA.
A broken 100SMA cap today's action at 0.7785 and is expected to keep the upside limited, guarding key barrier at 0.7800 (broken daily cloud base, reinforced by falling Tenkan-sen).
Only sustained break above 0.7800 barrier would sideline immediate bears in favor of extended correction.
Res: 0.7785, 0.7800, 0.7825, 0.7865
Sup: 0.7732, 0.7700, 0.7665, 0.7620
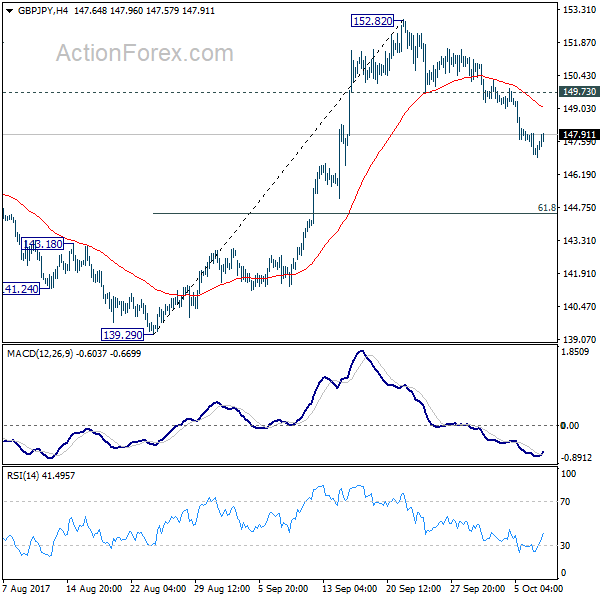
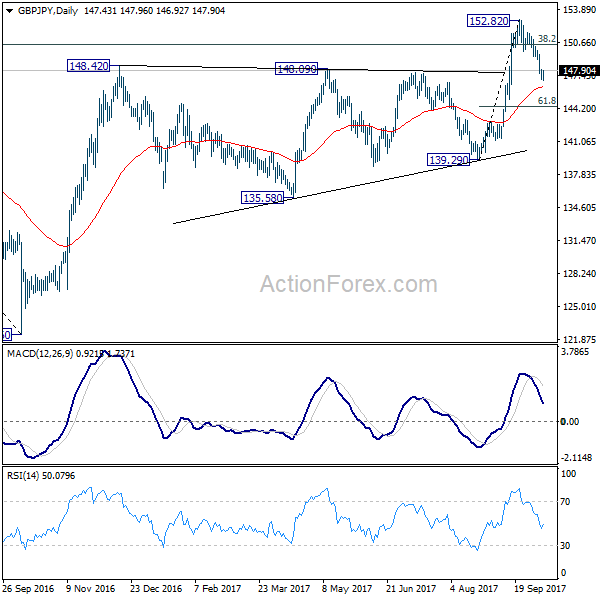
GBP/JPY Daily Outlook
Daily Pivots: (S1) 146.74; (P) 147.38; (R1) 147.73; More
With 149.73 minor resistance intact, fall from 152.82 is expected to continue to 61.8% retracement of 139.29 to 152.82 at 144.45. Such decline is seen as a correction and we'd look for strong support from 144.45 to bring rebound. On the upside, break of 149.73 support turned resistance will argue that the pull back is completed and turn bias back to the upside for retesting 152.82 high. However, sustained break of 144.45 will put 139.29 key support in focus.
In the bigger picture, medium term rebound from 122.36 is still expected to resume after corrective pull back from 152.82 completes. Firm break of 38.2% retracement of 196.85 to 122.36 at 150.43 will carry long term bullish implications. In that case, GBP/JPY could target 61.8% retracement at 167.78. However, break of 139.29 will indicate rejection from 150.43 key fibonacci level. And the three wave corrective structure of rebound from 122.36 will argue that larger down trend is resuming for a new low below 122.26.
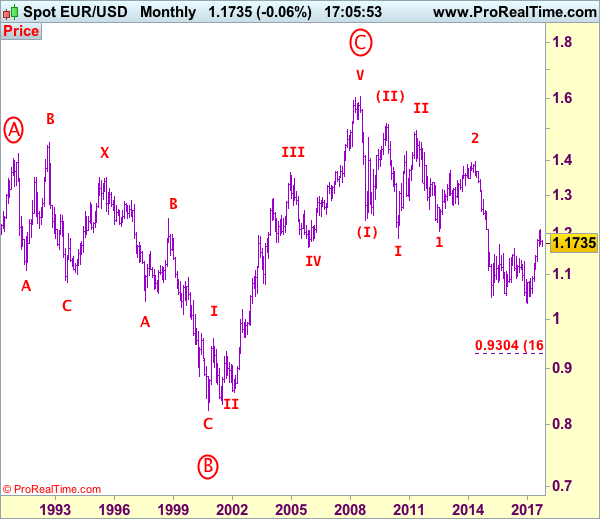
EUR/USD Elliott Wave Analysis
EUR/USD – 1.1738
EUR/USD: Wave (c) of 2 ended at 1.3993 and wave 3 of III has commenced for weakness to 1.0411 (1.236 of wave 1), then 1.0000.
Although the single traded lower again last week, the subsequent bounce from Friday’s low of 1.1669 suggests consolidation above this level would be seen and test of 1.1788 cannot be ruled out, however, break there is needed to suggest low is possibly formed, bring further gain to 1.1833 but only break there would signal the fall from 1.2093 top has ended, bring a stronger rebound to 1.1865-70 and then 1.1900-10, however, still reckon upside would be limited to 1.2005 and bring further consolidation. Only break of resistance at 1.2034 would signal the pullback from 1.2093 has ended and recent upmove from 1.0340 low has resumed for retest of 1.2093, then towards 1.2150-55 (61.8% projection of 1.1119-1.1910 measuring from 1.1662), having said that, loss of upward momentum should prevent sharp move beyond 1.2200-10 and price should falter below 1.2255-60, risk from there remains for a much-needed correction to take place later.
Our preferred count on the daily chart remains that a wave (II) from 1.2329 ended at 1.5145 with A-leg ended at 1.4720, followed by wave B at 1.2457, the wave C from there was also a 3 legged move and is labeled as (a): 1.3739, (b): 1.2885, the wave iii of the 5-waver (c) from 1.2885 has ended at 1.4339 and wave iv is a triangle ended at 1.3878 and wave v formed a top at 1.5145. The decline from there is a 5-waver (C) with minor wave (i) of I of (C) ended at 1.4218 with wave (ii) ended at 1.4580, wave (iii) ended at 1.3267 and wave (iv) ended at 1.3692 and wave (v) ended at 1.1876, this is also the low of wave I of (C) and wave II ended at 1.4940, hence wave III is now in progress with a diagonal wave 1 ended at 1.2042, the breach of previous support at 1.1876 (wave I trough) adds credence to our view that the wave 2 has ended at 1.3993, wave 3 has commenced for further weakness to 1.0411, then towards 1.0000.
On the downside, below said support at 1.1669 would signal the corrective fall from 1.2093 top is still in progress for retracement of recent rise to previous support at 1.1662 (previous 4th of a lesser degree), break there would extend weakness to 1.1600-10 and possibly 1.1550-60 but reckon downside would be limited to 1.1500 and support at 1.1479 should remain intact, bring rebound later.
Recommendation: Stand aside for this week.
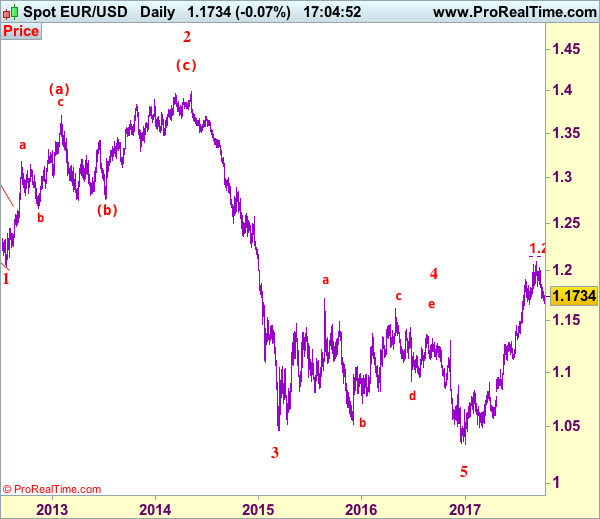
Euro's long-term uptrend started from 0.8228 (26 Oct 2000) with an impulsive structure. The rise from 0.8228 to 0.9593 (5 Jan 2001) is labeled as wave I, the retreat to 0.8352 (6 Jul 2001) is wave II and the rally to 1.3670 (31 Dec 2004) is wave III. Wave IV from there ended at 1.1640 (15 Nov 2005), the subsequent upmove to 1.6040 (July 15, 2008) is treated as wave V, the major selloff from the record high of 1.6040 to 1.2329 (October 27, 2008) signals a reversal has taken place with (I) leg ended at 1.2329 and once (II) ended at 1.5145, wave (III) itself is an extended move with I: 1.1876 and complex wave II ended at 1.4902, wave III has commenced with wave 1 and 2 ended at 1.2042 and 1.3993 respectively, wave 3 of III is now unfolding for weakness towards parity.